Quick Doctor In Kuwait +2773`7758`557 Kuwait Doha Qatar Dubai Abu Dhabi Sharj...
DuPont Fact Sheet
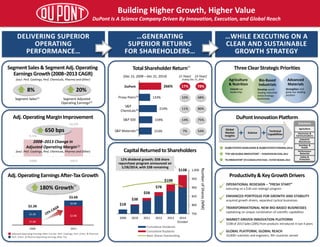
1. $1B
$3B
$5B
$7B
$10B
$13B
750
800
850
900
950
1,000
2009 2010 2011 2012 2013 2014
October
NumberofShares(MM)
Cumulative Dividends
Cumulative Buybacks
Basic Shares Outstanding
Building Higher Growth, Higher Value
DuPont Is A Science Company Driven By Innovation, Execution, and Global Reach
$1.0B
$2.8B
$1.2B
$0.8B
$2.2B
$3.6B
2008 2013
DELIVERING SUPERIOR
OPERATING
PERFORMANCE…
…GENERATING
SUPERIOR RETURNS
FOR SHAREHOLDERS…
…WHILE EXECUTING ON A
CLEAR AND SUSTAINABLE
GROWTH STRATEGY
Segment Adjusted
Operating Earnings(2)
Segment Sales(1)
8%
Adj. OperatingMarginImprovement
Adj. OperatingEarningsAfter-TaxGrowth
2008–2013 Change in
Adjusted Operating Margin(2)
(excl. Perf. Coatings, Perf. Chemicals, Pharma and Other)
Adjusted Operating Earnings After-Tax (ex. Perf. Coatings, Perf. Chem. & Pharma)
Perf. Chem. & Pharma Operating Earnings After-Tax
20%
12% dividend growth; $5B share
repurchase program announced on
1/28/2014, with $3B remaining
ThreeClearStrategicPriorities
(excl. Perf. Coatings, Perf. Chemicals, Pharma and Other) Agriculture
& Nutrition
Extend our
leadership
Advanced
Materials
Strengthen and
grow our leading
position
Bio-Based
Industrials
Develop world-
leading industrial
biotechnology
businesses
180% Growth(3)
SegmentSales& SegmentAdj. Operating
EarningsGrowth(2008–2013 CAGR)
650 bps Agriculture
Electronics &
Communications
Industrial
Biosciences
Nutrition &
Health
Performance
Materials
Safety &
Protection
Solutions
DuPontInnovationPlatform
24,000PATENTSWORLDWIDE&20,000PATENTSPENDING(2013)
“TOP100GLOBALINNOVATORS”–THOMPSONREUTERS,2013
“#1INNOVATOR”6THCONSECUTIVEYEAR–PATENTBOARD,2013
Global
Market
Insights
Science
Technical
Capabilities
Productivity& KeyGrowthDrivers
MARKET-DRIVEN INNOVATION PLATFORM
$10B of 2013 Sales (28%) from products introduced in last 4 years
GLOBAL PLATFORM, GLOBAL REACH
10,000+scientists and engineers, 90+ countries served
TRANSFORMATIONAL NEW BIO-BASED BUSINESSES
capitalizing on unique combination of scientific capabilities
ENHANCED PORTFOLIO FOR GROWTH AND STABILITY
acquired growth drivers, separated cyclical businesses
OPERATIONAL REDESIGN – “FRESH START”
executing on a $1B cost redesign program
TotalShareholderReturn
(Dec 31, 2008 – Dec 31, 2014)
266%
133%
214%
159%
153%
DuPont
Proxy Peers
S&P
Chemicals
S&P 500
S&P Materials
DuPont
(5)
(6)
(7)
(4)
17%
10%
11%
14%
7%
(1-Year)
78%
68%
80%
75%
54%
(3-Year)
Ending Dec 31, 2014
CapitalReturnedto Shareholders
2. The prior page includes company information that does not conform with generally accepted
accounting principles (GAAP). Management believes the use of these non-GAAP measures is
meaningful to investors because they provide insight with respect to operating results of the
company and additional metrics for use in comparison to competitors. These measures should
not be viewed as an alternative to GAAP measures of performance. Furthermore, these measures
may not be consistent with similar measures used by other companies. This data should be read
in conjunction with previously published company reports on Forms 10-K, 10-Q, and 8-K. These
reports are available on the Investor Center of www.dupont.com. Reconciliations of non-GAAP
measures to GAAP are also included herein.
FORWARD LOOKING STATEMENTS
This document contains forward-looking statements which may be identified by their use of words
like “plans,” “expects,” “will,” “believes,” “intends,” “estimates,” “anticipates” or other words of
similar meaning. All statements that address expectations or projections about the future,
including statements about the company's strategy for growth, product development, regulatory
approval, market position, anticipated benefits of recent acquisitions, timing of anticipated
benefits from restructuring actions, outcome of contingencies, such as litigation and
environmental matters, expenditures and financial results, are forward looking statements.
Forward-looking statements are not guarantees of future performance and are based on certain
assumptions and expectations of future events which may not be realized. Forward-looking
statements also involve risks and uncertainties, many of which are beyond the company’s control.
Some of the important factors that could cause the company’s actual results to differ materially
from those projected in any such forward-looking statements are: fluctuations in energy and raw
material prices; failure to develop and market new products and optimally manage product life
cycles; significant litigation and environmental matters; failure to appropriately manage process
safety and product stewardship issues; changes in laws and regulations or political conditions;
global economic and capital markets conditions, such as inflation, interest and currency exchange
rates; business or supply disruptions; security threats, such as acts of sabotage, terrorism or war,
weather events and natural disasters; ability to protect and enforce the company's intellectual
property rights; successful integration of acquired businesses and separation of underperforming
or non-strategic assets or businesses and successful completion of the proposed spinoff of the
Performance Chemicals segment including ability to fully realize the expected benefits of the
proposed spinoff. The company undertakes no duty to update any forward-looking statements as
a result of future developments or new information.
ADDITIONAL INFORMATION AND WHERE TO FIND IT
DuPont intends to file a proxy statement with the U.S. Securities and Exchange Commission (the
"SEC") with respect to the 2015 Annual Meeting. DUPONT STOCKHOLDERS ARE STRONGLY
ENCOURAGED TO READ ANY SUCH PROXY STATEMENT, THE ACCOMPANYING WHITE PROXY CARD
AND OTHER DOCUMENTS FILED WITH THE SEC CAREFULLY IN THEIR ENTIRETY WHEN THEY
BECOME AVAILABLE BECAUSE THEY WILL CONTAIN IMPORTANT INFORMATION.
DuPont, its directors, executive officers and other employees may be deemed to be participants in
the solicitation of proxies from DuPont stockholders in connection with the matters to be
considered at DuPont’s 2015 Annual Meeting. Information about DuPont’s directors and
executive officers is available in DuPont’s proxy statement, dated March 14, 2014, for its 2014
Annual Meeting. To the extent holdings of DuPont’s securities by such directors or executive
officers have changed since the amounts printed in the 2014 proxy statement, such changes have
been or will be reflected on Statements of Change in Ownership on Form 4 filed with the SEC.
More detailed information regarding the identity of potential participants, and their direct or
indirect interests, by security holdings or otherwise, will be set forth in the proxy statement and
other materials to be filed with the SEC in connection with DuPont’s 2015 Annual Meeting.
Stockholders will be able to obtain any proxy statement, any amendments or supplements to the
proxy statement and other documents filed by DuPont with the SEC free of charge at the SEC's
website at www.sec.gov. Copies will also be available free of charge at DuPont’s website at
www.dupont.com or by contacting DuPont Investor Relations at (302) 774-4994.
Year Year Year
2013 2011 2008
Total Segment Sales (a)
36,046 34,087 26,499
Less: Performance Chemicals (b)
6,932 8,055 6,245
Less: Other 6 40 160
Total Segment Sales (excluding Performance Chemicals and Other) 29,108 25,992 20,094
(a) Segment sales includes transfers.
SEGMENT ADJUSTED OPERATING EARNINGS
Segment Pre-tax Operating Income (PTOI) (GAAP) (c)
5,369 5,881 3,373
Less: Performance Chemicals PTOI (b)
941 2,162 619
Less: Other/Pharma PTOI (340) (55) 839
Less: Corporate Expenses (d)
605 496 479
Add: Significant Items (e)
487 383 466
Segment Adjusted Operating Earnings (excluding Performance Chemicals and Other/Pharma) (f)
(Non-GAAP) 4,650 3,661 1,902
(b) Prior periods reflect the reclassifications of Viton®
fluoroelastomers from Performance Materials to Performance Chemicals.
(e) Represents significant items included in Segment PTOI, excluding those related to Performance Chemicals and Other/Pharma.
E. I. DU PONT DE NEMOURS AND COMPANY AND CONSOLIDATED SUBSIDIARIES
RECONCILIATION OF NON-GAAP MEASURES (UNAUDITED)
(d) Represents total corporate expenses excluding significant items, an estimate of DuPont Performance Coatings residual costs and an estimate for an amount
that would be allocated to Performance Chemicals.
(f) Segment adjusted operating margin (non-GAAP) is based on total segment sales and segment adjusted operating earnings, excluding Performance Chemicals
and Other/Pharma.
(dollars in millions)
SEGMENT SALES
(c) Segment PTOI is defined as income (loss) from continuing operations before income taxes excluding non-operating pension and other postretirement employee
benefit costs, exchange gains (losses), corporate expenses and interest.
Year Year
2013 2008
Income From Continuing Operations After Income Taxes (GAAP) 2,863 2,083
Add: Significant Items Charge - After-tax 423 378
Add: Non-Operating Pension & OPEB Costs / (Credit) - After-tax 360 (250)
Less: Net Income Attributable to Noncontrolling Interests 14 4
Less: Pharma Operating Earnings - After-tax (a)
21 666
Less: Performance Chemicals Operating Earnings - After-tax (b), (c)
804 537
Adjusted Operating Earnings - After-tax (excluding Performance Chemicals and Pharma) (Non-GAAP) 2,807 1,004
RECONCILIATION OF DILUTED EPS
GAAP EPS from continuing operations 3.04 2.28
Less: Performance Chemicals (b),(c)
0.80 0.54
Less: Pharma (a)
0.02 0.73
Add: Non-Operating Pension & OPEB Costs / (Credits) 0.39 (0.28)
EPS (excluding Pharma and Non-Operating Pension & OPEB Costs) (Non-GAAP) 2.61 0.73
(a) Pharma operating earnings assumes a 35% tax rate.
E. I. DU PONT DE NEMOURS AND COMPANY AND CONSOLIDATED SUBSIDIARIES
RECONCILIATION OF NON-GAAP MEASURES (UNAUDITED)
(dollars in millions, except per share)
(b) Performance Chemicals operating earnings assumes a base income tax rate from continuing operations of 20.8% and 20.4% for 2013
and 2008, respectively.
ADJUSTED OPERATING EARNINGS AFTER INCOME TAXES
(c) Prior periods reflect the reclassifications of Viton
®
fluoroelastomers from Performance Materials to Performance Chemicals.
(1) Segment sales include transfers. CAGR is calculated excluding Performance Coatings, Performance Chemicals and Other
(2) Segment adjusted operating earnings and margins are calculated using segment pre-tax operating income (GAAP) excluding significant items; calculations included certain corporate expenses and excluded adjusted operating earnings of Performance
Coatings, Performance Chemicals, Pharma and Other. See non-GAAP reconciliations above
(3) Adjusted operating earnings after-tax is defined as income from continuing operations after-tax (GAAP) excluding non-operating pension/OPEB costs and significant items. Reconciliations of non-GAAP measures to GAAP are included above
Source: Datastream as of 12/31/2014, Bloomberg, Capital IQ, FactSet
(4) Proxy Peers and S&P Indices are USD market cap-weighted and assume dividends are re-invested at the closing price applicable on the ex-dividend date
(5) Proxy Peers consists of 3M, Air Products, Baxter Intl, Boeing, Caterpillar, Dow, Emerson, Honeywell, Ingersoll Rand, Johnson Controls, Johnson and Johnson, Kimberly Clark, Merck, Monsanto, Procter and Gamble, Syngenta AG, and United Technologies
(6) S&P Chemicals in 2014 consists of Airgas, Air Products, CF Industries, Dow, DuPont, Eastman Chemical, Ecolab, FMC, IFF, LyondellBasell, Monsanto, Mosaic, PPG, Praxair, Sherwin-Williams, and Sigma-Aldrich
(7) S&P Materials in 2014 consists of Air Products, Airgas, Alcoa, Allegheny Technologies, Avery Dennison, Ball, Bemis, CF Industries, Dow Chemical, DuPont, Eastman Chemical, Ecolab, FMC, Freeport-McMoRan, IFF, International Paper, LyondellBasell, Martin
Marietta Materials, MeadWestvaco, Monsanto, Mosaic, Newmont Mining, Nucor, Owens Illinois, PPG, Praxair, Sealed Air, Sherwin-Williams, Sigma-Aldrich, and Vulcan Materials