IRJET-Impact on Employment via Public Transit System
CTSEM2014 118
1. Colloquium on Transportation Systems Engineering and Management
CTR, CED, NIT Calicut, India, May 12-13, 2014.
Paper Id: 118
MULTINOMIAL LOGISTIC REGRESSION MODELLING FOR
PERCEPTION EVALUATION OF COMMUTERS TO WORK
USING BUS TRANSPORT
Ms Kamini Gupta1
, Dr. Ravindra Kumar2,
, Dr. Neelima Chakrabarty3
, Mr. Satyendra
Tomar4
1
Sr. Technical Officer, CSIR-CRRI, Mathura Road, New Delhi-110025,kgupta.crri@nic.in,
kamini_marut@rediffmail.com
2
Principal Scientist, CSIR-CRRI, Mathura Road, New Delhi-110025, ravinder.crri@nic.in
3
Sr. Principal Scientist, CSIR-CRRI, Mathura Road, New Delhi-110025,neelima.crri@nic.in
4
Project Fellow, CSIR-CRRI, Mathura Road, New Delhi-110025,
satyendra.tomar90@gmail.com
Abstract
Commuting to work by bus is still one of the major transportation system in Delhi.
Delhi government has introduced several reforms in services and it is found that the per
capita trip rate (excluding walk trips) has increased from 0.72 in 1981 to 0.87 in 2001.
It is estimated that per capita trip rate may reach to 1.2 by 2021 in Delhi. There is
always a gap between satisfactions of user due to increase in trip rate and offered
services by Delhi Transport Corporation. The major challenges to provide services are
in terms of quality service indicators such as travel time, comfort, information system,
accessibility, safety, different type of service offered, customer service, environmental
impact etc. to improve overall quality by transport authority. To know the service
performance of bus transportation one of the good method is User Perception Survey.
The users’ perception about services offered by transit system plays a essential role in
its success. It is therefore important to know the parameters which significantly
influence user’s perception regarding bus services, knowing which one will impact
more to improve the quality of transport services, as the public transportation improves
the quality of life across the country by providing safe, economical and efficient
services.
In this paper research work is presented for evaluation of user perception of commuting
passenger coming to CRRI Office in Delhi for official work. The age group of the
passenger is considered adult those who are coming to office from different directions
of Delhi. User Perception data has been collected by face to face interview.
Respondents were asked to give their perception of the quality level across the different
factors as well as satisfaction level toward their Bus services. A variable reduction
technique (PCA) was used to identifyinfluential variables & using these variables a
Multinomial Logistic (MNL) Regression model (using STATA) was formed for
Commuters satisfaction & their Comfort level. The model showed a higher degree of
precision when compared with real-life data.
Keywords
Bus user perception, official commute, Transportation, MNL
2. 1. INTRODUCTION
Public transport should become part of a solution for sustainable transport in the
future. However, in order to keep and attract more passengers, public transport must to have
high service quality to satisfy and fulfil more wide range of different customer’s needs.20, 21
.It is important to summarize knowledge about what drives customer satisfaction and
dissatisfaction in public transport area to design an attractive and marketable public transport.
The focus of this is Delhi Public Transport (bus) where the number of private vehicles is
increasing rapidly.
For a public transport service to function efficiently, it should be operated &
maintained keeping the user perception in focus. The user’s perception about services offered
by transit systems play a pivotal role in its success. It is therefore essential to know the
parameters which significantly influence user’s perception regarding bus services, knowing
which it is easier to improve the quality of transport services. Research on service quality has
been done from various aspects from a very long time; sufficient research has been
contributed in developing the service quality concept. There is a need for conceptual changes
to be built as the present concept of service quality does not fit the multidimensional
situations across nations.1,2,3,6,7
.In the current scenario of globalization, public transportation
services (PTS) need to introspect sensitivity towards the quality of services offered. In this
context, a study was carried out by Kokku18
to examine the commuters’ perception on service
quality offered by the public transport services of twin cities of Hyderabad and
Secunderabad, India.
For this purpose surveys were conducted in CSIR-Central Road Research Institute
(CRRI) Campus & commuters response on questionnaire prepared was collected. A
questionnaire with 30 questions has been prepared and used as opinion survey Performa for
conducting the survey. Data has been generated by face to face interview. Respondents have
been asked to give their perception of the quality level across the different factors as well as
satisfaction level toward their Bus services. The surveys encompass evaluation from CRRI
staff. The limitation of the survey conducted was most of the respondent were from South
Delhi and adult working class commuter.
1.1 Objective of the Research Study
The main objective of our study is to analyze data and modelling of bus user
perception survey and to find the appropriate quality parameter of bus passenger in Delhi
using Principle Component Analysis and Multinomial Logistic Regression technique. The
prior technique is use to reduce the number of variables affecting bus user perception and
later for modelling of the reduced variables in terms of time saving, cost saving, comfort,
environment, safety enhancement and commuter satisfaction.
2. METHODOLOGY
First the User Perception Survey questionnaire was prepared which includes 30
parameters (service quality indicators) like comfort, safety, waiting time, frequency, safety &
security, maintenance & construction, economic /financial viability) etc. More than 400
performance indicators, each assessed based on its performance category and then only 30
chosen 4, 10, 15,16,17,19.
Then the survey was conducted inside CRRI campus. Questions were
asked by face to face interview.
3. Finally analysis done using variable reduction technique (PCA) to identify influential
variables & using these variables a Multinomial Logistic Regression model was carried out
for commuter’s satisfaction & their comfort level.8, 9, 12, 13
2.1 Detailed methodology as follows:
2.1.1 Flow Chart of Methodology
To assess the quality of user perception in this paper, various set of variables were define to
the set indicators and selected to evaluate the current situation and the strategies. A Flow
chart Fig. 1 explains the steps involved like data collection, bus user attributes selected, use
of PCA & multinomial regression and finally satisfaction for Overall rating to DTC buses.
Fig 1. Flow Chart of Methodology
2.1.2 Preparation of Questionnaire
After reviewing of various services quality parameters as mentioned in review of Task
Force Group, the following variable were selected as attributes for user perception in basic
questionnaire design.
1. Gender 2. Age of Respondent 3. Education 4. Availability of personalized mode
5. Monthly income 6. Purpose of trip 7. Frequency of your travel on the routes 8. How do you
reach the bus stop? 9. What is your mode to reach the destination after alighting the bus?
10. General Information 11. How often do you ride the bus? 12. How often is the bus late?
13. How clean are the buses? 14. What is the condition of the buses (windows, seats)? 15.
How crowded are the buses? 16. Does the bus come to a complete stop at bus stops? 17. Does
the bus stop right in front of the bus stops? 18. Is the bus stop sufficient in size? 19. Does the
bus stop enough shade with respect to heat and rain? 20. On average, how long do you have
to walk to get to a bus stop? 21. On an average, how long do you have to wait for a bus?
22. Have you ever been assisted by a conductor to get a seat reserved for you? 23. Do you
have any information regarding the PMPML helpline? 24. If yes, have you ever used the
helpline for filing complaints? 25. If yes, did you receive any favorable response? 26. How
do you find the bus fares? 27. Keeping all the factors in mind, what according to you would
be the overall grade to the DTC service? 28. What are the reason(s) for using the bus?
29. Apart from bus how do you commute? 30. Do you think existing bus transport system is
beneficial to you on this corridor?
3. DATA COLLECTION:-
4. A survey was conducted in CRRI campus for two days on 08/04/2013 and 09/04/2013
from 9:30 AM to 4:30 PM and questions were asked by our team from the CRRI staff
including regular and temporary staff. Around 250 samples were collected from all the
divisions in the campus. In the data collected 52% were male and 48% were female and 58%
were of the age group of 30-59 years and 42% of 20-29 years. Complete User Perception
Survey was filled and obtained from the interviewer.
4. STEPS INVOLVED IN DATA ANALYSIS
4.1 Reducing Variable
First stage of modelling is to reduce the data set. In order to reduce a data set
containing a large number of inter-correlated variables to a data set containing fewer
variables, which represent a large fraction of the variability contained in the original data
Principal Component Analysis, is used. PCA is a variable reduction technique. It is a
multivariate statistical technique which can help t o get a better understanding of the
dependencies existing among a set of inter-correlated variables. PCA is conducted on
centred data or anomalies, and is used to identify patterns of simultaneous variations. These
components are simply linear combinations of the original variables with coefficients given
by the Eigen vectors. A property of component is that each contributes to the total
explained variance of the original variables. The analysis scheme requires that the
component contribution occur in descending order of magnitude, such that the largest amount
of variance of the first component explains the largest amount of variance of the original
variables, the second the next largest, and so on. In PCA, the number of extracted
components is equal to the number of input variables, there are ten sizing variables so ten
components are extracted, but only component with large amount of total variance are
selected for applying to the next step.
4.2 Logistic Regression
Logistic regression is useful for situations in which you want to be able to predict the
presence or absence of a characteristic or outcome based on values of a set of predictor
variables. It is similar to a linear regression model but is suited to models where the
dependent variable is dichotomous. Logistic regression coefficients can be used to estimate
odds ratios for each of the independent variables in the model. Logistic regression is
applicable to a broader range of research situations than discriminant analysis. After
performing and analysis findings from questionnaire are found out 16, 18, 19
.
4.3 User Perception from Questionnaire
Summary and findings of the sample is given below:
a) Condition of Buses: The condition of the buses was rated as Bad, Fairly Good and Very
Good. It was found that 28.84% responded with bad condition, Fairy good with 65.38%
respondent, and 5.76% rated very well to Delhi Transport Corporation buses as shown in
Figure 12.
b) Response on Bus Fare: The fare structure of the buses was rated as cheap, reasonable, and
costly. It was found that 5.76% responded with cheap condition, reasonable with 61.53%
5. respondent, and 32.69% rated costly fare for Delhi Transport Corporation buses as shown in
Figure 14.
c) Frequency of Bus Ride: The frequency of bus ride was classified into Daily, 4-5 time per
week, weekly, occasionally. It was found that 38% respondent for Daily, 27% respondent for
4-5 time per week, 12% respondent for weekly, 23% respondent for Occasionally travel in
Delhi Transport Corporation buses as shown in Figure 7.
d) Waiting time for buses: Waiting time for buses was classified into 1-3 minute/4-6 minute/
7-10 minute/ 10+ minute. It was found that 3.84% respondent wait for 1-3 minute, 26.92%
respondent waits for 4-6 minute, 28.84% respondent wait for 7-10 minute, and 40.38%
respondent waits for more than 10 minute to board the buses of Delhi Transport Corporation
buses a0s shown in Figure 11.
e) Comfort in Buses: Comfort in buses was classified into stand uncomfortably, stand
comfortably, and always get to sit. It was found that 63% respondent said they stand
uncomfortably in DTC buses, 25% respondent said they stand comfortably in buses, 12%
said they always get to sit in DTC buses as shown in Figure 10.
Other findings like age, gender details, availability of vehicles, income, purpose of trip,
frequency of travel, cleaninesscleanliness, comfort, maintenance, information regarding DTC
helpline, Overall grade to DTC services, Reason for using buses etc are shown in (Figure 2 to
Figure 18)
42%
58%
20-29
30-59
Fig 2. Age of Respondents
52%
48%
Male
Female
Fig 3. Gender of Respondents
Formatted: Normal, Left
6. 90%
4%2%2% 2%
Fig 4. Purpose of Trip
Work
Business
Education
Social
Leisure
2%
19%
40%
21%
12%
2%
2%
2%
<5000
5001-15000
15001-30000
30001-50000
50001-75000
75001-1 lakh
1 lakh-1.5 lakh
>1.5 lakh
Fig 5. Income
77%
2%
6%
2% 4%
9%
Fig 6. How do you reach Bus Stop?
Walk
Cycle
Bus
Two Wheeler
Car
Others
38%
27%
12%
23%
Fig 7. Frequency of Travel
Daily
4-5 times a
week
Weekly
Occasional
6%
48%
46%
Fig 8. Cleanliness
Very Dirty
Dirty
Clean
94%
2%
2%
2%
Fig 9. How do you reach Destination
after alighting the bus?
Walk
Bus
Two Wheeler
Others
63%
25%
12%
Fig 10. Comfort
Stand
Uncomfortably
Stand Comfortably
Always get to sit
4%
27%
29%
40%
Fig 11. Waiting Time
1-3 minute
4-6 minute
7-10 minute
10+ minute
7. 5. MULTINOMIAL LOGISTIC REGRESSION MODELLING:-
5.1 Principle Component analysis
Analysis of data is carried out in two steps for this research. First Principle
Component Analysis (PCA) was used to reduce the variables and it is done using the
software XLSTAT. And secondly Multinomial Regression was done on the output of PCA
using STATA.
29%
65%
6%
Fig 12. Condition of Buses
Bad
Fairly Good
Very Good
34%
66%
Fig 13. Size of Bus stop
Yes
No
6%
61%
33%
Fig 14. Fare
Cheap
Reasonable
Costly
25%
41%
17%
17%
Fig 15. How long do you wait for a
bus?
1-5 minute
6-10 minute
11-15 minute
15+ minute
21%
79%
Fig 16. Information regarding DTC
helpline
Yes
No
2%
56%
29%
7% 6%
Fig 17. Overall Grade to DTC
services
Excellent
Good
Average
Poor
Pathetic
90%
10%
Fig 18. DTC system beneficial for
you?
Yes
No
8. 5.2 Findings from PCA
Nine important parameters from thirty parameters were segregated depending on
Eigen value (>/= to 1) and maximum squared cosine values (greater than 0.5). XLSTAT is
software u s ed fo r data analysis. This was a l s o used for computing Principal
Component Analysis (PCA) and obtained nine parameters are:
1) Purpose of Trip: Work / Business / Education / Social / Leisure
2) Education: Below graduate/graduate/PG
3) What is your mode to reach the destination after alighting the Bus? Walk / Cycle /
Bus / Two Wheeler / Car / Others
4) How often do you ride the bus? Never/ 2-3 times per week/ 4-5 times per
week/Everyday
5) How often is the bus late? Never/ 1-2 times per week/3-4 times per week/ Always
6) How clean are the buses? Very Dirty/ Dirty/Clean
7) How crowded are the buses? Stand Uncomfortably/ Stand Comfortably/ Always get
to sit
8) On average, how long do you have to walk to get to a bus stop? 1-5 minute/ 6-10
minute/ 11-15 minute/ 15+ minute
9) On an average, how long do you have to wait for a bus? 1-3 minute/ 4-6 minute/ 7-10
minute/ 10+ minute.
5.3 Reduction of variable
These nine variables as selected from principal component analysis are used as an
input for Multinomial logistic Regression technique. Multinomial Logistic Regression is
useful for situations in which we want to classify subjects based on values of a set of
predictor variables. This type of regression is similar to logistic regression, but it is
more general because the dependent variable is not restricted to two categories. Dependent
variable taken as Overall customer satisfaction for DTC buses and independent variable as
output from PCA. Result obtained from Multinomial logistic Regression technique is shown
in Table (1 to 3) below as: Table 1 shows the model fitting information.
Table 1. Model Fitting Information
In the linear regression model, the coefficient of determination, R2
, summarizes the
proportion of variance in the dependent variable associated with the predictor (independent)
variables, with larger R 2
values indicating that more of the variation is explained by the
model, to a maximum of 1. The following methods are used to estimate the coefficient of
determination.
Cox and Snell's R2
1 is based on the log likelihood for the model compared to the log
likelihood for a baseline model. However, with categorical outcomes, it has a theoretical
maximum value of less than 1, even for a "perfect" model.
Model
Model
Fitting
Criteria Likelihood Ratio Tests
-2 Log
Likelihood Chi-Square df Sig.
Intercept
Only
116.703
Final 25.707 90.996 100 .729
Commented [Ravi1]: Where is the models parameters of MLR
like coefficients, variables /// thast is important part of models
results..
9. Nagelkerke's R2
2 is an adjusted version of the Cox & Snell R-square that adjusts the scale of
the statistic to cover the full range from 0 to 1.
McFadden's R2
3 is another version, based on the log-likelihood kernels for the intercept-
only model and the full estimated model.
From our test all these values are less than 1 as shown in Table 2, which satisfies the result
Table 2. Pseudo R Square
5.4 Chi-Square-Based Fit Statistics
The Table 3 in the output is the Goodness-of-Fit table. This table contains Pearson's
chi-square statistic for the model and another chi-square statistic based on the deviance.
These statistics are intended to test whether the observed data are inconsistent with the fitted
model or not. If they are not-that is, if the significance values are large-then you would
conclude that the data and the model predictions are similar and that you have a good model.
Table 3: Goodness of Fit
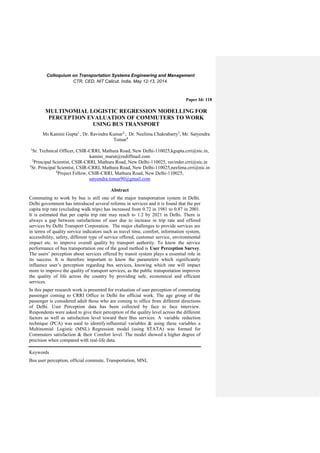
5.5 Overall Rating according to MLR Model
Figure 26 shows overall rating obtained from the MLR model and compared with Bus
Passenger Survey. at CRRI office . The results of this models difference shows overall
customer satisfaction in terms of excellent, good, average , poor and pathetic from model and
real world data. For excellent overall grading of Delhi Transport Corporation was found 2%
both in model and real world data. Similarly pathetic overall grading of DT was 6 % in both
model and real passenger survey. Model shows only 7% difference for Good Overall grading
and however for average and poor overall satisfaction grading there was 10% difference in
real data from passenger survey and model. The result of the models shows that model is very
accurate for certain grading like extreme rating (Excellent, poor and pathetic) and also predict
up to 90% correct for good and average satisfaction rating).
Pseudo R-Square
Cox and Snell 0.826
Nagelkerke 0.924
McFadden 0.779
Goodness-of-Fit
Chi-Square df Sig.
Pearson 28.448 100 1
Deviance 25.706 100 1
Formatted: Font: Font color: Black, Complex Script Font: Not
Bold, (Complex) Arabic (Saudi Arabia), English (India),
Condensed by 0.05 pt
Formatted: Font: Font color: Black, Complex Script Font: Not
Bold, (Complex) Arabic (Saudi Arabia), English (India),
Condensed by 0.05 pt
Formatted: Font: Font color: Black, Complex Script Font: Not
Bold, (Complex) Arabic (Saudi Arabia), English (India),
Condensed by 0.05 pt
Formatted: Font: Font color: Black, Complex Script Font: Not
Bold, (Complex) Arabic (Saudi Arabia), English (India),
Condensed by 0.05 pt
Formatted: Font: Font color: Black, Complex Script Font: Not
Bold, (Complex) Arabic (Saudi Arabia), English (India),
Condensed by 0.05 pt
10. Figure 19. Comparison of Overall Satisfaction RatingCRRI Survey and MLR result
6. CONCLUSION
Results found that in general condition of DTC buses are satisfactory but comfort
wise stand uncomfortably is 63% and 41% responds waiting time is almost 10 minutes. Bus
conditions are fairly good with 65% respondent, 29% bad and 6% rated very well to Delhi
Transport Corporation buses. Study found that fare for Delhi Transport Corporation buses are
61% responded reasonable, 33% responded costly and only 6% responded cheap. Bus user’s
populations are quite young. But as the age increases bus users decreases. It was found that in
general overall rating of DTC buses lie in terms of good (56%) to average (29%) others are
excellent only 2%, poor 8% and pathetic 6%. From the model overall ratings are almost
similar from good (52%) to average (32%) and excellent, poor & pathetic are exactly same.
The result of the Multinomial Regression model shows that model is very accurate for certain
grading like extreme rating (Excellent, poor and pathetic) and also predict up to 90% correct
for good and average satisfaction rating).
Such a study, will also serve to track the quality of service over time and help
advocacy groups as well as users to press for improvements. Such system can act as a
running performance audit for public transportation system from user perspective point of
view.
Acknowledgement
The authors are thankful to the Director, Central Road Research Institute, New Delhi for
permitting to publish this paper. Authors are thankful to Dr. E. Madhu, Champion of the
SUSTRAN project, 12th
five year plan project, CSIR-CRRI for his kind support. Paper has
been prepared based on data collected in SUSTRANS project and produced.
References
1. Brady Michael K, Jr Cronin & Jr. Joseph (2001). Customer Orientation: Effects on
Customer Service Perceptions and Outcome Behaviors, Journal of Service Research, 3:
241
0
10
20
30
40
50
60
Excellent Good Average Poor Pathetic
Observed Rating
MLR Rating
11. 2. Chavi Dhingra (2011). Measuring Public Transport Performance measures, Sustainable
Urban Transport Technical Document 9, GIZ, BMZ, Federal Ministry of Economic and
Cooperation, Germany.
3. Delhi Traffic and Forecast Study, Transport Demand Forecast Study & Development of
an Integrated Road Cum Multi-Modal Public Transport Network for the NCT of Delhi,
RITES Ltd, MVA Asia Ltd, TERI, June 9th 2008.
4. Dinesh Mohan (2009). Public Transportation Systems for Urban Areas A Brief Review,
TRIPP IIT Delhi.
5. Eboli L & Mazzulla G (2008a). An SP experiment for measuring service quality in public
transport, Transportation Planning and Technology, 31(5), 509–523.
6. Eboli L & Mazzulla G (2008b). Willingness-to-pay of public transport users for
improvement in service quality, European Transport, 38, 107–118.
7. Gronroos C (1982). An applied service marketing theory, European Journal of Marketing,
16(7), 30-41.
8. J Anable (2005). Complacent car addicts or aspiring environmentalists? Identifying travel
behaviour segments using attitude theory. Transport Policy, 12 (1), 65-78
9. K. Deb & M. Filippini, Public bus transport demand elasticities in India, Quaderno N. 10-
02, Decanato della Facoltà di Scienze economiche,Via G. Buffi, 13 CH-6900 Lugano.
10. Kokku Randheer, Ahmed A AL-Motawa, J Vijay Prince (2011). Measuring Commuters
Perception on Service Quality Using SERVQUAL in Public Transportation, International
Journal of Marketing Studies, 3(1), 21-34.
11. Oliver R. L. (1980). A cognitive model of the antecedents and consequences of
satisfaction decisions. Journal of Marketing Research, 17, 460-469.
12. Parasuraman A, Zeithaml V and Berry L.L (1985). A conceptual model of service quality
and its implications for future research, Journal of Marketing, 49, 41-50.
13. Parasuraman A., Berry L.L & Zeithaml V. (1991). Refinement and reassessment of the
SERVQUAL scale, Journal of Retailing, 57(3), 25-48.
14. Pune Mahanagar Parivahan Mahamandal Limited Report Card 2010-11
15. Ryus P, Coffel K, Parks Perk, V Cherrington, V Arndt, J Nakanishi Y & Gan A, A (2010).
Methodology for Performance Measurement and Peer Comparison in the Public
Transportation Industry, TCRP Report 141 (Transportation Research Board Washington
D.C.).
16. Sahai Sanjiv N, Bishop Simon & Singh Jaspal (2009). Bus System Reforms in Delhi,
UITP Asia Pacific Assembly, Delhi Integrated Multi-Modal Transit System Limited (A
joint venture of GNCTD and IDFC) 1-11.
17. State of Art Sustainable Transportation System, 12th Five Year plan Projects, CSIR-
CRRI, 2013.
18. State Transport Undertakings: Profile and Performance: Report from Central Institute of
Road Transport (CIRT) 2010.
19. Sudin Bag & Dr. Som Sankar Sen (2012). Kolkata Metro Railway and Customer
Satisfaction: An Empirical Study International, Journal of Multidisciplinary Research
ISSN 2231 5780, 2(3), 165-176.
20. Survey of Sydney Metropolitan Bus Users 2010
21. http://www.xlstat.com/en/.