
Empfohlen
Empfohlen
Weitere ähnliche Inhalte
Was ist angesagt?
Was ist angesagt? (20)
Ähnlich wie 20200407 asia covid 19 - grocery retail survey - thailand v final-ds v2
Ähnlich wie 20200407 asia covid 19 - grocery retail survey - thailand v final-ds v2 (20)
Kürzlich hochgeladen
Kürzlich hochgeladen (20)
20200407 asia covid 19 - grocery retail survey - thailand v final-ds v2
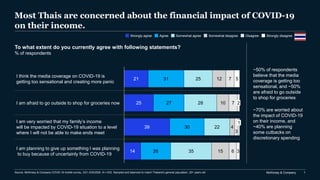
- 1. McKinsey & Company 1 Most Thais are concerned about the financial impact of COVID-19 on their income. 21 25 39 14 31 27 30 26 25 28 22 35 12 10 4 15 7 7 3 6 5 3 I am afraid to go outside to shop for groceries now I think the media coverage on COVID-19 is getting too sensational and creating more panic I am very worried that my family’s income will be impacted by COVID-19 situation to a level where I will not be able to make ends meet I am planning to give up something I was planning to buy because of uncertainly from COVID-19 1 2 To what extent do you currently agree with following statements? % of respondents Strongly agree Agree Somewhat agree Somewhat disagree Disagree Strongly disagree ~50% of respondents believe that the media coverage is getting too sensational, and ~50% are afraid to go outside to shop for groceries ~70% are worried about the impact of COVID-19 on their income, and ~40% are planning some cutbacks on discretionary spending Source: McKinsey & Company COVID-19 mobile survey, 3/21-3/25/2020, N = 633. Sampled and balanced to match Thailand’s general population, 20+ years old.
- 2. McKinsey & Company 2 Thai consumers report a strong focus on healthy habits, product safety, and environmental impact. 42 45 29 26 10 39 33 40 36 15 17 17 24 28 15 3 6 21 3 23 16 1 I am focusing on improving my immunity through more exercise and healthy eating 1 1 1 I will care more about product safety after COVID-19 situation 2 2 1 2 I will spend more time to understand product safety for my grocery purchases, manufacturing processes after COVID-19 outbreak 2I will consider grocery products that are more environmental-friendly after the COVID-19 outbreak I will buy more foreign grocery products after the COVID-19 outbreak Strongly agree DisagreeSomewhat agreeAgree Somewhat disagree Strongly disagree To what extent do you currently agree with following statements? % of respondents More than 80% are conscious about improving immunity through exercise and healthy eating ~80% of consumers intend to focus more on product safety post-COVID-19, and 70% will spend more time to understand the safety of grocery purchases These trends do not appear to significantly shift preferences toward foreign products, with only 25% preferring these products after the outbreak Source: McKinsey & Company COVID-19 mobile survey, 3/21-3/25/2020, N = 633. Sampled and balanced to match Thailand’s general population, 20+ years old.
- 3. McKinsey & Company 3 Consumers appear to be reducing their dine-in spending during COVID-19, and plan to do so after. 1.Q: How has your spending per month changed during the COVID-19 outbreak compared to before the COVID-19 outbreak for each of the below items? 2.Q: How do you expect your spending per month to change after the COVID-19 outbreak compared to now (during the COVID-19 outbreak)? 3.Net intent is calculated by subtracting the percent of respondents stating they expect to decrease/stop spend from the % of respondents stating they expect to increase/start spend. Spend preference during COVID-19 vs. prior to COVID-19,1 Net intent3 Spend preference after COVID-19 vs. during COVID-19,2 Net intent3 Groceries purchased from grocery stores +33% Dine in restaurant -55% -24% Ready made food purchased from grocery stores +9% +13% Food from restaurants delivered to home +23% +41% +25% Take out +23% +26% Decrease Stay the same Increase Grocery spending is growing the fastest across categories, during and post- COVID-19 Even after COVID-19, consumers indicate less of a preference for dine-in Source: McKinsey & Company COVID-19 mobile survey, 3/21-3/25/2020, N = 633. Sampled and balanced to match Thailand’s general population, 20+ years old. Consumers say their spending on take out, delivery, and ready meals could continue to grow at a similar pace during and post- COVID-19
- 4. McKinsey & Company 4 Consumers are shopping more often but only spending more online or in convenience stores; wet markets are impacted most severely. 1. Percent of responses from consumers who visited each channel before COVID-19. 2. Q: Among the below grocery shopping channels, which ones do you visit more/less frequently during the COVID-19 outbreak compared to before? 3. Net behavior/intent is calculated by subtracting the percent of respondents stating they do/expect to decrease frequency/spend from the % of respondents stating they do/expect to increase frequency/spend. 4. Q: Within the below store types, which ones do you think you will visit more/less frequently after the COVID-19 outbreak stabilize? 5. Q: Which store types have you increase your spending per month during the COVID-19 outbreak compared to before? (Percentage of consumers who have used each channel). 6. Q: Which store types have you decrease your spending per month during the COVID-19 outbreak compared to before? (Percentage of consumers who have used each channel, excl. those who increased their spend at a particular channel). 7. Q: Which store types do you expect your spending per month to increase after the COVID-19 outbreak stabilizes? (Percentage of consumers who have used each channel). Source: McKinsey & Company COVID-19 mobile survey, 3/21-3/25/2020, N = 633. Sampled and balanced to match Thailand’s general population, 20+ years old. Change in grocery purchase frequency,1 % of respondents Decrease Stay the same Increase During vs. prior,2 Net reported behavior3 After vs. during,4 Net intent3 Change in grocery spending, % of shoppers per channel During vs. prior,56 Net reported behavior3 -1% +1% -4% +31% -18% +29% -3% After COVID-197 % of respondents to increase spending post COVID-19 +39% +24% +30% +50% +38% +45% +33% Decrease Stay the same Increase Hypermarket National chain supermarket Local supermarket Cash & Carry Convenience store Wet market Online +12% +10% +7% +49% -1% +28% +39% +14% +5% +8% +40% +10% +25% +6%
- 5. McKinsey & Company 5 Hygiene practices and communication are currently the major drivers of customer experience. Most important factors impacting consumers’ current in-store experience,1 % of respondents selecting factor as top three 57 56 41 33 29 23 20 19 13 8 Availability of assistance from store staff Product availability Store staff demonstrating cleanliness practices Promotions Proactive communication of store cleaning procedures/policies Availability of hygienic services for in-store use for customers Transparent communication of changes in what the store provides Able to shop without interacting with staff Product prices for branded products Availability of private brands 1. Q: What are the top-3 most important factors that will influence the shopping experience when you do fresh food shopping in during the COVID-19 period? Source: McKinsey & Company COVID-19 mobile survey, 3/21-3/25/2020, N = 633. Sampled and balanced to match Thailand’s general population, 20+ years old. Cleanliness attributes
- 6. McKinsey & Company 6 Cleanliness and hygiene practices remain important for store selection in the next few weeks. 65 49 34 33 22 21 20 17 14 13 12 I can order online before going to store and pick up or get delivered Crowd levels /number of people in store Robustness of cleanliness /hygiene practices in store Ability to shop and pay without interacting with staff Store location (close to home or work) Stable availability of fresh food products Stable availability of packaged/ frozen food and other non- fresh products Competitive prices on branded products Store is open early in the morning Stable availability of home brands Store is open until late at night Most important factors in choosing a grocer to go to in the next four weeks,1 % of respondents selecting factor as top three 1. Q: What are the top 3 most important factors that will influence which physical store you do grocery shopping in during the next 4 weeks? Source: McKinsey & Company COVID-19 mobile survey, 3/21-3/25/2020, N = 633. Sampled and balanced to match Thailand’s general population, 20+ years old.
- 7. McKinsey & Company 7 Almost half of shoppers have tried or switched to new stores, out of which about 10 percent intend to not switch back. 39% of consumers are visiting both their regular/ primary store and other stores 6% of consumers have switched to a different store 52 48 40 26 26 23 19 14 13 13 Primary/regular store did not have good quality of fresh products during outbreak Changed to a store that offers better delivery service Changed to a store closer to work Primary/ regular store does not offer competitive prices on national brand products (excluding fresh products) Changed to a store closer to home Changed to an online store/mobile app-based store Primary/ regular store is out of stock of a lot of items during the COVID-19 outbreak Primary/ regular store feels not to be safe/infection free Changed to a store that offers better curbside or in-store pick up service Primary/ regular store stocked out on their private brands during the outbreak Reason for trying or switching to a different store1 Post-COVID- 19 situation2 92% of consumers who switched stores are expected to switch back to their primary store 1. Q: Why have you switched from your regular/primary store for your grocery store? (Percent of responses from those that have switched to/ visited the other stores) 2. Q: Do you plan to go back to shopping at your regular/primary store after the COVID-19 outbreak? (Percent of responses from those that have switched to/ visited the other stores) Source: McKinsey & Company COVID-19 mobile survey, 3/21-3/25/2020, N = 633. Sampled and balanced to match Thailand’s general population, 20+ years old. 55% of consumers are still visiting their regular/ primary store for grocery needs
- 8. McKinsey & Company 8 For some categories, up to 60 percent of consumers are spending more during COVID-19, with a stronger decline expected for alcohol. Consumption during COVID-19 situation vs. before12 Anticipated consumption after COVID-19 situation vs. during23 33 27 34 29 24 26 23 24 16 17 17 15 15 17 17 11 11 8 32 34 27 30 35 33 36 28 32 30 28 30 26 23 19 20 13 13 28 27 30 32 28 32 29 39 38 33 33 35 38 42 49 46 36 39 5 8 7 5 8 5 8 6 9 14 15 11 13 11 10 15 23 23 3 3 2 3 4 4 4 3 5 7 7 9 8 8 5 7 17 18 Personal care Packaged food Baby Household paper goods Household care5 Eggs Fresh foods Health care Bottled water Dairy Frozen foods Deli meats Food prepared in store Snacks Beverages Pet care Non-beer alcoholic beverages Beer Significantly increased (+20% or more) No change in spending (more or less 5% difference) Somewhat increased (+5 to +20% more) Significantly decreased (-20% or less) Somewhat decreased (-5 to -20%) 17 15 17 15 11 13 14 13 9 10 9 10 9 10 7 8 7 5 24 25 24 27 24 24 30 25 25 20 22 21 20 20 15 16 13 14 44 43 47 43 44 48 44 50 52 48 50 47 53 55 65 61 55 55 13 13 9 13 17 13 10 11 11 17 15 19 15 14 9 12 18 18 4 2 2 4 3 3 3 5 4 3 3 2 4 3 7 7 1 2 1. Q: How did you or your family’s spending per month change during the COVID-19 outbreak compared to before the COVID-19 outbreak? 2. Percent of responses from consumers who buy each item before, during and after the COVID-19 outbreak. 3. Q: How would you expect you or your family’s spending per month to change after the COVID-19 outbreak compared to now (during the COVID-19 outbreak)? 4. Net inflow is calculated by subtracting the percent of respondents stating they stop buying the item they have bought before during the outbreak from the % of respondents stating they only start purchasing the item during the outbreak. 5. Cleaning & detergent. Source: McKinsey & Company COVID-19 mobile survey, 3/21-3/25/2020, N = 633. Sampled and balanced to match Thailand’s general population, 20+ years old. 0% Net inflow, % of respondents4 -1% -2% 0% 0% -1% -1% 0% 0% -2% -2% -2% -1% -2% -2% -3% -4% -4%
- 9. McKinsey & Company 9 About 70 percent of consumers have tried alternate brands, driven mostly by availability; only 5 percent intend to not switch back. 32% of consumers have not tried new/alternate product brands1 68% of consumers have tried new/alternate product brands1 67 35 34 31 28 New/alternate options are easier to consume during the COVID-19 outbreak New/alternate options offer better value (are cheaper) Brands that I usually purchase were not available New/alternate options were under promotions/ display New/alternate options are safer Primary driver for switching to a new brand/product during COVID-19,2 % respondents who have tried new/alternate product brands Post-COVID- 19 situation3 95% of consumers who switched brands expect to switch back to the brands they usually purchased before 1. Q: Have you tried new/ alternate product brands during the current COVID-19 outbreak that you do not usually purchase? 2. Q: why did you switch from the brands you usually purchase to new/ alternate options? Select all that apply (N = 429, Percent of responses from consumers who have tried new new/alternate product brands). 3. Q: After the COVID-19 outbreak, do you in general plan to switch back to the product brands you usually purchased before? (N = 429, Percent of responses from consumers who have tried new new/alternate product brands). Source: McKinsey & Company COVID-19 mobile survey, 3/21-3/25/2020, N = 633. Sampled and balanced to match Thailand’s general population, 20+ years old.