Risk factor analysis influenza
•
1 gefällt mir•602 views

Risk factor analysis for fatal outcome in ICU admitted cases with confirmed influenza infection
Empfohlen

Empfohlen
Weitere ähnliche Inhalte
Was ist angesagt?
Was ist angesagt? (20)
Ähnlich wie Risk factor analysis influenza
Ähnlich wie Risk factor analysis influenza (20)
Mehr von Cornelia Adlhoch
Mehr von Cornelia Adlhoch (20)
Kürzlich hochgeladen
Kürzlich hochgeladen (20)
Risk factor analysis influenza
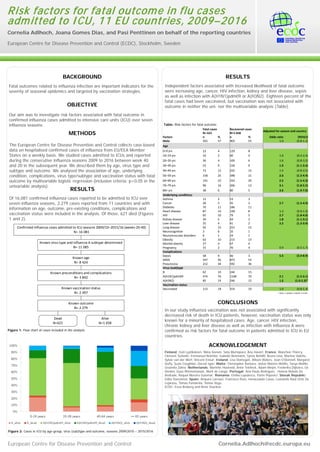
- 1. European Centre for Disease Prevention and Control BACKGROUND OBJECTIVE RESULTS CONCLUSIONS ACKNOWLEDGEMENT European Centre for Disease Prevention and Control (ECDC), Stockholm, Sweden Cornelia Adlhoch, Joana Gomes Dias, and Pasi Penttinen on behalf of the reporting countries Risk factors for fatal outcome in flu cases admitted to ICU, 11 EU countries, 2009–2016 Cornelia.Adlhoch@ecdc.europa.eu Fatal outcomes related to influenza infection are important indicators for the severity of seasonal epidemics and targeted by vaccination strategies. Of 16,081 confirmed influenza cases reported to be admitted to ICU over seven influenza seasons, 2,279 cases reported from 11 countries and with information on age, outcome, pre-existing conditions, complications and vaccination status were included in the analysis. Of those, 621 died (Figures 1 and 2). Our aim was to investigate risk factors associated with fatal outcome in confirmed influenza cases admitted to intensive care units (ICU) over seven influenza seasons. In our study influenza vaccination was not associated with significantly decreased risk of death in ICU patients, however, vaccination status was only known for a minority of hospitalized cases. Age, cancer, HIV infection, chronic kidney and liver disease as well as infection with influenza A were confirmed as risk factors for fatal outcome in patients admitted to ICU in EU countries. Finland: Outi Lyytikäinen, Niina Ikonen, Satu Murtopuro, Anu Haveri; France: Blanchon Thierry, Clement Turbelin, Emmanuel Belchior, Isabelle Bonmarin, Sylvie Behillil, Bruno Lina, Martine Valette, Sylvie van der Werf, Vincent Enouf; Ireland: Lisa Domegan, Allison Waters, Joan O’Donnell, Margaret Duffy, Suzie Coughlan, Derval Igoe; Malta: Christopher Barbara, Jackie Maistre Melillo, Tanya Melillo, Graziella Zahra; Netherlands: Mariette Hooiveld, Anne Teirlinck, Adam Meijer, Frederika Dijkstra, Gé Donker, Guus Rimmelzwaan, Marit de Lange; Portugal: Ana Paula Rodrigues , Helena Rebelo De Andrade, Raquel Moreira Guiomar; Romania: Emilia Lupulescu, Florin Popovici; Slovak Republic: Edita Staronová; Spain: Amparo Larrauri, Francisco Pozo, Inmaculada Casas, Leonardo Raul Ortiz De Lejarazu, Tomas Pumarola, Tomas Vega. ECDC: Eeva Broberg and René Snacken METHODS The European Centre for Disease Prevention and Control collects case-based data on hospitalised confirmed cases of influenza from EU/EEA Member States on a weekly basis. We studied cases admitted to ICUs and reported during the consecutive influenza seasons 2009 to 2016 between week 40 and 20 in the subsequent year. We described them by age, virus type and subtype and outcome. We analysed the association of age, underlying condition, complications, virus type/subtype and vaccination status with fatal outcome by multivariable logistic regression (inclusion criteria: p<0.05 in the univariable analysis). RESULTS Independent factors associated with increased likelihood of fatal outcome were increasing age, cancer, HIV infection, kidney and liver disease, sepsis as well as infection with A(H1N1)pdm09 or A(H3N2). Eighteen percent of the fatal cases had been vaccinated, but vaccination was not associated with outcome in neither the uni- nor the multivariable analysis (Table). Fatal cases N= 621 Recovered cases N=1 658 Adjusted for season and country Factors n % n % Odds ratio (95%CI) Male 355 57 903 55 1.0 (0.8-1.2) Age 0–9 yrs 23 4 129 8 10–19 yrs 10 2 60 4 1.0 (0.4-2.4) 20–29 yrs 26 4 100 6 1.6 (0.8-3.2) 30–39 yrs 53 9 156 9 1.9 (1.1-3.4) 40–49 yrs 73 12 255 15 1.4 (0.8-2.5) 50–59 yrs 158 25 348 21 2.6 (1.5-4.4) 60–69 yrs 141 23 324 20 2.5 (1.5-4.3) 70–79 yrs 99 16 206 12 3.1 (1.8-5.5) 80+ yrs 38 6 80 5 3.6 (1.9-7.0) Underlying conditions Asthma 12 2 53 3 Cancer 28 5 35 2 2.7 (1.5-4.9) Diabetes 70 11 186 11 Heart disease 87 14 128 8 1.3 (0.9-1.9) HIV 65 10 79 5 2.7 (1.8-4.0) Kidney disease 30 5 44 3 1.8 (1.1-3.1) Liver disease 25 4 41 2 2.2 (1.2-3.9) Lung disease 92 15 251 15 Neurocognitive 3 0 10 1 Neuromuscular disorders 6 1 24 1 Obesity 63 10 215 13 Morbid obesity 27 4 67 4 Pregnancy 15 2 70 4 0.9 (0.5-1.7) Complications Sepsis 58 9 46 3 5.5 (3.4-8.9) ARDS 347 56 873 53 Pneumonia 212 34 592 36 Virus (sub)type B 62 10 244 15 A(H1N1)pdm09 474 76 1168 70 2.1 (1.5-3.1) A(H3N2) 85 14 246 15 1.5 (1.0-2.3)* Vaccination status Vaccinated 113 18 314 19 1.0 (0.8-1.4) Table: Risk factors for fatal outcome Figure 2: Cases in ICU by age-group, virus (sub)type and outcome, seasons 2009/2010 – 2015/2016 Figure 1: Flow chart of cases included in the analysis Confirmed influenza cases admitted to ICU seasons 2009/10–2015/16 (weeks 20-40) N= 16 081 Known age N= 8 424 Known preconditions and complications N= 3 842 Known vaccination status N= 2 497 Known outcome N= 2 279 Known virus type and influenza A subtype determined N= 11 085 Dead N=621 Alive N=1 658 * 95%CI: 1.002065–2.296429 P=0.049