Indian Roots - American Soil: CII Survey 2013
•
1 gefällt mir•1,040 views

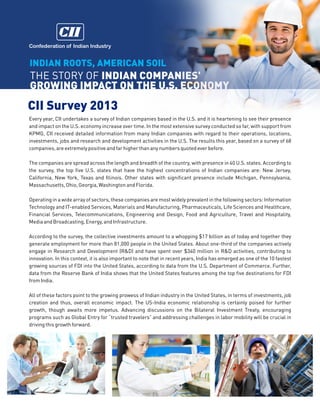
Every year, CII undertakes a survey of Indian companies based in the U.S. and it is heartening to see their presence and impact on the U.S. economy increase over time. In the most extensive survey conducted so far, with support from KPMG, CII received detailed information from many Indian companies with regard to their operations, locations, investments, jobs and research and development activities in the U.S. The results this year, based on a survey of 68 companies, are extremely positive and far higher than any numbers quoted ever before.

Empfohlen
Empfohlen
Weitere ähnliche Inhalte
Was ist angesagt?
Was ist angesagt? (20)
Ähnlich wie Indian Roots - American Soil: CII Survey 2013
Ähnlich wie Indian Roots - American Soil: CII Survey 2013 (20)
Mehr von Confederation of Indian Industry
Mehr von Confederation of Indian Industry (20)
Kürzlich hochgeladen
Kürzlich hochgeladen (20)
Indian Roots - American Soil: CII Survey 2013
- 1. Confederation of Indian Industry INDIAN ROOTS, AMERICAN SOIL THE STORY OF INDIAN COMPANIES' GROWING IMPACT ON THE U.S. ECONOMY CII Survey 2013 Every year, CII undertakes a survey of Indian companies based in the U.S. and it is heartening to see their presence and impact on the U.S. economy increase over time. In the most extensive survey conducted so far, with support from KPMG, CII received detailed information from many Indian companies with regard to their operations, locations, investments, jobs and research and development activities in the U.S. The results this year, based on a survey of 68 companies, are extremely positive and far higher than any numbers quoted ever before. The companies are spread across the length and breadth of the country, with presence in 40 U.S. states. According to the survey, the top five U.S. states that have the highest concentrations of Indian companies are: New Jersey, California, New York, Texas and Illinois. Other states with significant presence include Michigan, Pennsylvania, Massachusetts, Ohio, Georgia, Washington and Florida. Operating in a wide array of sectors, these companies are most widely prevalent in the following sectors: Information Technology and IT-enabled Services, Materials and Manufacturing, Pharmaceuticals, Life Sciences and Healthcare, Financial Services, Telecommunications, Engineering and Design, Food and Agriculture, Travel and Hospitality, Media and Broadcasting, Energy, and Infrastructure. According to the survey, the collective investments amount to a whopping $17 billion as of today and together they generate employment for more than 81,000 people in the United States. About one-third of the companies actively engage in Research and Development (R&D) and have spent over $340 million in R&D activities, contributing to innovation. In this context, it is also important to note that in recent years, India has emerged as one of the 10 fastest growing sources of FDI into the United States, according to data from the U.S. Department of Commerce. Further, data from the Reserve Bank of India shows that the United States features among the top five destinations for FDI from India. All of these factors point to the growing prowess of Indian industry in the United States, in terms of investments, job creation and thus, overall economic impact. The US-India economic relationship is certainly poised for further growth, though awaits more impetus. Advancing discussions on the Bilateral Investment Treaty, encouraging programs such as Global Entry for trusted travelers and addressing challenges in labor mobility will be crucial in driving this growth forward.
- 2. PRESENCE OF INDIAN COMPANIES ACROSS THE UNITED STATES New Hampshire Washington Montana North Dakota Michigan Indiana Minnesota Oregon Idaho Pennsylvania Iowa California Colorado Kansas New Jersey Ohio Illinois Utah Massachusetts Rhode Island Connecticut New York Wyoming Nevada Maine Wisconsin South Dakota Nebraska Vermont Missouri Kentucky Delaware Maryland West VA Virginia District of Columbia North Carolina Tennessee Arizona Oklahoma New Mexico Arkansas South Carolina Alabama Georgia Texas Map Legend Louisiana Florida Mississippi Alaska 15 or More Companies 6-14 Companies 1-5 Companies No Presence Hawaii PRESENCE OF INDIAN COMPANIES ACROSS INDUSTRIES 4% 2% 2% 4% 30% 4% Information Technology, IT Enabled Services & BPO Materials, Mining & Manufacturing Pharmaceuticals, Life Science & Healthcare 4% Diversified & Other Financial Services 5% Telecommunications Engineering & Design 7% Food & Agriculture Travel & Hospitality Media & Broadcasting 9% 18% 11% Confederation of Indian Industry Energy Infrastructure www.cii.in