1. Assessment of Cost Trends and Price Differences for U. S. Hospitals
March 2011
Margaret E. Guerin-Calvert
Vice Chairman and Senior Managing Director
Guillermo Israilevich
Vice President
Compass Lexecon
1101 K Street NW, 8th Floor
Washington, DC 20005
Phone: 202.589.3450
2. Assessment of Cost Trends and Price Differences for U.S. Hospitals1
“In a market with differentiated products [such as a hospital market], different price levels are
neither necessary, nor sufficient, to demonstrate the exercise of market power.”
– Federal Trade Commission Working Paper No. 2942
Executive Summary
This paper is the second in a series examining issues that have a bearing on the development of
new and innovative healthcare delivery arrangements, such as Accountable Care Organizations
(“ACOs”), medical homes and other arrangements that require greater clinical and/or financial
integration among caregivers (hospitals and physicians).
The first paper, “A Critique of Recent Publications on Provider Market Power” (“Critique”),
examined claims made in two publications widely cited as support for limiting caregivers’
flexibility to develop or expand innovative delivery arrangements with exaggerated claims of
provider market power. These publications focused on differences in prices among hospitals in
two states, linking higher hospital prices to insurers directly to market power. Both ignored or
rejected other explanations for price differences, such as differences in the prevalence of disease
or illness and numerous other tangible factors. The Critique concluded after rigorous analysis that
neither publication lends any credible support for such claims.
This second paper, “Assessment of Cost Trends and Price Differences for U.S. Hospitals” (“Cost
Trends”), provides an in-depth examination of the costs hospitals incur in providing patient care
and why those costs may differ among various types of hospitals, as well as the relationship of
costs to prices. The key findings demonstrate that hospital prices are directly related to the costs of
providing services to patients and their communities, including wages, capital investment, and the
level and specialization of services. Thus, Cost Trends should dispel un- or poorly-supported
claims that differences in hospital prices are attributable automatically to market power. Perhaps
more importantly, the research demonstrates a link between improving care coordination, cost
reduction and, lower prices.
A brief summary follows.
1
3. HOSPITAL COSTS – NATIONAL TRENDS
From 2000 through 2009, hospital revenues closely tracked cost increases, meaning that hospital
margins did not increase appreciably. Both revenues and expenses per adjusted admission
increased by roughly 5% per year.
Viewed in the larger context
of
national
healthcare
expenditures, hospital care
accounted for a steady
proportion
of
national
healthcare expenditures over
the past decade of slightly
more than 30% and is
expected to maintain that
level over the next decade.
Not surprisingly, labor costs
accounted for more than half
of hospitals’ total expenses.
Labor costs grew by between
5 to 8% a year from 2002 to
2009.
An increasingly significant
issue for hospitals is the
growth in the patients
covered by the federal
Medicare program or a state
Medicaid program; these
patients now constitute more
than 60% of all admissions.
Neither program pays the full
cost of care. Medicare paid
99.1% of costs in 2000, but
by 2009 paid only 90.1%;
Medicaid paid 94.5% in
2000, but by 2009 paid only
89.0%. Likewise, uncompensated care – free or reduced cost care for patients who need financial
assistance or shortfalls from patients unable to pay for care – amounts to 6% of total hospital
expenses. Some of these costs of providing under- or uncompensated care are reflected in the
hospital costs absorbed by other payors.
PRICE DIFFERENCES – AN ANALYSIS
Extensive analyses of hospital costs derived from five years of data from thousands of hospitals
across the country and extensive data on costs, level and type of care, and community-specific
information demonstrate that hospital revenues and costs track each other closely, and that there
2
4. are numerous, identifiable sources of costs that explain prices and price differences. These
analyses confirm that unsupported claims of market power cannot be used to explain price
differences among hospitals.
The key findings are as follows:
Hospital prices are directly related to an array of costs associated with labor and capital costs,
and the level and type of care received by the patients treated by the hospital.
Up to 72% of the differences across hospitals in non-Medicare prices can be explained by
factors that include case mix, regional costs, hospital investments in capital and other
improvements, type of hospital, and other tangible factors. These factors also explain up to
83% of differences across hospitals in all-payor prices (which include Medicare), further
validating the importance of cost and services as the sources of price differences.
A variety of factors likely account for the remaining differences, chief among which are the
costs associated with providing higher quality care. These factors also include costs imposed
by different state regulations, different cost-containment strategies employed by hospitals, and
errors or inconsistencies in the data. There is no reason to believe that the remaining
differences are due to market power. This conclusion is entirely consistent with a Working
Paper by the Federal Trade Commission’s Bureau of Economics concluding that in hospital
markets different price levels are neither necessary nor sufficient to demonstrate the exercise
of market power.3
3
5. INTRODUCTION AND SUMMARY
This paper is the second in a series of empirical studies examining healthcare cost trends and
prices, and the factors that explain hospital prices, as well as differences in prices across hospitals.
HOSPITAL COST TRENDS
National healthcare expenditures are comprised of a wide array of categories, including hospital
and physician services, home healthcare, and pharmaceuticals. Hospital care accounted for a
steady proportion of aggregate national healthcare expenditures over the past decade –
approximately 30% – and is expected to do the same over the next decade. The sectors in which
expenditures are growing most rapidly include home healthcare, prescription drugs, and program
administration and net cost of private health insurance.
Trends in hospital revenues and costs over the past decade show that labor costs, which include
salaries and benefits for physicians, nurses, technicians, and numerous other personnel, account
for a large proportion of overall hospital costs, as well as total cost increases over the past decade.
Non-labor costs also have increased, and include pharmaceuticals, professional fees, and
maintenance of and additions to plant and capital, including technology.
There has been a flattening of inpatient admissions and a continued increase in outpatient visits.
The composition of inpatient admissions has changed, with Medicare and Medicaid admissions
increasing to about 60% of total admissions. Reimbursement from Medicare and Medicaid does
not fully cover the costs of caring for those patients. In addition, uncompensated care, which refers
to free or reduced cost care for those in financial need or care for which no payment was received,
averages about 6% of hospital expenses. While the shortfalls from caring for patients without
sufficient compensation to cover costs require hospitals to absorb and address some of those costs,
some must be offset by other sources of revenue, including private payors, in order for the hospital
to remain viable.4
Evaluating cost and revenue trends, per “adjusted admission”5 from 2000 through 2009, shows
that, at the national level, hospital revenues closely tracked cost increases, each increasing by
roughly 5% per year. These trends and their resulting margins show that revenues are closely
tracking costs, and that costs are key factors driving hospital price increases.
Hospital cost trend analyses also show that prices vary across regions depending on underlying
cost differences among regions, such as differences in labor costs. For example, higher labor costs
in a region result in higher expenses and, consequently, higher revenues per adjusted admission.
Similarly, costs vary among hospitals within or across regions depending on patients’ severity of
illness, mix of government and commercial payors, and range of services offered and hospitalspecific factors such as higher staffing ratios or the use of more expensive technologies. Thus,
differences in prices can be explained by underlying differences in the costs of providing care at
specific hospitals or in specific areas.
PRICE DIFFERENCES – AN ANALYSIS
These findings are confirmed by extensive empirical analysis of price differences across hospitals
and the many cost-related and other factors that may explain differences. This includes an analysis
4
6. of the extensive literature on spending and differences in hospital spending, which confirms that
many of the factors explaining differences in spending levels across regions or hospitals are
related to the costs of providing care, which, in turn, directly affect its price. For example, the
literature shows that much of the spending variation between two regions can be explained by the
differences in regional costs and in the prevalence of disease or illness.
In focusing directly on factors that explain commercial prices, we analyzed a comprehensive set of
explanatory factors and an extensive national sample of thousands of acute care hospitals for a
five-year period.6 Specifically, we developed extensive data on hospital, community, financial,
and patient characteristics.7 In doing so, this paper represents the first comprehensive study that
attempts to explain the sources of price differences at the national level for commercial insurers.
The analyses confirm that cost-based factors are important in explaining hospital prices and price
differences. While it is not possible to capture all of the factors that could affect price, such as
higher quality, those included in the econometric analyses explain up to 72% of the differences in
non-Medicare prices.8 These results are highly explanatory, and there is no reason to believe that
the remaining differences are due to the exercise of market power.
The key finding of these analyses is that hospital prices are directly related to an array of cost
factors associated with regional costs, labor costs, capital investments, and level and specialty of
services. The fact that prices closely track costs suggests that efforts to improve the efficiency with
which care is delivered, and to coordinate and improve the quality of care, should reap benefits in
the form of both lower costs and lower prices.
5
7. ASSESSMENT OF COST DRIVERS AND TRENDS IN
HEALTHCARE AND THE HOSPITAL SECTOR
Hospital care accounts for a steady proportion of national expenditures on healthcare,
approximately 30%, and is projected to remain at this proportion for the next decade. Over the past
decade, increased expenditures on labor explain a substantial proportion of overall cost increases
experienced by hospitals. In addition, hospitals are facing a growing need to cover shortfalls from
insufficient Medicare and Medicaid reimbursement, uncompensated and charity care, and new
compliance-related costs for new technologies such as electronic health records. Moreover,
reimbursement shortfalls have increased in significance with the increasing proportion of inpatient
admissions from Medicare and Medicaid. Overall, hospital revenues have closely tracked cost
increases at the national and regional level. This indicates that, on average, hospital margins have
not increased substantially.
SPENDING ON HOSPITAL CARE IN THE CONTEXT OF OVERALL HEALTHCARE
EXPENDITURES
A useful starting point for evaluating cost trends for hospitals is to put them in the context of
broader healthcare costs and trends. Hospital services are one aspect of healthcare expenditures.9
As the following table shows, there are many different expenditure categories accounting for total
national healthcare costs.10 As of 2009, healthcare expenditures accounted for 17.6% of the Gross
Domestic Product (GDP). Of a total of $2,486 billion in expenditures on healthcare at the national
level in 2009, hospital care accounts for $759 billion, or 30.5%. Other major categories include
professional services, including physician and clinical services (27.1%), prescription drugs and
other medical products (13.2%), nursing home and home health (8.3%), and investment (6.3%).
6
8. National Health Expenditures, 2009
Spending Category
2009
%
National Health Expenditures (billions)
$2,486.3
Health Consumption Expenditures
2330.1
Personal Health Care
2089.9
Hospital Care
759.1
Professional Services
674.9
Physician and Clinical Services
505.9
Other Professional Services
66.8
Dental Services
102.2
Other Health, Residential, and Personal Care
122.6
Nursing Home and Home Health
205.3
Home Health Care
68.3
Nursing Home Care
137
Retail Outlet Sales of Medical Products
328
Prescription Drugs
249.9
Other Medical Products
78.2
Durable Medical Equipment
34.9
Other Non-Durable Medical Products
43.3
Program Administration and Net Cost of Private Health Insurance
163
Government Public Health Activities
77.2
Investment
156.2
Research
45.3
Structures & Equipment
110.9
U.S. Population (millions)
307
National Health Expenditures Per Capita
$8,098.7
Gross Domestic Product (billions)
$14,119.0
National Health Expenditures as a Percent of Gross Domestic Product
17.6%
Sources: CMS, Office of the Actuary, National Health Statistics Group; and U.S. Department of
Commerce, Bureau of Economic Analysis and Bureau of the Census.
of NHE
93.7%
84.1%
30.5%
27.1%
20.3%
2.7%
4.1%
4.9%
8.3%
2.7%
5.5%
13.2%
10.1%
3.1%
1.4%
1.7%
6.6%
3.1%
6.3%
1.8%
4.5%
Hospital expenditures held relatively steady as a proportion of total healthcare expenditures from
2001 to 2009 (approximately 30% of total healthcare expenditures).11 The largest percentage
change in expenditure was for Home Health Care, which represents about 3% of total
expenditures. Other categories have grown faster than hospital care; these include prescription
drugs, and program administration and the net cost of private health insurance.
7
9. National Health Expenditures, 2001 and 2009
Spending Category
2001
National Health Expenditures (billions)
$ 1,495.3
Health Services and Supplies
1401.4
Personal Health Care
1264.1
Hospital Care
449.4
Professional Services
422.9
Physician and Clinical Services
314.7
Other Professional Services
40.6
Dental Services
67.5
Other Health, Residential and Pers. Care
70.7
Nursing Home and Home Health
125.2
Home Health Care
34.4
Nursing Home Care
90.8
Retail Outlet Sales of Medical Products
196
Prescription Drugs
138.7
Other Medical Products
57.4
Durable Medical Equipment
25.1
Other Non-Durable Medical Products
32.3
Program Administration and Net Cost of
Private Health Insurance
89.8
Government Public Health Activities
47.5
Investment
94
Research
28.5
Structures & Equipment
65.5
2001
Share of
NHE
100.0%
93.7%
84.5%
30.1%
28.3%
21.0%
2.7%
4.5%
4.7%
8.4%
2.3%
6.1%
13.1%
9.3%
3.8%
1.7%
2.2%
2009
$ 2,486.3
2330.1
2089.9
759.1
674.9
505.9
66.8
102.2
122.6
205.3
68.3
137
328
249.9
78.2
34.9
43.3
6.0%
3.2%
6.3%
1.9%
4.4%
2009
Share of
NHE
100.0%
93.7%
84.1%
30.5%
27.1%
20.3%
2.7%
4.1%
4.9%
8.3%
2.7%
5.5%
13.2%
10.1%
3.1%
1.4%
1.7%
163
77.2
156.2
45.3
110.9
6.6%
3.1%
6.3%
1.8%
4.5%
2001-2009 2001-2009 % of 2001Percent
Dollar
2009 Dollar
Change
Change
Change
66.3% $
991.0
100.0%
66.3%
928.7
93.7%
65.3%
825.8
83.3%
68.9%
309.7
31.3%
59.6%
252
25.4%
60.8%
191.2
19.3%
64.5%
26.2
2.6%
51.4%
34.7
3.5%
73.4%
51.9
5.2%
64.0%
80.1
8.1%
98.5%
33.9
3.4%
50.9%
46.2
4.7%
67.3%
132
13.3%
80.2%
111.2
11.2%
36.2%
20.8
2.1%
39.0%
9.8
1.0%
34.1%
11
1.1%
81.5%
62.5%
66.2%
58.9%
69.3%
73.2
29.7
62.2
16.8
45.4
7.4%
3.0%
6.3%
1.7%
4.6%
Source: CMS, Office of the Actuary, National Health Statistics Group.
Total National Health Expenditure by Component, 2001 and 2008
7.9%
2001
8.0%
6.3%
2009
6.3%
30.1%
6.0%
30.5%
6.6%
13.1%
13.2%
4.7%
28.3%
Total Expenditure:
$1,469.2 billion
8.3%
27.1%
Total Expenditure:
$2,338.7 billion
Sources: CMS, Office of the Actuary, National Health Statistics Group.
Healthcare expenditures have increased over the past decade, and are projected to increase
between 2009 and 2019 by approximately 80%.12 The projections from CMS for future
expenditure increases are consistent with recent experience. They show that all major categories
are expected to increase at similar rates over this period.13 In particular, expenditures for hospital
8
10. care are projected to account for 30.7% of the increase, which is similar to its current share of total
expenditures.14 The following chart shows the historic and projected increases in total national
health expenditures along with the breakdown among the top seven categories.
National Health Expenditures by Component ($ Billions)
$5,000
Investment
$4,500
Government Public Health Activities
Program Administration and Net Cost of Private Health Insurance
$4,000
Retail Outlet Sales of Medical Products
Nursing Home and Home Health
$3,500
Professional Services
Hospital Care
$3,000
$2,500
$2,000
$1,500
$1,000
$500
$0
2019*
2018*
2017*
2016*
2015*
2014*
2013*
2012*
2011*
2010*
2008
2009*
2007
2006
2005
2004
2003
2002
2001
2000
1999
1998
1997
1993
1990
Note: Years 2009 and on (*) are projected by CMS.
Source: CMS, Office of the Actuary, National Health Statistics Group.
COST TRENDS WITHIN THE HOSPITAL SECTOR
We next examine the factors that account for cost changes within the hospital sector, and focus on
cost and utilization. In particular, we examine both changes in underlying input costs and/or the
demand for services as possible sources of increased total spending. This updates analyses
conducted by Guerin-Calvert et al., 2003.
The chart below tracks total hospital expenses and the breakdown between labor and non-labor
expenses between 2002 and 2009. Labor expenses account for over half of total expenses. Both
labor and non-labor expenses grew around 50% over the period, with annual growth rates between
5% and 8%. Non-labor costs include a wide variety of different expenses, with the largest
categories involving other products (such as food and medical instruments), prescription drugs,
and professional fees.15
9
11. Total Hospital Expenses and Labor Expenses ($ Billions): National, 2002-2009
$700
Non-Labor Expenses
Labor Expenses
$600
$500
$400
$300
$200
$100
$0
2002
2003
2004
2005
2006
2007
2008
2009
Source: Analysis of AHA Annual Survey data for community hospitals.
Hospitals in all regions across the country have faced increased costs. One notable cause is the
emergence and widespread diffusion of new medical technologies.16 A specific area of cost
increase relates to electronic health record (“EHR”) systems. These systems require upfront costs
to initiate and ongoing costs in re-training staff and evaluating and updating the system once
implemented. However, by assisting in the coordination of care between providers, aiding clinical
decision-making, and more accurately monitoring performance, research suggests that EHR
systems have the potential to both lower costs and improve quality.17
Under the American Recovery and Reinvestment Act of 2009 (“ARRA”), hospitals that have
implemented health information technology (“IT”) systems meeting “meaningful use” criteria will
be eligible for incentive payments from Medicare and Medicaid. The ARRA also includes
penalties for failing to meet these requirements by 2015. The timelines will put pressure on
hospitals to select, test, and implement the best EHR system for their needs within tight
timeframes.18 Recent surveys of hospitals show access to capital (tax-exempt bonds, in particular)
to be a significant challenge, and many hospitals have put information technology purchases on
hold as a result.19 Preliminary evidence suggests that implementation of EHR systems may be
occurring at a more rapid pace for hospitals belonging to healthcare systems, which may be
explained by access to capital, purchasing efficiencies, and broad opportunities to share
information.20
10
12. GENERAL TRENDS THAT AFFECT HOSPITALS’ OPERATIONS AND COSTS
Consistent with national population trends, total hospital admissions grew by 7% between 2000
and 2009. Since 2004, however, hospital admissions have remained virtually flat, in part due to a
shift of some services to outpatient venues. Medicare and Medicaid admissions account for an
increasing share of total admissions. In particular, Medicaid admissions have grown at a rapid
pace – 36% between 2000 and 2009.
Hospital Admission Trends, 2000-2009
Year
2000
2001
2002
2003
2004
2005
2006
2007
2008
2009
Total
Admissions
33,089,467
33,813,589
34,478,280
34,782,742
35,086,061
35,238,673
35,377,659
35,345,986
35,760,750
35,527,377
Medicare
Admissions
13,567,553
13,884,333
14,197,195
14,163,774
14,498,549
14,769,486
14,716,159
14,689,388
14,912,904
14,964,804
Medicare
Admissions as
% of Total
41.0%
41.1%
41.2%
40.7%
41.3%
41.9%
41.6%
41.6%
41.7%
42.1%
Medicaid
Admissions
5,210,907
5,462,091
5,903,648
6,121,649
6,321,973
6,475,521
6,590,939
6,693,701
6,870,817
7,074,220
Medicaid
Admissions as
% of Total
15.7%
16.2%
17.1%
17.6%
18.0%
18.4%
18.6%
18.9%
19.2%
19.9%
Outpatient
Visits
521,404,976
538,480,378
556,404,212
563,186,046
571,569,334
584,428,736
599,553,025
603,300,374
624,098,296
641,953,442
Source: Analysis of AHA Annual Survey data for community hospitals.
Payment shortfalls from Medicare, Medicaid, and uncompensated care add increasing pressure on
hospital finances. Medicare and Medicaid admissions now account for more than 60% of total
admissions. The AHA estimates that Medicare payment-to-cost ratios fell from 99.1% in 2000 to
90.1% in 2009.21 Similarly, Medicaid payment-to-cost ratios fell from 94.5% in 2000 to 89.0% in
2009. Moreover, AHA data show that uncompensated care costs represent approximately 6% of
total hospital expenses.22
Trends in the number of outpatient visits for all U.S. hospitals continued to show increases. While
not as pronounced as in the 1990s, outpatient visits continue to grow, increasing more than 23%
between 2000 and 2009.
11
13. Number of Outpatient Visits, 1990-2009
700,000,000
600,000,000
500,000,000
400,000,000
300,000,000
200,000,000
100,000,000
0
1990 1991 1992 1993 1994 1995 1996 1997 1998 1999 2000 2001 2002 2003 2004 2005 2006 2007 2008 2009
Source: Analysis of AHA Annual Survey data for community hospitals.
In order to examine differences in hospital expenses across regions, we make use of data that
examines average expenses per adjusted admission. As shown in the figure below, while the level
of hospital expenses may vary due to regional differences in input costs such as wages, costs in all
regions followed a similar upward trend over the past decade.
12
14. Total Expenses per Adjusted Admission by Region: National, 2000-2009
$18,000
All Hospitals
East South Central
West North Central
West South Central
Mountain
$14,000
South Atlantic
East North Central
$16,000
New England
Mid Atlantic
Pacific
$12,000
$10,000
$8,000
$6,000
$4,000
$2,000
$0
2000
2001
2002
2003
2004
2005
2006
2007
2008
2009
Source: Analysis of AHA Annual Survey data for community hospitals.
Overall, hospital revenues have closely tracked cost increases, as shown in the figure below. Both
revenues and expenses grew by 51% between 2000 and 2009, which implies an average annual
growth rate of roughly 5%.
Total Revenue and Expense per Adjusted Admission, 2000-2009
$12,000
$10,000
$8,000
$6,000
$4,000
$2,000
Total Revenue per Adjusted Admission
Total Expense per Adjusted Admission
$0
2000
2001
2002
2003
2004
2005
2006
2007
2008
2009
Source: Analysis of AHA Annual Survey data for community hospitals.
13
15. EMPIRICAL EVALUATION OF FACTORS EXPLAINING PRICE
DIFFERENCES ACROSS U.S. HOSPITALS
OVERVIEW AND SUMMARY OF CONCLUSIONS
Hospital costs and revenues per adjusted admission are tracking each other closely at the national
level. These trends also suggest that differences in prices across hospitals or regions could well be
explained at least in part by differences in costs. The multitude of factors associated with higher
costs, such as salary levels, utilization of nursing and other staff, costs of delivering higher
complexity care and services, extent of payment shortfalls, and higher technology costs could be
factors that explain cost differences among hospitals within the same region, or even the same
city, and in turn may serve to explain differences in average prices per admission across hospitals.
In this section, we examine extensive data on thousands of hospitals to evaluate these factors and
whether they explain price differences, and specifically price differences for commercial insurers
across hospitals. We do so by:
Building from the extensive empirical literature on hospital spending and the factors that
contributed substantially to explain differences across regions in spending. We rely on this
literature just as a starting point, because it focuses on Medicare and not on commercial
insurers, and because it focuses on spending, which includes both price measures and the
quantity of services provided. Nonetheless, because this literature explores and tests
numerous cost-based factors that explain differences in spending, these same factors have
the potential to explain differences in prices.
Extending the preliminary model begun in the Critique23 to a range of more extensive
models using hospital, community, financial and other variables, and a national data set of
thousands of hospitals over a five-year period to test empirically the sources of price
differences.
Our goal was to develop an understanding of the myriad factors that could potentially affect
hospital prices to commercial insurers, and to identify those that are most important and relevant.24
Our key findings are:
Hospital prices are directly related to an array of cost drivers associated with labor costs,
capital investments, and the level and type of care.
While it is difficult due to data limitations and the complexity of healthcare to capture all
relevant factors in our models and explain all differences, our results show that the factors
that we can measure are statistically important and explain price differences; factors such
as case mix, regional costs, hospital characteristics, resource utilization, characteristics of
the population, and other factors explain a very large proportion – up to 72% of the
differences in hospital prices for non-Medicare services across the U.S., and a large
proportion of the variability in Medicare and all-payor prices.
Our empirical analyses provide logical explanations for higher hospital prices in some
regions or for some hospitals relative to neighboring ones in the same regions. Moreover,
the strength of the empirical results confirms that it is inappropriate to ignore these factors
in any discussion of price differences.
14
16. As in all empirical studies, some variability in the data cannot be explained by the model; a variety
of factors likely account for this remaining variability. These factors include the costs associated
with providing higher quality care, costs imposed by different state regulations, differences in the
cost-containment strategies employed by hospitals, and errors or inconsistencies in the data. As a
matter of economics, it is incorrect to assume that any residual price differences reflect some form
of inefficiency or market power.
REVIEW OF STUDIES
We started our analysis with a review of the existing literature on factors that explain differences
across hospitals. We found that the literature on price differences was very limited, but there was a
more extensive literature on spending differences. Although these studies have used different data,
models, and variable specifications, with varying results, there is a common set of factors
(variables) that tend to explain healthcare prices and/or spending:
Case mix: healthcare prices and spending are closely linked to the mix of services and
general level and type of care delivered by each provider. Researchers have typically used
Medicare’s case mix index (“CMI”) or have conducted the analysis at the DiagnosisRelated Group (“DRG”) level to capture how the service mix affects prices and spending.
Costs: these variables capture regional differences in input costs – in particular, labor costs.
In addition, hospital-specific costs, such as labor and capital expenditures, may be used to
capture the degree of complexity in hospital services not captured by case-mix variables.
Demographics: the literature shows that the overall use of healthcare services and the
prevalence of certain conditions can vary according to age, sex, race, and other
socioeconomic variables such as income level and insurance status.
Health status: in addition to demographic variables, health status variables can be used to
capture the relative sickness of the population. Researchers have used primarily behavioral
variables (e.g., share of smokers) and variables that reflect the incidence of specific
conditions (e.g., diabetes).
Provider characteristics: these variables capture certain factors that affect hospital costs
(e.g., mission-related costs of teaching hospitals, uncompensated care). Researchers have
also used variables that reflect service complexity (e.g., specialty beds, organ transplants,
and the relative supply of healthcare resources).
Payor characteristics: these variables have been used in studies that attempt to explain
healthcare outcomes through variables that identify payor mix and other payor
characteristics.
Researchers use combinations of these variables in regression models that are able to identify
which variables show statistical correlation with hospital prices and how much of the variation in
hospital prices can be explained by all the variables in combination (without double counting the
explanatory power of the variables). While no one study incorporates all these variables in a single
model, as models become more sophisticated (i.e., include a larger array of these variables), they
are able to explain more of the variability in prices and spending. We briefly summarize the key
findings from the extensive literature that focuses on differences in healthcare spending, costs, and
prices as well as quality. Appendix A contains a summary of selected studies and the explanatory
variables used in those studies.
15
17. Studies Focused on Medicare Spending
Several studies have analyzed regional differences in Medicare spending – a measure that includes
both Medicare prices (payment rates) and the quantity of services provided. Most of these studies
adjust regional spending by some measure of regional costs, for example, the indices used by
CMS to adjust payment rates for each region.25 Since these studies look at overall spending, which
is affected by utilization, the models tend to include a large number of variables that attempt to
capture demographic characteristics, such as age, sex, race, income, and urbanization, and health
status of the population, including self-reported health status, share of smokers, mortality rates,
and incidence of certain conditions. They also include variables that measure the supply of
medical resources in the region, including the percentage of primary care physicians and the
availability of teaching hospitals. In some cases, they also include payor-side measures, such as
the share of the population in managed care plans, Medicaid, and uninsured.
While there are some important differences among the results of the individual studies, the results
show that differences in Medicare spending can be explained in large part by: (i) differences in
Medicare payment rates for each region (including Medicare adjustments to specific hospitals, for
example, for teaching, rural, and disproportionate share (“DSH”) hospitals); (ii) differences in
patients’ demographic characteristics; and (iii) differences in the health status of the population.
This reflects that areas with high spending are frequently characterized by sicker populations.
Studies Focused on Non-Medicare Patients
Only a few studies have analyzed differences in non-Medicare costs or prices, largely because
more data are available for Medicare’s fee-for-service program than for non-Medicare services.
These studies use the Medicare Cost Reports to obtain data for non-Medicare inpatient services, or
use private payor data limited to a particular region.
These studies explain differences in hospital prices or costs using measures of regional costs, such
as the cost indices provided by CMS, and either adjust for case mix or analyze the data at the DRG
level. Since they analyze hospital-level data, the datasets used may not include demographic and
health status information for the population served at each hospital, which is not generally
available. Instead, they use variables that attempt to capture the level and type of hospital
complexity, such as CMI and teaching intensity, and measures of specialty care and sophisticated
clinical services, such as open-heart surgery and organ transplants. They also use as explanatory
factors such as urban/rural indicator variable, Medicare outlier payments, and the shares of
patients treated under Medicare and Medicaid.
Studies Focused on Quality of Care
We also reviewed studies that explore whether regions and hospitals with high prices or spending
are associated with higher quality of care. In contrast to other explanatory variables, the analysis
of quality is particularly limited by the absence of well-defined measures and a methodological
limitation that arises from the fact that severely ill patients disproportionately choose high-quality
hospitals. As a result, health outcomes such as mortality rates cannot be used to make inferences
regarding hospital quality without taking into account the differences in the severity of illness of
the patients treated at each hospital.
16
18. Although some researchers have developed more elaborate methodologies to overcome these
limitations, these types of studies require additional data (such as patient-level data by discharge)
and cannot readily be extended to cover the entire sample of U.S. hospitals.
However, it should be noted that these more sophisticated methods yield significantly different
results from the standard methods that use only simple measures of hospital quality. This confirms
that failure to properly adjust for severity of illness is likely to lead to substantial bias in
measuring hospital quality. Likewise, the apparent absence of correlation between price and
common measures of quality could be the result of measurement and specification issues, as
opposed to an actual lack of relationship. Appendix A summarizes key findings from the literature
that focuses on provider quality.
ECONOMETRIC EVALUATION OF PRICE DIFFERENCES ACROSS U.S. HOSPITALS
Overview
In this section, we extend the preliminary model begun in the Critique to a range of more
extensive models that identify the factors that account for differences in prices across hospitals.
This required adapting the approaches used in the literature to incorporate price measures rather
than spending measures, and to examine, where possible, commercial prices. We also expanded
the modeling from a single state to the entire country, and built a database of more than 3,400
hospitals. This required development of data on region or area-specific measures of labor costs,
demographics, and health status variables.26 A detailed listing of the data developed is provided in
Appendix B.
In developing models, we relied on commonly accepted methods to capture fundamental
relationships that explain prices. One measure routinely employed is the R-squared value, which is
a measure of how well the model explains the observed variability in the data; a higher R-squared
value implies that the model explains more of the variability in the data. Another measure is
whether the relationship between a given factor and the item under investigation – price in this
case – is statistically significant.27 Thus, we measure relevance and importance by whether the
specific economic factor shows a statistically significant relationship with hospital prices and
evaluate whether taken together these factors explain a substantial proportion of the variation in
hospital prices.
We first used the key variables from the Critique to explain differences in hospital prices, namely
case mix, teaching intensity, and share of Medicare/Medicaid discharges. Then, we enriched the
analysis by moving from these basic variables to models that examine the effects of multiple
factors, including those discussed in the previous section. We include in the model explanatory
variables that reflect regional costs, additional hospital characteristics, resource utilization,
demographic and health status variables, and inpatient costs reported by hospitals. We do this
sequentially to better understand the explanatory power of each set of factors. In total, we present
five models.
Price measures
As in the Critique, we use measures of hospital inpatient prices based on the Medicare Cost Report
data. The Medicare Cost Reports provide revenue and discharge data, by hospital, from which we
can estimate average hospital inpatient revenues (per discharge) for Medicare and non-Medicare
patients. As such, the calculated “prices” reflect average hospital inpatient revenues per discharge.
17
19. This measure reflects average inpatient prices and, to some extent, the hospital’s resource
utilization per discharge. It does not reflect, however, overall resource utilization or healthcare
spending by hospital.28
We use formulas from the healthcare literature to estimate these non-Medicare prices.29 We
calculate a hospital-level discount factor (i.e., the payment discount over charges) to estimate total
inpatient revenues, and then subtract Medicare revenues to obtain non-Medicare revenues. One
important caveat is that this methodology implicitly assumes the same discount factor for inpatient
and outpatient services.30
To our knowledge, this is the first study that attempts to explain non-Medicare price differences
across all U.S. hospitals.31 In addition, in order to test the results of this non-Medicare price
formula, we use an alternative measure of average prices for all payors that includes Medicare and
non-Medicare patients. This price measure requires fewer assumptions, as it is based on total
hospital discharges and charges (adjusted by the hospital’s discount factor). With both measures of
prices (non-Medicare and all-payor), we show that a large proportion of the price differences can
be explained by those factors identified in the healthcare literature. The data and methodology are
further described in Appendix B.
Data
We use data from federal fiscal years 2004 through 2008, as provided in the Medicare Cost
Reports. This allows us to analyze price differences across U.S. hospitals for a sample of five
years. In estimating cross-sectional variation, the econometric model first averages all variables
from each hospital over the five-year period and then performs a linear regression across these
hospital-level averages.32 We further analyze the data to exclude extreme values and apparent data
errors (see Appendix B). As a result, the final dataset contains approximately 3,400 hospitals with
information for between one and five years (on average, the data include four years per hospital).33
Regressions Models and Results
The availability of a large sample of hospitals allows using models that include a large number of
explanatory variables relative to state-level studies in which only a few explanatory variables can
be used. The table below summarizes the explanatory variables used in each model and the share
of the variability in non-Medicare prices explained by each model (the full regression results are
shown in Appendix C). The table also includes the explanatory power of the model for all-payor
prices (Medicare and non-Medicare patients).
The first model includes certain key variables that reflect case mix, teaching intensity (measured
by the number of interns and residents per bed), and the share of Medicare and Medicaid
discharges. In addition, due to the regional nature of this study, we included a measure of regional
costs – the wage index currently used by CMS to set Medicare payments.34
Results: Overall, these few variables explain approximately 48% of the variability
in non-Medicare prices. In particular, case mix and wage index are strongly
correlated with non-Medicare prices and statistically significant. The table below
also shows that, when applied to average prices for all payors, these variables
explain 67% of the price variation.35 The share of Medicare discharges tends to be
positively correlated with prices and the share of Medicaid discharges tends to be
negatively correlated with prices.36
18
20. Some researchers have raised the concern that the prices set by a hospital and the wages of its
physicians may affect the Medicare wage index (that is, high prices may contribute to increase
hospital wages but may not be caused by them). To confirm that regional costs affect hospital
prices, we tested the results under two alternative formulations: (1) using the average or the
minimum Medicare wage index for the entire Core-based Statistical Area (CBSA); and (2) using
instead a general cost of living index. These measures are unlikely to be affected by a particular
hospital’s or hospital system’s prices. In both cases, the results were similar to the model that uses
the Medicare wage index. This confirms that exogenous factors that affect hospitals’ costs
contribute to explain hospital prices.37
The second model includes all the variables in the first model plus certain variables that reflect
hospital characteristics: rural hospitals, Medicare DSH revenues per bed, Medicare outlier
operating payments, and the average cost of uncompensated care per discharge.38 In addition, the
model includes the number of organ transplants per bed – a measure used to capture specialized
capacity and medical complexity,39 and the share of outpatient charges over all patient charges
(inpatient and outpatient). The latter attempts to capture whether the formula used to calculate
non-Medicare prices is affected by the presence of different discount factors for inpatient and
outpatient charges.
Results: From these sets of variables, outlier payments and the share of outpatient
services show the strongest correlation with prices. Prices appear to decrease with
DSH payments and increase with rural status, outlier payments, and the number of
organ transplants (and these results are statistically significant).40 Prices also appear
to increase with the amount of uncompensated care.41 Overall, this second model
explains about 56% of the variability in non-Medicare prices.42 For all-payor
prices, the model explains about 73% of the price variation.
The third model adds to the previous model variables that reflect resource utilization. This
includes total assets (as reported in the hospital’s balance sheet) per bed, a measure of utilization
(annual discharges per bed), and hospital size (number of beds).
Results: Prices are strongly correlated with the total hospital assets per bed. This
shows that higher hospital capital expenditures, such as in buildings and equipment,
are associated with higher prices. The coefficients for hospital utilization and size
are negative and statistically significant, which shows that – after controlling for
other factors – average hospital prices tend to be lower at large hospitals and
hospitals with high utilization. Overall, the addition of these variables increases the
explanatory power of the model to 61%. For all-payor prices, the model explains
77% of the price variation.
In the fourth model, we expand the set of explanatory variables to include demographic variables
from the Area Resource File (ARF) for metropolitan areas or CBSAs. These variables reflect the
general population age, sex, race, the percentage of the population in poverty, and the percentage
of population uninsured. We also include health status variables from the Behavioral Risk Factor
Surveillance System (BRFSS). This includes data from a sample population related to health risk
behaviors, from where we calculate the percentage of smokers, heavy drinkers, and persons with a
checkup in the last two years (see Appendix B for more detail on these data sources).
Results: With these variables, the model explains 63% of the variability in nonMedicare prices and 77% of the variability in all-payor prices. It has been observed
that the population’s demographic characteristics and health status explain some of
19
21. the differences in healthcare spending. However, demographic and health status
variables add relatively little explanatory power to this model (in the order of 2% to
3%), and tend to show small coefficients with little statistical significance.
There are two potential explanations for this outcome. First, these metrics may not
affect hospital prices by the same degree they affect healthcare spending. This is
because demographic and health status variables are likely to capture how
frequently the patient needs treatment or how sick the patient is, but not necessarily
any differences in the use of resources during an admission or in the prices insurers
pay for the same procedure. The second reason relates to data limitations. The ARF
and BRFSS data are aggregated by metropolitan area, not by hospital. This creates
the problem of matching hospital patients with the population in each area. But
hospitals receive patients from outside the metropolitan area in which they are
located. In addition, different hospitals in the same area may receive patients with
different demographic and health characteristics. The model developed here is not
able to capture these factors.43
We also tested an alternative model (shown as Model 4b in Appendix C) that includes preliminary
measures of hospital quality (as discussed in the previous section, there are certain methodological
limitations to the use of these variables). This model includes measures of hospital mortality rates
and readmission rates calculated by CMS for Medicare beneficiaries. Overall, mortality rates show
a small positive correlation with hospital prices and readmission rates show a small negative (but
significant) correlation with hospital prices. Another variable used in this preliminary model is the
US News & World Report hospital rankings. These rankings include hospital rankings for 16
specialties, which include a total of approximately 150 hospitals. Although this variable shows
positive correlation with prices, it is not statistically significant in this model. Overall,
mortality/readmission rates and hospital rankings did not contribute significantly to explain the
variability in hospital prices (the model explains about the same variability in non-Medicare prices
(63%) with or without these preliminary quality measures).
The fifth model includes a measure of the average inpatient cost per discharge, as reported by the
hospitals in the Medicare Cost Reports. Although prices and costs are interrelated (making it
difficult to assume that costs are driving prices but prices do not affect costs) it is informative to
assess whether prices are related to costs.
Results: Prices show strong correlation with costs (approximately 75%
correlation). When added to the regression model, this cost measure appears as a
statistically significant variable that increases the explanatory power of the model
to 72% for non-Medicare prices and 83% for all-payor prices. This suggests that
prices are closely related to the average cost per discharge.
SUMMARY OF EMPIRICAL RESULTS AND DISCUSSION
The table below summarizes the results from these models for non-Medicare and all-payor prices,
and shows that a large number of factors appear to explain price differences across hospitals, for
both non-Medicare and all payor.
Overall, these models explain a large proportion of the differences in hospital prices – up to 72%
of differences in non-Medicare prices and up to 83% of differences in all-payor prices.
Furthermore, this Report identifies many variables that show a significant statistical relationship
20
22. with hospital prices: case mix, labor costs, shares of Medicare and Medicaid, DSH status, outlier
payments, uncompensated care, organ transplants, share of outpatient charges, hospital assets,
hospital size, and discharges per bed. Demographic, health status, and quality variables may also
show correlation with prices, albeit these relationships are statistically weaker.44
Model
Explanatory
Variables
Percentage of Price Variation
Explained by the Model
(R-squared Value)
Non-Medicare
1
2
3
4
5
Case mix, teaching intensity, share of Medicare and
Medicaid discharges, and regional costs (wage index)
Model 1 plus rural hospitals, DSH revenues,
Medicare outlier operating payments as percentage of
total PPS operating payments, uncompensated care
per discharge, organ transplants per bed, and share of
outpatient charges
Model 2 plus total assets per bed, annual discharges
per bed, and number of beds
Model 3 plus age, sex, race, percentage of the
population in poverty and uninsured, percentage of
current smokers, heavy drinkers, and persons with a
health checkup in the last two years
Model 4 plus average inpatient cost per discharge
All Payor
48%
67%
56%
73%
61%
77%
63%
77%
72%
83%
Note: for non-Medicare prices, the number of hospitals in each model ranges from 3,461 (Model 1) to 3,402 (Model
5). For all-payor prices, the number of hospitals ranges from 3,503 (Model 1) to 3,444 (Model 5).
Unexplained Price Differences
As in all empirical studies, some variation in the data cannot be explained by the model. The
unexplained price differences in these models are not unusual for an empirical study of this scale
that attempts to explain hospital prices across regions with different populations and state
regulations, among other factors. Although the models can be improved with further research and
data, we view the explanatory power of the models as substantial for several reasons.
First, the variables used in a simplified model cannot capture all the idiosyncratic factors that
affect hospital prices and the intensity of service needed by the population served by hospitals in
different regions of the country. In particular, we find that the complexity of hospital quality and
quality measures made the estimation particularly difficult. Other explanatory factors that
potentially affect hospital prices may have been excluded from the models as well. This includes,
for example, state-level health regulations that affect hospital costs and the supply of medical
resources in the region, Medicaid rates and eligibility, and private-payor characteristics such as
plan size and the share of patients under managed care.
Second, the non-Medicare prices analyzed here are not based on a single-payor formula. Instead,
they are based on a combination of prices from several commercial payors, state-level Medicaid
21
23. programs, and other payors. The factors that determine those prices can vary by region and
according to payor mix in ways not captured by a single model that attempts to explain prices for
the entire country. As a result, factors that affect prices in some states may not affect prices in the
same way in other states and will not be fully captured without a case-by-case inquiry.
Third, the healthcare sector is going through dramatic changes that affect hospitals. As a result,
hospitals are subject to different sources of financial pressure and may respond to them over time
through different pricing and cost-containment strategies.45 These differences likely help explain
differences in the data. These differences in the timing and the type of hospital responses will
appear as unexplained variation in the data.
Finally, there is always some variability or “noise” in the variables caused by errors in the data.
This includes reporting errors in the Medicare Cost Reports, case misclassification and lack of
standardization of hospital data, and errors in other data sources. We eliminated apparent data
errors by excluding observations with extreme values, but it is not possible to audit the data to
eliminate most or all reporting errors. In addition to reporting errors, statistical noise is created
when, for example, demographic variables from a metropolitan area are matched to the underlying
population served by each hospital. This imperfect match between data sources creates additional
variability that cannot be explained by the model.
However, as a matter of economics, it is incorrect to assume, as some researchers have, that any
residual price variation not captured by the model reflects some form of inefficiency or market
power.
“Most real world markets, even those for relatively ‘homogenous’ products and a
market structure inconsistent with significant market power, exhibit significant
price variation. These price differences do not prove that the firms have market
power.” – FTC Chairman Timothy Muris46
The models presented above show that a large proportion of differences in hospital prices can be
explained by factors associated with hospital cost drivers that some commentators have ignored,
such as case mix, regional costs, payor mix, hospital investments, and other hospital
characteristics. Although it is conceivable that differences in prices across markets are the result of
differences in market structure or market conditions, the residual price differences in the data can
also be the result of an array of idiosyncratic factors and data problems that the model is not able
to capture. There is no basis to conclude that these unexplained factors are related to hospital
market power.
22
24. _________________________________________________________________________
SIDE BOX
Specific Application of the Econometric Models to Hospitals in the Regions Assessed by the
“Payment Variation Article”
A recent article, “Wide Variation in Hospital and Physician Payment Rates Evidence of Provider
Market Power” (“Payment Variation Article”), presents results of data analyses on price differences
across hospitals and physicians and asserts market power as the primary cause.1 There are a
number of issues with the data used in this article, which are based on responses by some
insurers that provided payment rates as percentages of calculated Medicare rates. The author
acknowledges that each insurer used its own methodology to calculate these percentages but did
not make an effort to verify and validate the information received.2 As a result, there is no way to
assess whether the price differences shown in the article are the result of differences in Medicare
rates (including Medicare adjustments to specific hospitals), the result of insurers using different
methodologies to calculate average rates, the result of differences in payor mix, or even the result
of differences in the time periods or services covered.3 Even if each insurer is internally
consistent in compiling the data, differences in payor mix can make the comparisons unreliable.
There is no exploration in the article of the many factors that researchers have found that explain
and inform differences among regions – the nature of cases, regional costs, the health status of
the population, the share of Medicare/Medicaid populations, the extent to which hospitals deliver
uncompensated care, and many more factors. For example, the article does not report any
adjustment to the data to consider basic differences in the mix of services delivered by
providers.4
The article concludes, without any support, that hospitals of nearly any size and location all have
“market power.” Crucial to its analysis is the fundamentally flawed claim that price differences
constitute, by themselves, “evidence” of market power.5
We used our econometric models to analyze payment differences in the states and metropolitan
areas covered by the article.6 The results from the analysis of non-Medicare prices in these areas
1
Ginsburg, Paul B, “Wide Variation in Hospital and Physician Payment Rates Evidence of Provider
Market Power,” Center for Studying Health System Change, Research Brief, No. 16 (November 2010).
2
See Payment Variation Article, p. 2, Data Source.
3
The article does not report the time period for the analysis or the services covered in the study. It only
reports average inpatient and outpatient payments (relative to Medicare).
4
The Article acknowledges that some of the price differences might be explained by other factors
(Medicare adjustments, Medicaid rates, uncompensated care), but concludes, without any theoretical or
empirical basis, that the “degree” of differences suggests that market power is important (see p. 7). The
Article also acknowledges that payment differences may be the result of insurer concentration (see p. 2).
However, without further analysis, it concludes that price differences are evidence of provider market
power.
5
The absence of a plausible theory of market power leads the author to conclude that hospitals in both
San Francisco and rural Wisconsin, hospitals that are highly regarded, hospitals that are part of a system,
hospitals in concentrated markets with low rates, and hospitals in unconcentrated markets with high rates,
all have market power. When an actual “market” is not sufficient, the author claims that smaller
“submarkets” are the source of market power. See Payment Variation Article, p. 3.
23
25. are largely similar to those we report in Section III for the entire sample of U.S. hospitals. First,
the regions included in the Payment Variation Article show similar variation in non-Medicare
prices to those of other U.S. regions.7 Second, combining all hospitals in these regions, the
models from the previous section explain approximately the same proportion of difference in
non-Medicare prices as for the entire sample of U.S. hospitals.8
In addition to its data limitations, the Payment Variation Article fails to take into account several
factors that explain differences in hospital prices. These factors have been extensively discussed
in the healthcare literature and shown to explain a large share of the differences in prices across
U.S. hospitals – including the specific regions analyzed by the article. Instead, the article
incorrectly concludes that these price differences constitute “evidence” of market power.
6
The article analyzed eight regions identified as having wide variation in payments: Los Angeles (CA),
San Francisco (CA), Miami (FL), Atlanta (GA), Indianapolis (IN), Cleveland (OH), Richmond (VA),
Milwaukee (WI), and rural Wisconsin.
7
We use the coefficient of variation to measure overall price dispersion (the sample standard deviation
divided by the sample mean). For 2008, the coefficient of variation is 52% for all U.S. hospitals, 50% for
hospitals in the states included in the Payment Variation Article, and 52% for the metropolitan areas
included in the article. Results are similar for other years in the dataset.
8
Although results vary at the state level, a simplified model explains a large proportion of the differences
in non-Medicare prices within each state. Because the state-level analyses are based on fewer hospitals
than the analyses that combine all states, for this analysis we need to use a simplified model with fewer
explanatory variables. The variables used are: CMI, teaching intensity, shares of Medicare and Medicaid
discharges, rural indicator, outlier operating payments, uncompensated care, outpatient share, assets per
bed, and wage index (for California only).
24
26. 1
This report benefited substantially from the assistance of Jeffrey Raileanu and Matthew Schmitt of
Compass Lexecon. This report made use of healthcare literature, data from the Centers for Medicare &
Medicaid Services (“CMS”), and AHA data. The views and opinions presented are solely those of the
authors and do not necessarily reflect the views of organizations with which the authors are or have been
affiliated. The co-authors have worked on a number of healthcare matters for a variety of healthcare
entities, including providers, health plans, government, and associations. A summary of the healthcare
experience is available at www.compasslexecon.com.
2
Haas-Wilson, Deborah, and Christopher Garmon, “Two Hospital Mergers on Chicago’s North Shore: A
Retrospective Study,” Bureau of Economics, Federal Trade Commission, Working Paper, No. 294
(2009), p. 9.
3
Id.
4
The practice of “cost shifting” has been long documented in the healthcare literature. A summary is
provided by Dobson, Allen, Joan DaVanzo, and Namrata Sen, “The Cost-Shift Payment ‘Hydraulic’:
Foundation, History, and Implications,” Health Affairs, Vol. 25, No. 1 (2006) (“Dobson et el., 2006”). A
recent study by Milliman Inc. suggests that hospitals may use different degrees of cost shifting or cost
management to compensate for Medicare payment rates. See Milliman Inc., “High Value for Hospital
Care: High Value for All?” Report commissioned by the National Business Group on Health (March
2010) (“Milliman Inc., 2010”).
5
AHA defines adjusted admissions as inpatient admissions plus an estimate of revenue-equivalent
admissions attributed to outpatient services. Revenue per adjusted admission data are available from AHA
and provide one measure of “price.” Similar measures of “price” are used in this paper, and include
average revenue per discharge.
6
Non-Medicare hospital services and prices are examined as a proxy for services provided to patients
covered by commercial insurance and prices paid by commercial insurers. We developed measures of
hospital inpatient prices based on the Medicare Cost Report data, which provide a means to assess prices
for Medicare as well as non-Medicare inpatient services. The Medicare Cost Reports provide revenue and
discharge data, by hospital, from which we can estimate average hospital inpatient revenues (per
discharge) for Medicare and non-Medicare patients. Non-Medicare patients include patients covered by
commercial payors, Medicaid, other government payors, and self pay. Therefore, we use the term “price”
in this report to refer to our calculated average hospital inpatient revenues per discharge. This measure
reflects average inpatient prices and, to some extent, the hospital’s resource utilization per discharge.
7
We also informed our analyses by reviewing the literature on hospital quality. While quality measures
are very complex and difficult to capture in econometric models, the empirical analyses suggest that
numerous other factors explain the observed differences in hospital prices.
8
We address in Section III how we measure price differences. Our empirical analyses of Medicare prices
and all-payor prices confirm the robustness of the modeling for non-Medicare prices, and the key
explanatory factors. This is because many of the identified factors are expressly used by Medicare as
proxies for costs, and reimbursements for Medicare vary based on these factors.
9
National Health Expenditure Account data is published by CMS and is available at:
https://www.cms.gov/NationalHealthExpendData/.
10
Throughout the text, the terms “expenditures” and “spending” are used synonymously.
11
The analysis uses 2001 for comparison to provide an update of analyses conducted in 2003. See GuerinCalvert, Margaret E., David Argue, Paul Godek, Barry Harris, and Stephanie Mirrow, “Economic
Analysis of Healthcare Cost Studies Commissioned by Blue Cross Blue Shield Association,” February
2003 (“Guerin-Calvert et al., 2003”).
27. 12
Analysis of the CMS “National Health Expenditure Projections 2009-2019” file, last accessed January
14, 2011.
13
Some other categories of total spending, such as Home Health Care, are projected to grow at faster
rates, while others, such as Medical Products outside of prescription drugs, are projected to grow at
slightly lower rates.
14
CMS introduced minor changes in the categorization of health expenditures in its release of 2009 data.
As a result, the expenditures categories from its previous projections for 2009-2019 are not directly
comparable to the expenditure categories in the 2009 data. Nonetheless, hospital care accounts for
approximately the same share of total expenditures over the projected period 2009-2019.
15
See, e.g., AHA, Trendwatch Chartbook 2010, Chart 6.10.
16
See, e.g., “Technological Change and the Growth of Health Care Spending,” Congressional Budget
Office, January 2008. Summarizing academic literature on healthcare spending, the report concludes that
“the general consensus among health economists is that growth in real health care spending was
principally the result of the emergence of new medical technologies and services and their adoption and
widespread diffusion by the U.S. health care system” (p. 6).
17
For a concise summary, see RAND, “Health Information Technology: Can HIT Lower Costs and
Improve
Quality?”
(2005).
For
more
detail,
see
the
CMS
website
at
https://www.cms.gov/EHRIncentivePrograms/.
18
American Hospital Association, “The Road to Meaningful Use: What it Takes to Implement Electronic
Health Record Systems in Hospitals” (2010).
19
American Hospital Association, “Report on the Capital Crisis: Impact on Hospitals” (2009).
20
For example, Li, Bahensky, Jaana, and Ward (2008) find that small hospitals (25 beds or less) are more
likely to be at a further stage of EMR adoption if owned by a multihospital system, even after controlling
for structural capacity measures such as the number of operating rooms and FTE staff. Similarly, the 2008
AHA Annual Survey Information Technology Supplement collected data on computerized system
capabilities for nearly 4,000 hospitals. For each capability specified (e.g., CPOE for medications,
electronic clinical documentation of discharge summaries, etc.), hospitals reported the level of
implementation. Across the full range of computerized system capabilities, hospitals belonging to a
healthcare system were more likely to have implemented computerized systems.
21
Analysis of AHA Annual Survey data for community hospitals, 2000-2009. AHA calculates paymentto-cost ratios based on (i) actual Medicare and Medicaid payments received by hospitals (including
payment adjustments such as DSH and IME), and (ii) estimated Medicare and Medicaid costs. Costs are
estimated from Medicare and Medicaid gross charges multiplied by hospital’s overall cost-to-charge ratio
(i.e., total reported expenses divided by gross patient and other operating revenue). See AHA,
“Underpayment by Medicare and Medicaid,” Fact Sheet, December 2010.
22
Estimated uncompensated care costs are available at: http://www.aha.org/aha/research-andtrends/health-and-hospital-trends/2010.html, (last accessed January 31, 2011).
23
Guerin-Calvert, Margaret E., and Guillermo Israilevich, “A Critique of Recent Publications on Provider
Market Power,” October 4, 2010 (“Critique”).
24
As mentioned above, as a “price” measure, we calculate three price measures using Medicare Cost
Report data: average hospital inpatient revenues for Medicare, non-Medicare, and all payors.
25
Some studies adjust for case mix while others calculate overall per-capita health spending.
26
We focused our statistical analysis on explanatory variables commonly used in the literature. Due to the
limitations described above, our models do not make direct use of quality measures. However, other
explanatory variables may indirectly capture quality effects related, for example, to hospital size, volume,
case mix, and other hospital-level characteristics.
28. 27
A result is considered statistically significant if it is unlikely to have occurred by chance. We refer to
statistical significance at the 5% level. This means that that there is 5% (or less) probability that the
observed relationship could have happened by coincidence.
28
In a letter addressing our Critique, the Massachusetts Assistant Attorney General incorrectly claims that
the Medicare Cost Reports do not contain payment data from commercial payors and “only contain
hospital-reported costs.” This is incorrect. The Medicare Cost Reports contain data on hospital charges
and revenues for Medicare and all payors, from which we are able to estimate average prices for nonMedicare payors, as described in more detail below. See Letter from Thomas O’Brien, Assistant Attorney
General, The Commonwealth of Massachusetts, Office of the Attorney General, December 8, 2010, p. 2.
29
We use the formula provided by Dafny (2009) to estimate average non-Medicare revenues per
discharge. See Dafny, Leemore S., “Estimation and Identification of Merger Effects: An Application to
Hospital Mergers,” Journal of Law and Economics, Vol. 52, No. 3 (2009), p. 531 and fn. 13 (“Dafny,
2009”).
30
This is because non-Medicare inpatient revenues have to be estimated from the revenue data provided
for all the hospital’s patient services (that is, for both inpatient and outpatient services). Another
limitation of the Medicare Cost Reports is that the calculated non-Medicare prices represent an average
for commercial payors, Medicaid, other government, and self pay. As such, our price variable may show
more variation than what would be observed from actual hospital prices for inpatient services, because it
includes other types of payment. This may limit the ability of the model to explain price differences. For
example, if a hospital has a large share of outpatient services, and revenues for these services are subject
to higher discounts over charges (relative to inpatient services), our calculation will tend to reflect lower
inpatient revenues relative to those from hospitals with a smaller share of outpatient services.
31
The data used in the regression analyses are limited to general short-term and specialty hospitals under
Medicare’s Prospective Payment System (PPS). For other hospitals, the Cost Reports do not provide
detailed data to calculate non-Medicare prices, and CMI data are not available from the CMS website.
32
This is known as the “between” estimator in the panel data methodology.
33
Approximately 200 hospitals were dropped because of insufficient data (these represent approximately
2% of non-Medicare discharges). This includes approximately 27 Kaiser Foundation Hospitals that are
dropped because they do not provide data on total inpatient charges in the Medicare Cost Reports.
34
The wage index is defined at the Core Based Statistical Area (CBSA) level and adjusted for hospital
specific factors such as occupational mix. We also included a time-trend variable to reflect any minor
differences across hospitals due to differences in the fiscal years covered.
35
The teaching intensity variable, although statistically significant in the model for all payors, is not
significant in this model formulation for non-Medicare prices (see Appendix C for additional detail). This
coefficient also depends on the region and/or states under analysis.
36
The statistical significance of the Medicare and Medicaid discharges varies depending on the model.
37
We use the Medicare wage index in the model because it is available for more hospitals (in particular,
those outside urban centers for which cost of living data are not available).
38
Outlier payments are not reported by CMS for hospitals in Maryland (Maryland hospitals are not
reimbursed under Medicare’s Inpatient Prospective Payment System). As a result, 45 Maryland hospitals
are not included in this model and the models that follow. Also, note that the results of the first model do
not change significantly if we exclude Maryland’s hospitals (which are subject to the state’s rate
regulation).
39
See Koenig, Lane, Allen Dobson, Silver Ho, Jonathan M. Siegel, David Blumenthal, and Joel S.
Weissman, “Estimating the Mission Related Costs of Teaching Hospitals,” Health Affairs, Vol. 22, No. 6
(2003) (“Koenig et al., 2003”).
29. 40
Note that DSH payments are not statistically significant in the fifth model discussed below. Also, as
part of Medicare’s reimbursements, DSH payments are positively correlated with Medicare prices (and
statistically significant).
41
Uncompensated care and the share of Medicare discharges are positively correlated with prices. This
finding is consistent with the empirical findings on cost shifting from Dobson et al., 2006, and others.
Since Medicaid and commercial discharges are both included in our measure of non-Medicare prices, we
cannot test the presence of cost shifting between Medicaid and commercial payors.
42
Results from this model are largely unchanged if one uses dummy variables to identify DSH and
teaching hospitals, or if one uses the Medicare DSH and IME adjustment percentages, as reported in the
PPS Impact Files, instead of calculating these amounts per discharge. In addition, these variables do not
exhibit high colinearity with the shares of Medicare and Medicaid discharges introduced in the first
model.
43
Another limitation of the BRFSS data is that for certain areas the sample of respondents is too small to
be considered statistically reliable.
44
There is more than 50% correlation between Medicare and non-Medicare prices. As noted in the
Critique, similar variables explain Medicare average inpatient revenues (or “prices” in our model).
Overall, the models shown above explain about 90% of the variability in Medicare prices. Certain
variables that determine Medicare’s reimbursements show strong correlation with prices. This includes
case mix, wage index, teaching intensity, DSH, outlier payments, among other variables.
45
A study by Milliman Inc. identified cities with low per-capita hospital revenues for both Medicare and
commercial payors, as well as cities in which hospitals had low Medicare revenues but relatively high
commercial revenues. Milliman Inc. could not identify common factors such as cost drivers or market
characteristics for either group. It concludes that hospitals may use different degrees of cost shifting or
cost management to compensate for Medicare payment shortfalls. See Milliman Inc., 2010.
46
See FTC Chairman Timothy Muris, “Improving the Economic Foundations of Competition Policy,”
Section III, Part B, January 15, 2003. The literature in economics discusses price dispersion in the context
of product differentiation, costly information, technological progress, and price discrimination. See, e.g.,
Levya, David M., and Michael D. Makowskyb, “Price Dispersion and Increasing Returns to Scale,”
Journal of Economic Behavior & Organization, No. 73 (2010); and Telser, Lester G., Economic Theory
and the Core, The University of Chicago Press (1978), chapter 7.
______________________________________________________________________________
30. Appendix B: Data and Methodology
A.
Centers for Medicare & Medicaid Services (“CMS”) Cost Reports
We use Centers for Medicare and Medicaid Services Cost Reports (“Medicare Cost Reports” or
“Cost Reports”) to obtain, for each hospital, aggregate estimates of Medicare and non-Medicare
average inpatient revenues per discharge. These reports also provide additional information on
discharges, hospital characteristics, and Medicare payments. Below is a summary of the main
information provided by the Cost Reports:
Hospital information: type of hospital, type of control, urban/rural, teaching, DSH status,
number of beds, interns and residents, solid organs transplants, etc.
Discharge data: inpatient discharges and outpatient visits (total, Medicare, and Medicaid)
Total hospital patient charges (inpatient and outpatient) and total revenue
Total Medicare charges, total costs, inpatient revenues, and other Medicare payments
(e.g., DSH, IME, SCH/MDH)
Hospital costs: average hourly salaries, full-time equivalent staff, uncompensated care,
total hospital operating cost, and balance sheet data
One limitation of the Cost Reports is that they do not provide actual payments for inpatient
services from each payor. They only provide payment data on total patient services (that is, for
both inpatient and outpatient services) and Medicare. Another limitation is that they provide
inpatient discharges for Medicare, Medicaid, and a total for all payors. Consequently, one can
only calculate discharges for an “other” category that would include third party payors, managed
Medicare and Medicaid, self pay (and bad debt), and other payors. The reports are based on each
hospital’s fiscal year (approximately 90% of the hospitals have fiscal years ending in June,
September, or December). Observations that reported time periods other than a full year were
dropped.
The data used in the regression analyses are limited to general short-term and specialty hospitals
under Medicare’s Prospective Payment System (PPS) in the 50 states and the District of
Columbia.1 For other hospitals, the Cost Reports do not provide detailed data to calculate nonMedicare prices, and CMI data are not available from the CMS website.
Construction of Price Variables2
The average hospital inpatient price per discharge can be estimated as:
IP Price (All Payors) = (Total IP Charges * Discount Factor) / Total IP Discharges,
where Total IP Charges include general inpatient routine care charges, intensive care charges,
and inpatient ancillary services charges; the discount factor is based on the ratio of total hospital
1
The state of Maryland has a Medicare waiver which allows the state to set hospital rates for Medicare.
These hospitals are also analyzed even though they are not reimbursed under PPS.
2
Hospitals lacking necessary pieces of the price variables, e.g., the ratio of payments to charges (or
discount factor), are excluded. Depending on the price variable, this results in the loss of between 2-3% of
all hospitals in the dataset. Most if not all Kaiser Foundation Hospitals in California are excluded as their
Cost Report data are insufficient to calculate inpatient charges.
31. revenues to total charges (inpatient and outpatient); and discharges exclude swing beds, hospice,
and skilled nursing facilities.
For Medicare, the Cost Reports provide data on IP charges, payments and discharges. The
average Medicare IP price per discharge is calculated as:
IP Price (Medicare) = Medicare IP Payments / Medicare Discharges
In order to obtain a measure of non-Medicare prices, we follow the formula proposed by Dafny
(2007).3 This formula excludes Medicare revenues and discharges from the average IP price
calculation:
IP Price (Non-Medicare) =
(Tot. IP Charges * Discount Factor – Medicare IP Payments) / Non-Medicare Discharges,
where the “Medicare IP Payments” subtracted in the numerator include DSH, IME, GME and
other revenues from Medicare. Hence, all Medicare payments are excluded from the calculation
of non-Medicare prices.
Removal of Extreme Values
Several key variables affecting the estimated price measures (e.g., total discharges, inpatient
charges, etc.) and explanatory variables (e.g., beds) are scanned for extreme values, or statistical
outliers. For each variable, the mean value of that variable is calculated by hospital across the 5
years in the sample. If a given observation for that hospital departs from the mean by a
percentage greater than a specified threshold, that observation is replaced as missing. The mean
is then recalculated and the process iterated until there are no remaining extreme values. The
threshold is determined by the nature of the variable – for example, the threshold for beds is
lower than that for inpatient charges since it is more likely for there to be bigger changes year to
year in inpatient charges than in beds. In addition, observations with revenues per discharge of
less than $500 or greater than $35,000 were also dropped. Depending on the variable, this
process affects anywhere from effectively 0% of the observations up to approximately 2% of the
observations. In each case, the observations being replaced as missing were examined to make
sure that the process was detecting likely data errors rather than removing substantive data.4
B. CMS Hospital Inpatient Prospective Payment System (“PPS”) Final Rule Impact
Files5
The Final Rule Impact Files (“Impact Files”) contain information for hospitals reimbursed under
PPS (and those in the state of Maryland). In addition to variables specifying the location of each
hospital such as region and county, information is also provided on CMI (including transferadjusted), beds, resident to bed ratio, DSH adjustment, and various other factors that Medicare
3
Dafny, 2009, p. 531 and fn. 13.
We note that regression analyses without removing these extreme values lead to essentially similar
results, albeit with lower R-squared values due to the additional noise these extreme values add to the
model variables.
5
For more detail, see: http://www.cms.gov/AcuteInpatientPPS/01_overview.asp#TopOfPage
4
32. uses to adjust PPS payments. As noted above, hospitals with no CMI data (typically non-PPS
hospitals) are excluded from the analysis.6 Key variables that are used from the Impact Files
include CMI, Wage Index, and Outlier Payments, described in further detail below.
Case Mix Index (CMI): Individual inpatient discharges are associated with a Diagnosis Related
Group (DRG) that classifies patients that use similar hospital resources into the same group (e.g.,
DRG 7 refers to lung transplants). Each DRG has an associated DRG-weight which reflects the
estimated relative costliness of patients in that DRG compared with the average Medicare patient
across the country. CMI provides the average DRG weight for the hospital, calculated as the sum
of all DRG weights for Medicare discharges divided by the total number of discharges.
Wage Index:7 For each labor market area, where the areas are defined as Core Based Statistical
Areas (CBSAs) and statewide rural areas outside of CBSAs, CMS calculates an average hourly
wage as total wage costs divided by total hours for all hospitals in the area. Similarly, a national
average hourly wage is calculated. The wage index is defined as the ratio of the area’s average
hourly wage to the national average hourly wage. Various adjustments to this ratio can be made
by CMS for hospitals that, for example, lie near a CBSA border and are determined to face a
labor market more appropriately defined by a higher-cost adjacent CBSA. Adjustments are also
made for occupational mix.
Outlier Payments:8 Outlier payments exist to reimburse hospitals for cases with costs that exceed
the fixed-loss cost threshold amount, which is determined yearly by CMS and then adjusted by
case and hospital for DRG weight, wage index, IME, DSH, etc. For each dollar in cost exceeding
the determined threshold, the hospital is reimbursed at a constant rate of between 80-90%,
depending on the DRG. Payments are determined separately for operating and capital costs,
which are affected by the hospital’s operating and capital cost-to-charge ratios and several other
adjustments. The Impact Files provide data on outlier payments as a percentage of provider
operating/capital PPS payments.
6
Approximately 2% of the observations in the Medicare Cost Reports (for short-term general and
specialty hospitals) do not have CMI data in the impact files.
7
For more detail, see: https://www.cms.gov/AcuteInpatientPPS/03_wageindex.asp. MedPAC has
proposed an alternative wage index measure that smoothes the index between counties, uses wage data
from BLS/Census surveys rather than hospital cost reports, and fixes the occupational mix rather than
allowing it to vary by hospital. The MedPAC index does not appear to have been made publically
available. For more detail, see: http://www.medpac.gov/documents/Jun07_EntireReport.pdf.
8
For more detail, see: https://www.cms.gov/AcuteInpatientPPS/04_outlier.asp#TopOfPage. While the
CMS impact files typically contain CMI information for Maryland hospitals, outlier payments are not
present (due to the different system of reimbursement). Therefore, all regressions including outlier
payments exclude all Maryland hospitals.
33. C. Behavioral Risk Factor Surveillance System (“BRFSS”)9
The Centers for Disease Control and Prevention (CDC) collects data on a variety of questions
related to health risk behaviors, healthcare access, and health status. The data are collected via
telephone interview from approximately 350,000 adults a year. Each record in the data is an
individual survey, which can be aggregated by county, state, or any areas composed of counties
and/or states. Most variables are self reported, and respondents may refuse to answer questions.
Data were analyzed for survey years 2000-2009, with each variable calculated across all
available surveys over the period. When aggregating to the CBSA level, all non-CBSA counties
in a given state are considered part of the “rural” area of the state. The variables used are:
Current Smoker: defined as those who have smoked 100 cigarettes in their life and smoke
either “every day” or “some days” at the time of the survey
Heavy Drinker: defined as those males who drink an estimated 60 or more drinks every
30 days, and females who drink an estimated 30 or more drinks every 30 days
Health Checkup: time since last visit to a doctor for a routine checkup (a general physical
exam not for a specific injury or illness)
D. Area Resource File (“ARF”)10
The ARF is published by the Health Resources and Services Administration (HRSA). It is a
collection of data from a wide range of sources at the county level. ARF compiles information
from the American Medical Association and the American Hospital Association, among other
sources. Population characteristics such as income and racial makeup are compiled from Census
data. When aggregating to CBSA, all non-CBSA counties in a given state are considered part of
the “rural” area of the state. The variables used in the analysis typically measure these
characteristics as percentages of the total population in the area – e.g., the percentage of
population in the CBSA under age 65 that have health insurance.
E. Quality Data
Risk-adjusted 30-day readmission and mortality rates for heart attack, heart failure, and
pneumonia for Medicare beneficiaries are obtained from Hospital Compare data.11 To estimate
these rates, CMS uses Medicare claims data and a risk-adjustment process that controls for
factors such as age, gender, and comorbidities. Mortality and readmission rates, however, are not
available for all hospitals in our sample. We also included in the dataset indicator variables
marking hospitals that appear in the 2010-2011 US News & World Report “Best Hospitals.”12
9
For more information, see: http://www.cdc.gov/brfss/.
For more information, see: http://arf.hrsa.gov/.
11
For more information, see: https://www.cms.gov/HospitalQualityInits/11_HospitalCompare.asp.
12
For more information, see: http://health.usnews.com/best-hospitals/rankings.
10
34. Explanatory Variables
The table below summarizes the explanatory variables used and the source of each variable (the
price variables are calculated from the Medicare Cost Reports as described above). Some
variables are directly available from the specified source while others are calculated.
Explanatory Variable
Source
Explanatory Variable
Source
Case-Mix Index (CMI)
Impact Files
Average Inpatient Cost per Discharge
Cost Reports
Medicare Wage Index
Impact Files
% Population Black in Hospital CBSA
ARF
Operating Outlier Payments (%)
Impact Files
% Population Hispanic in Hospital CBSA
ARF
Share of Medicare Discharges
Cost Reports
% Population in Poverty in Hospital CBSA
ARF
Share of Medicaid Discharges
Cost Reports
% Population Male in Hospital CBSA
ARF
Teaching Intensity (Interns and Residents
per Bed)
Cost Reports
% Population Under Age 65 Insured in
Hospital CBSA
ARF
Rural Hospital Indicator
Cost Reports
Average Age in Hospital CBSA
ARF
Share of Outpatient Charges over Total
Charges
Cost Reports
% Population Current Smoker in Hospital
CBSA
BRFSS
Total Hospital Assets
Cost Reports
% Population Heavy Drinker in Hospital
CBSA
BRFSS
Hospital Beds
Cost Reports
% Population with a Health Checkup in Last
2 Years in Hospital CBSA
BRFSS
Total Discharges per Bed
Cost Reports
Mean of 2008 30-day Mortality Rates for
Heart Attack, Heart Failure, and Pneumonia
Hospital Compare
DSH amount
Cost Reports
Hospital Compare
Organ Transplants per Bed
Cost Reports
Mean of 2008 30-day Readmission Rates for
Heart Attack, Heart Failure, and Pneumonia
Uncompensated Charges per discharge
Cost Reports
2010 US News & World Report Best
Hospitals in any of the 16 Specialties
US News
Conversion of Variables to Logarithmic Form
In the literature reviewed, some researchers convert variables to logarithmic form.13 For ease of
exposition, we convert the price variables and the explanatory variables to logarithmic form. One
advantage of this approach is that the coefficients from the regression models (see Appendix C)
can be interpreted as the percentage change in prices from a 1% change in the explanatory
variable.14
13
Logarithms are standard functions used in various scientific formulas. One advantage of converting a
variable to logarithmic form is that extreme values are “smoothed out” into smaller scopes. This reduces
the possibility that the regression results are driven by a few unusual observations.
14
The time trend variable and the indicator variables (rural and US News & World Report Best Hospitals
indicators) are not converted to logarithmic form.
35. This transformation does not generally change the explanatory power of the models with respect
to the alternative level regressions.15 In a few cases, the transformation to logarithmic form
changes the statistical significance of the variables. For example, mortality and readmission rates
show significant correlation with hospital prices in the logarithmic regressions but not in the
level regressions. The reverse occurs with the teaching intensity variable and the US News &
World Report hospital rankings, which show statistically significant correlation in the level
regressions but not in the logarithmic regressions.
15
The conversion to logarithmic form changes the interpretation of the R-squared values of the
regressions. However, considering that the R-squared values are similar to those from level regressions
with the same variables, we refer to the R-squared values as the proportion of the price variation
explained by the model.
36. Appendix A: Summary of Literature
This Appendix provides summaries of selected empirical studies that focus on the variation in
healthcare spending, costs, and prices. The table below summarizes the explanatory variables
used in each study. In addition, we discuss the literature that explores hospital quality.
Studies Focused on Medicare Spending
Cutler and Sheiner (1999) identify large regional variations in Medicare spending across
212 hospital referral regions.1 The authors note that these differences may or may not
reflect inefficiency. In order to examine the source of regional differences, they conduct a
series of regression analyses that measure the extent to which regional differences in
Medicare spending can be explained by differences in illness, demographic differences
that affect the demand for medical care, or differences in the supply of medical care.
They find that variables related to illness explain 66% of the variability in Medicare
spending. Demographic factors and variables that reflect medical supply further increase
the explanatory power of the model to between 75 and 80%.2
Researchers associated with the Dartmouth Atlas Project have reported in several studies
a wide regional variation in Medicare spending.3 The studies have either focused on
price-adjusted Medicare spending by region or samples of patients presumed to be
similarly ill across regions, with few adjustments for patients’ demographic
characteristics and health status. According to the Dartmouth researchers, some of the
regional variation is due to differences in prices paid for similar services, and some is due
to differences in illness, but large differences remain in terms of the volume of healthcare
services received by patients in different regions. These differences in volume are shown
in the more frequent use of hospital or physician services, diagnostic tests, and other
procedures in some regions. They also conclude that integrated delivery systems offer
great promise for improving quality and lowering costs. It remains unclear, however,
1
Cutler, David M., and Louise Sheiner, “The Geography of Medicare,” American Economic Association
Papers and Proceedings, Vol. 89, No. 2 (1999) (“Cutler and Sheiner, 1999”). Hospital referral regions are
created by grouping zip codes into geographic units where a preponderance of hospital admissions occur.
2
Some demographic factors (share of the population that is black, Hispanic, female, poor, or rich)
increase the explanatory power of the model to approximately 70%. It should be noted, however, that the
data used in this study already adjusts spending by age, race, sex and differences in Medicare payment
rates by region. This reduces the apparent explanatory power of the demographic variables. In terms of
medical supply, areas with large shares of for-profit hospitals and specialists appear to have higher
spending, although the authors note that these variables are potentially endogenous (for example, high
medical spending among sick populations may contribute to increase the supply of specialists but may not
be caused by it).
3
See Fisher, Elliott S., Julie P. Bynum, and Jonathan S. Skinner, “Slowing the Growth in Health Care
Costs – Lessons from Regional Variation” The New England Journal of Medicine, Perspective (February
2009); “The Policy Implications of Variations in Medicare Spending Growth,” The Dartmouth Atlas of
Health Care (2009). See also Fisher, Elliott S., David E. Wennberg, Therese A. Stukel, Daniel J. Gotlieb,
F.L. Lucas, and Etoile L. Pinder, “Implications of Regional Variations in Medicare Spending - Part I,”
Annals of Internal Medicine, Vol. 138, No. 4 (2003) (“Fisher et al., 2003”); and Fisher, Elliott S., David
E. Wennberg, Therese A. Stukel, and Daniel J. Gottlieb, “Variations in The Longitudinal Efficiency of
Academic Medical Centers,” Health Affairs (2004) (“Fisher et al., 2004”).
37. whether the observed differences in utilization respond to unobservable patient
characteristics—as reflected in the demographic and health status variables used in other
studies, graduate medical education and other Medicare payments, provider and/or payor
characteristics (e.g., supplemental coverage), or inefficiency.
In a more recent study, Zuckerman et al. (2010) analyzed regional Medicare spending per
beneficiary.4 The study finds that the observed geographic differences in spending could
be explained in large part by differences in patients’ demographic characteristics and
health status. Demographic characteristics reduced the magnitude of the unexplained
differences by about 50% (measured as the difference between the first and fifth quintiles
of the distribution). Variables reflecting health status of the population further reduced
the unexplained differences to 33%.5 Zuckerman et. al (2010) conclude that previous
findings may exaggerate the importance of regional differences in Medicare spending if
these differences are in part due to unmeasured patient characteristics.6
Reschovsky et al. (2011) conducted a beneficiary-level analysis with additional
explanatory variables to capture demand factors, such as patient characteristics and health
status, and supply factors, such as the number of hospital beds, physicians and the
availability of other healthcare resources.7 Consistent with Zuckerman el at. (2010), this
study finds that the large majority of Medicare service use can be explained by health
status and patient demographics, with supply factors being insignificant or weakly related
to service use.
The Medicare Payment Advisory Commission (“MedPAC”) analyzed regional
differences in Medicare spending and Medicare service use.8 MedPAC’s analysis adjusts
raw Medicare spending per region to obtain a measure of Medicare “use” of services (i.e.,
a measure of the “quantity” of services delivered). To do this, MedPAC first adjusts
Medicare spending for differences in Medicare payment rates (e.g., regional wages and
4
As in Cutler and Sheiner (1999) the data are adjusted by Medicare standardized prices but could not be
adjusted to remove Medicare payments for DSH and teaching hospitals. See Zuckerman, Stephen,
Timothy Waidmann, Robert Berenson, and Jack Hadley, “Clarifying Sources of Geographic Differences
in Medicare Spending,” The New England Journal of Medicine, Special Article (2010) (“Zuckerman et
al., 2010”).
5
Other variables reflecting income and the supply of healthcare resources did not add significant
explanatory power to the model.
6
In their study, Zuckerman et al. (2010) show that the results from simple models that only incorporate
some baseline health characteristics and demographic variables are similar to earlier results obtained by
Sutherland et al. (2009) and Dartmouth researchers. See Sutherland, Jason M., Elliott S. Fisher, and
Jonathan S. Skinner, “Getting Past Denial—The High Cost of Health Care in the United States,” The New
England Journal of Medicine, Perspective (September 2009); and Fisher et al., 2003.
7
Reschovsky, James D., Jack Hadley, Cynthia B. Saiontz-Martinez, and Ellyn R. Boukus, “Following the
Money: Factors Associated with the Cost of Treating High-Cost Medicare Beneficiaries,” Health Services
Research (article online in advance of print - February 2011). This study uses standardized cost as a
measure of service use. This measure includes the full reimbursement from Medicare, other insurers and
patient payments, eliminates geographic payment differences that account for input price variation, and
adjusts for other Medicare payments such as DSH and graduate medical education.
8
“Regional Variation in Medicare Service Use,” Medicare Payment Advisory Commission, Report to the
Congress (January 2011).
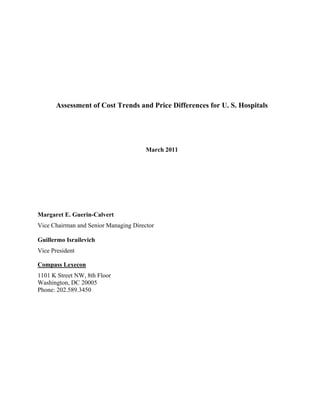
![Assessment of Cost Trends and Price Differences for U.S. Hospitals1
“In a market with differentiated products [such as a hospital market], different price levels are
neither necessary, nor sufficient, to demonstrate the exercise of market power.”
– Federal Trade Commission Working Paper No. 2942
Executive Summary
This paper is the second in a series examining issues that have a bearing on the development of
new and innovative healthcare delivery arrangements, such as Accountable Care Organizations
(“ACOs”), medical homes and other arrangements that require greater clinical and/or financial
integration among caregivers (hospitals and physicians).
The first paper, “A Critique of Recent Publications on Provider Market Power” (“Critique”),
examined claims made in two publications widely cited as support for limiting caregivers’
flexibility to develop or expand innovative delivery arrangements with exaggerated claims of
provider market power. These publications focused on differences in prices among hospitals in
two states, linking higher hospital prices to insurers directly to market power. Both ignored or
rejected other explanations for price differences, such as differences in the prevalence of disease
or illness and numerous other tangible factors. The Critique concluded after rigorous analysis that
neither publication lends any credible support for such claims.
This second paper, “Assessment of Cost Trends and Price Differences for U.S. Hospitals” (“Cost
Trends”), provides an in-depth examination of the costs hospitals incur in providing patient care
and why those costs may differ among various types of hospitals, as well as the relationship of
costs to prices. The key findings demonstrate that hospital prices are directly related to the costs of
providing services to patients and their communities, including wages, capital investment, and the
level and specialization of services. Thus, Cost Trends should dispel un- or poorly-supported
claims that differences in hospital prices are attributable automatically to market power. Perhaps
more importantly, the research demonstrates a link between improving care coordination, cost
reduction and, lower prices.
A brief summary follows.
1](data:image/gif;base64,R0lGODlhAQABAIAAAAAAAP///yH5BAEAAAAALAAAAAABAAEAAAIBRAA7)