
Empfohlen
Weitere ähnliche Inhalte
Was ist angesagt?
Was ist angesagt? (19)
Ähnlich wie microphone-strut-catalog
Ähnlich wie microphone-strut-catalog (20)
microphone-strut-catalog
- 1. Microphone Strut Catalog and Stress Analysis Braden E. Frigoletto∗ Lehigh University, Bethlehem, Pennsylvania, 18015, United States of America The National Full-Scale Aerodynamics Complex (NFAC) located at NASA’a Ames Re- search Center is one of the premier testing facilities used to conduct aeronautic acoustics research. To collect data, microphones must be mounted within the wind tunnels during a test and are secured via aerodynamic struts bolted to the floor. Currently, the NFAC employs a variety of microphone struts of different shapes and sizes to collect this acoustic data. These struts are not well documented and over years of use they’ve been modified, sometimes more than once, to the point where their safe operational limits have become vague. This is a potentially dangerous situation due to the fact that the NFAC mandates strict lower limits on factors of safety for structures placed within the test sections. This calls for the creation of an updated inventory of struts available for use within the NFAC, along with stress analyses and recommended maximum safe operational wind tunnel speeds for each strut. Nomenclature NFAC National Full-Scale Aerodynamics Complex TTR Tilt-Rotor Test Rig F Force, lb M Moment, lb-in σ Normal Stress, psi τ Shear Stress, psi σ Equivalent von Mises Stress, psi K Stress Concentration Factor Sy Tensile Yield Strength, psi Sut Tensile Ultimate Strength, psi Ssy Shear Yield Strength, psi Ssu Shear Ultimate Strength, psi Ix Second Area Moment of Inertia about x-axis of cross section, in4 Iy Second Area Moment of Inertia about y-axis of cross section, in4 ¯X X-Location of Center of Gravity for cross section, in ¯Y Y-Location of Center of Gravity for cross section, in ny Factor of Safety, Yield nut Factor of Safety, Ultimate nsy Shear Factor of Safety, Yield nsu Shear Factor of Safety, Ultimate Cl Coefficient of Lift Cd Coefficient of Drag Sl Lift Area, in2 Sd Drag Area, in2 α Angle of Attack, deg. V Wind Tunnel Free Stream Velocity, knots q Dynamic Pressure, psf ρ Density of Fluid, slugs/ft3 ∗Undergraduate Intern, Rotorcraft Aeromechanics, NASA Ames Research Center, Moffett Field, CA 1 of 63 American Institute of Aeronautics and Astronautics
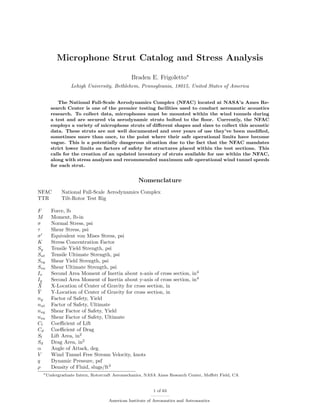
- 2. I. Introduction and Primary Objective Currently, engineers at NASA Ames are unaware of all the microphone struts available for use in the NFAC as well as their maximum safe wind tunnel speed. To approach this problem the NFAC’s warehouses and inventories must be searched so microphone struts can be documented and inspected. These struts must also be measured and dimensioned for stress analyses and 3D CAD modeling purposes. XFLR5, a 2D/3D airfoil and wing analysis program, can then be used to determine Cl and Cd for each strut. Hand-written, conservative stress analyses are performed to get an approximate sense of the stress struts experience. In the NFAC Operations Manual1 it states that for ductile materials the allowable stress for tension, shear, bending, torsion, and buckling generally must meet a factor of safety of three (ny=3.0) for tensile yield strength and a factor of safety of five (nut=5.0) for ultimate tensile strength. This is the standard that NASA employs when it determines what structures are deemed safe for their inclusion in the wind tunnel test sections. However, personnel at NASA usually design and allow for small structures like microphone struts to operate at nut=4.0 and ny=3.0 for tests in the NFAC; therefore, stress analyses done in this study will use this standard. Creo Parametric/Simulate will be the 3D CAD/FEA software used to model and conduct stress simulations on the microphone struts. The primary objective of this study can be accomplished after comparing the handwritten and FEA analyses and documenting the safe operational wind speed limit for each strut. A. Secondary Objective While the primary objective of this study is to document and analyze every strut available for use in the NFAC, time restrictions made it clear that not all struts could be finished within the 10-week internship. That being said, priority was set forth to find a strut that could operate safely within the 40-by-80 Foot Wind Tunnel up to it’s maximum speed V =300 knots. In an upcoming test in the 40-by-80 Foot Wind Tunnel, the Tilt-Rotor Test Rig (TTR) will be tested in isolation to record and observe the acoustic behaviors inherent to the rig itself. This test demands a microphone strut, 4’-7’ tall, capable of safely operating at this speed. Therefore, efforts were directed during the analyses portion of the study to discover a strut that fits these requirements. II. Procedure A. Inventory and Measurements This process began by meeting with the head NFAC warehouse manager, Jarvis Gross, and inspecting the most current NFAC inventory catalog. While reading through the entire catalog, every item named “Acoustic Strut,”“Microphone Strut,” etc. was recorded with its inventory identification number and location. It should be noted that some items were vaguely named so there is a chance that more struts exist and were not discovered. It should also be noted that struts belonging to the Y-Rail acoustic measurement device were not included in this study. In total, 21 struts were identified and located within the NFAC warehouses. See Table 1 for strut inventory numbers and locations. One peculiarity associated with this study is that technical drawings for these struts are lost and/or nonexistent. Therefore, since an official reference was lacking, measurements were physically recorded. Each strut was then visited in person to inspect its condition and take measurements. During inspection it was noted that most struts featured a rectangular or circular base welded to a structural support. The support structures consisted of steel plate and/or tube welded together to form a structural mast with which acoustic foam and plastic/sheet metal are molded around to produce an aerodynamic profile, Fig. 1. Some struts exhibit great decomposition and degradation to the aerodynamic cladding, Fig. 2, and would require replacement before they could be used in the wind tunnel. Therefore, struts like these held a lower priority to those that could see use in wind tunnels immediately. Measurements were recorded with a tape measure, ruler, and electronic calipers. B. XFLR5 and Strut Airfoil Analysis It was necessary to measure each strut’s airfoil so Cl and Cd could be determined. These coefficients were necessary so the lift and drag forces could be calculated and used in the stress analyses. Measuring the 2 of 63 American Institute of Aeronautics and Astronautics
- 3. Figure 1: Support structure of a microphone strut Figure 2: Deteriorated acoustic cladding airfoil proved to be difficult due to the fact that each strut used a non-standard airfoil, some had attachments that made it challenging to measure, and others were simply too tall. While some airfoils were possible to measure and recreate successfully within XFLR5, the results from the analysis seemed skewed compared to similar NACA airfoils. For example, strut N10347 is quite similar to NACA 0028, Fig. 6. Yet the analysis results show that N10347 has a significantly larger Cl and a lower Cd compared to the NACA 0028 airfoil. The approach taken to circumvent this problem was to measure the chord length and max thickness of each struts airfoil, then use those dimensions to calculate the similar NACA 00XX airfoil, most were NACA 0027 and 0028. Analyses in XFLR5 were done for varying flow conditions for the NACA 00XX airfoils. The Cl calculated from these analyses were used, however with the average Cd≈ 0.01, a Cd =0.1 was used for all struts to keep the analyses conservative. While this is far from the best possible outcome for the situation, a conservative approach was deemed acceptable to save time and resources. Figure 3: Profile differences between the airfoil for strut N10347 (green) and the NACA 0028 airfoil (red) C. Strut Stress Analysis To begin the analysis, the first step was to pick a strut of interest. Struts with a height of 4’-7’ were examined first due to the higher priority TTR test requirements. An Excel document was made that allows input for strut geometry and initial conditions and outputs stresses and factors of safety for a list of 3 of 63 American Institute of Aeronautics and Astronautics
- 4. dynamic pressures and corresponding wind tunnel velocities, Appendix B. This estimation was done to find a reasonable wind tunnel speed, V , and dynamic pressure, q, for the stress analysis as well as to provide a check on the results from stress simulations. Knowing that, q = 1 2 ρV 2 (1) the dynamic pressure of the wind tunnel flow can be calculated. However, the NFAC has structural limitations with its north wall such that temperature controls must be used to reduce dynamic pressure from q=336.5 psf, at ambient temperatures and V =300 knots, to q=262 psf. Using the geometry of the strut and assuming that at worst the strut experiences an offset to the free stream of α=2◦ , the corrected front and side lengths of the strut as seen by the free stream are calculated. These lengths are multiplied by the strut’s total height to calculate Sl and Sd. With this, both the lift and drag forces can be calculated with: L = qSlCl (2) D = qSdCd (3) A similar process is done for the case of a tapered strut with a nonuniform chord length. After the lift and drag forces are calculated, attention is turned to the geometry of the strut cross section to determine the location of the center of gravity, Eq. 4, along with the area moments of inertia, Eq. 5 and Eq. 6. The center of gravity must be known so proper distances can be applied when calculating stresses due to bending moments. It is also worth noting that every strut is symmetric about the x-axis, meaning that ¯Y =0 in. for all struts. The area moments of inertia are necessary to calculate the normal stress due to bending caused by the lift and drag forces. Initially, Ix and Iy were calculated by hand by simplifying cross sections into rectangular and triangular sections and using Eq. 5 and Eq. 6. However, once a strut was modeled in Creo the X-Section Mass Properties tool provides much more accurate results which were used instead. ¯X = ¯xiAi Ai (4) Ix = 1 12 bh3 + Ad2 [rectangular sections], Ix = 1 36 bh3 + Ad2 [triangular sections] (5) Iy = 1 12 b3 h + Ad2 [rectangular sections], Iy = 1 36 b3 h + Ad2 [triangular sections] (6) The critical points on the strut that are most likely to fail must be identified and stresses calculated. Since Ix is significantly smaller than Iy and the lift force L is larger than drag D, bending cause by the lift force dominates the structure. Therefore, the front corner of the strut where the support is welded to the base, where both Mx and My pull in tension, marks the critical point for stress analysis. At this point, stresses were calculated and Distortion Energy failure criterion was applied. Normal stress, Eq. 7 , and average shear stress, Eq. 8 , are calculated first. Once these are known the equivalent von Mises stress can be found, Eq. 9. σz = P A − −Mxy Ix + Myx Iy (7) τzn = Fzn A , n = x, y (8) σ = σ2 z + 3(τ2 zx + τ2 zy) (9) 1. Assumptions It was assumed that each strut in this study is fabricated with ASTM A36 steel such that Sy=36,000 psi and Sut=58,000 psi. Also, to simplify calculations, torque caused by the lift force was neglected by having the forces act at the center of gravity of the strut cross section rather than at the quarter-chord point of the strut. Due to this simplification, stresses due to shear are underestimated. Ultimately, bending is the dominate failure mode so it was deemed acceptable to simplify calculations this way. A conservative stress 4 of 63 American Institute of Aeronautics and Astronautics
- 5. concentration factor, K=2.0, was assumed to account for the welded fillet where the structural support is joined to the base plate. The factors of safety can then be calculated and documented, Eq. 10 and Eq. 11. ny = Sy Kσ (10) nut = Sut Kσ (11) D. Fastener Stress Analysis A main concern attributed to having a microphone strut placed in the test section is not that the strut itself will fail under load, but rather the fasteners will fail. Therefore, a stress analysis on the bolts used to hold struts in place during a test must also be conducted. Bolt failure modes include tension, threads stripping in shear, and direct shear. It is assumed in this study that all bolts are of SAE Grade 8 such that Sy=130,000 psi and Sut=150,000 psi. To begin analyzing bolts failing under tension, the maximum tensile force must be calculated. Since its assumed the forces and moments applied to the bolts are uniformly distributed, some bolts experience greater tensile forces due to greater distances from the pivot lines of moments. For struts with a rectangular base and bolt pattern, the bolt under greatest tensile strain will reside the at the front corner of the pattern. Using Eq. 12 for both Mx and My, where r is the distance [in] from a particular bolt to the pivot point, the maximum tensile force can be calculated for the critical bolt in the bolt pattern. FT1,2 = Mnri r2 i , n = x, y (12) The two tensile forces are simply added together to obtain the maximum tensile force, Eq. 13 . Once the maximum tensile force in known, the tensile stress can be calculated with Eq. 14, where At is the tensile area [in2 ] of the bolt, along with the factors of safety using Eq. 10 and Eq. 11, assuming no stress concentrations. FT = FT1 + FT2 (13) σ = FT At (14) Analyzing bolts for failure via threads stripping in shear uses the same max tensile force, FT . However, the area used for this calculation is the shear area of the threads which is given by Eq. 15, where dp is the pitch diameter [in] of the bolt and l is the engagement length [in] of the thread. It is assumed in this study that l=1.5d as per standard design practice. The thread-stripping shear stress is given by Eq. 16. The factors of safety are then calculated using Eq. 17 and Eq. 18 As = 1 2 πdpl (15) τs = FT As (16) nsy = Ssy τs = 0.577Sy τs (17) nsu = Ssu τs = 0.577Sut τs (18) Analyzing bolts in direct shear begins with calculating the primary and secondary shear forces in each bolt. The primary shear, F , is given by Eq. 19 and is the evenly distributed shear force, over n number of bolts, caused by the lift and drag forces. The secondary shear, F , is given by Eq. 20 , where Mv is the moment caused by the lift force placed at some distance [in], d, away from the centroid of the bolt pattern. The critical bolt in direct shear is located by finding where both x and y components of F and F add together. Once the total shear force is calculated for the critical bolt, Eq. 21, the shear stress and factors of safety are calculated for the load case, Eq. 22, Eq. 17 and Eq. 18. Initially, this failure mode was included in analyses, 5 of 63 American Institute of Aeronautics and Astronautics
- 6. but with factors of safety regularly greater than 50 it was deemed negligible. The shear forces inherent in these cases are simply too low for SAE Grade 8 bolts to be of great effect. F = V n = √ L2 + D2 n (19) F = Mvri r2 i , where Mv = Ld (20) Fv = F + F (21) τs = Fv A (22) E. Creo Modeling and Simulation Physical measurements that were taken of the exterior of each strut were used to create models in Creo Parametric. However, difficulties were encountered when trying to ascertain measurements of the interior support structure of several struts. Since all struts feature cladding or a cover of some kind which hides the structural support, estimations were made about what the interior support actually was. Things like wall thicknesses, lengths of structural components, etc. were estimates based on whatever evidence was visible from the exterior of the strut. Therefore, it is possible that some strut CAD models are not true to the real struts in every detail. The models made in CAD only represent the interior support structure and do not include the cladding and aerodynamic coverings. It is assumed in this study that those features do not carry any physical load and so they are neglected for stress simulations. Figure 4: Creo model of strut N10347-Short Figure 5: Creo model of strut N10479 6 of 63 American Institute of Aeronautics and Astronautics
- 7. Once a strut is modeled in Creo Parametric it is opened in Creo Simulate. All simulations were arranged in the same manner. A custom ASTM A36 material module was created and applied to the strut. The base plate bottom surface was constrained in the vertical (y) direction while the hole features in the base plate were constrained in the horizontal plane (x, z). The lift force was applied to the side surfaces of the support structure as a uniform pressure. The drag force was applied in a similar manner on the front-facing surfaces. The default mesh generation in Creo Simulate features very large tetrahedron element sizes and so refinements were made only around the critical points to reduce unnecessary solve time yet maintain accuracy in results. Fillets, usually r=0.25 in., were also added around edges to remove any singularity stresses that could occur at geometric junctions near critical points. Three results are reviewed from simulations; von Mises stress, displacement, and maximum principal stress vectors. The first thing to inspect is that the critical point for stress chosen in the stress analysis is at the same location of greatest stress in the simulation results. If they agree, the factor of safety is calculated from the simulation results and compared to the stress analysis results. If they agree within a reasonable margin then a recommended wind speed cap can be confidently assigned and documented for the strut. Figure 6: Creo Simulate results for strut N10347, von Mises stress [ksi] (left), displacement [in] (center), and maximum principal stress vectors [ksi] (right) III. Results Not all struts could be completely studied within the allotted time frame. Listed below in Appendix D and Table 1 is the final matrix which outlines each strut and the progress made during this summer. Struts that were not measured held a lower priority compared to others. These struts were skipped for several reasons; they could have shown poor condition or were too large and required assembly. Some struts were measured and modeled in Creo but were not analyzed due to complications. For example, strut N10379 featured an airfoil too dissimilar to the NACA 00XX series to approximate and an XFLR5 analysis did not yield successful results. Without a reasonable Cl, a reliable analysis could not be carried out on this struts. Struts that were fully analyzed showed a range of maximum allowable wind speeds, from 135 knots up to the maximum 300 knots the 40-by-80 Foot Wind Tunnel can produce. Therefore, there should be a strut that meets the requirements for the upcoming TTR acoustic test, specifically strut N10416 appears to be a strong candidate. ∗Written Analysis suggests qmax=70 psf and Vmax=160 knots, Creo suggests qmax=50 psf and Vmax=135 knots †Tall variant (height=69 in): Written Analysis suggests qmax=200 psf and Vmax=265 knots, Creo suggests qmax=230 psf and Vmax=275 knots ‡Written Analysis suggests qmax=130 psf and Vmax=215 knots, Creo suggests qmax=195 psf and Vmax=260 knots 7 of 63 American Institute of Aeronautics and Astronautics
- 8. Table 1: NFAC Microphone Strut Catalog Strut ID Number Quantity Location Measured Modeled Analyzed qmax [psf] Vmax [knots] 10027 1 80’x120’ NE Inlet-Outside No No No N/A N/A 10028 1 80’x120’ NE Inlet-Outside No No No N/A N/A 10051 3 40’x80’ High Bay Yes Yes Yes 50 135∗ 10098 1 80’x120’ 2nd Floor Mezzanine No No No N/A N/A 10191 1 Golden Triangle-Rack 9A No No No N/A N/A 10347 3 N221 W. Warehouse-E1 Yes Yes Yes 262 300† 10370 1 Golden Triangle No No No N/A N/A 10379 1 40’x80’ High Bay Yes Yes No N/A N/A 10416 2 N221 W. Warehouse-F1 Yes Yes Yes 262 300 10479 7 N221 W. Warehouse-E1 Yes Yes Yes 130 215‡ IV. Future Work While a majority of the microphone struts currently available for testing were modeled and analyzed, some remain untouched and future work is required to ready them for operation. For struts that show considerable deterioration of acoustic and aerodynamic cladding, perhaps a fresh analysis will reinvigorate their refurbishment effort. The analyses done in this study were of static loads only and so it may also be beneficial to investigate the dynamic response of these struts to characterize their vibratory characteristics as well, especially for tall struts with high aspect ratios. Not previously mentioned is that some struts are fully analyzed and are structurally ready for testing, yet they lack the necessary tube attachment that houses the microphone itself. Without these attachments the struts themselves are useless and can’t be used for acoustic testing. An inventory should be made of all the microphone tube attachments currently available and fabrication plans made to construct housings for struts that need them. In addition to these tasks, future work should also include re-examining the assumptions made in these analyses and prior analyses as well. This may involve utilizing a better method of determining the aerody- namic characteristics of each strut. Using laser scans to accurately record the airfoil of each strut for analysis in XFLR5 could be a worthwhile approach to remove the overabundance of conservative assumptions in this study. Or perhaps experimentally recording Cl and Cd for each strut offers a more satisfactory result. One final suggestion is that machine shop personnel and machinists are asked to confirm or check the assumptions made regarding the interior structural support geometries. An error in any of these areas could greatly affect the accuracy of the analysis. V. Conclusion A great deal of progress was made this summer towards finally analyzing and cataloging the microphone struts available for use in the NFAC. Now a majority of struts can be used with relative peace of mind for acoustics research without the fear of the structure failing and possibly damaging either the tunnel or test rigs. There remains more work ahead, but hopefully in the coming months the needs of the project can be met and used to pursue greater scientific endeavors. Acknowledgments The author would like to thank Ms. Miranda McCoy for her guidance throughout the summer while overseeing this project. Jarvis Gross was instrumental in getting this work started in the NFAC warehouses. Jose Navarrete and Effie Greene were also of great help finding struts and reviewing analyses. And a final thanks to Dr. Bill Warmbrodt for his unbridled enthusiasm and wisdom. How cool is that? References 1National Full-Scale Aerodynamics Complex Operations Manual-Part IV-Appendix C, Moffett Field, CA: NASA, 1989. 8 of 63 American Institute of Aeronautics and Astronautics
- 9. Appendix A: Hand Calculations Figure 7: N10347-Short Written Analysis-Page 1 9 of 63 American Institute of Aeronautics and Astronautics
- 10. Figure 8: N10347-Short Written Analysis-Page 2 10 of 63 American Institute of Aeronautics and Astronautics
- 11. Figure 9: N10347-Short Written Analysis-Page 3 11 of 63 American Institute of Aeronautics and Astronautics
- 12. Figure 10: N10347-Short Written Analysis-Page 4 12 of 63 American Institute of Aeronautics and Astronautics
- 13. Figure 11: N10347-Short Written Analysis-Page 5 13 of 63 American Institute of Aeronautics and Astronautics
- 14. Figure 12: N10347-Tall Written Analysis-Page 1 14 of 63 American Institute of Aeronautics and Astronautics
- 15. Figure 13: N10347-Tall Written Analysis-Page 2 15 of 63 American Institute of Aeronautics and Astronautics
- 16. Figure 14: N10347-Tall Written Analysis-Page 3 16 of 63 American Institute of Aeronautics and Astronautics
- 17. Figure 15: N10347-Tall Written Analysis-Page 4 17 of 63 American Institute of Aeronautics and Astronautics
- 18. Figure 16: N10347-Tall Written Analysis-Page 5 18 of 63 American Institute of Aeronautics and Astronautics
- 19. Figure 17: N10479 Written Analysis-Page 1 19 of 63 American Institute of Aeronautics and Astronautics
- 20. Figure 18: N10479 Written Analysis-Page 2 20 of 63 American Institute of Aeronautics and Astronautics
- 21. Figure 19: N10479 Written Analysis-Page 3 21 of 63 American Institute of Aeronautics and Astronautics
- 22. Figure 20: N10479 Written Analysis-Page 4 22 of 63 American Institute of Aeronautics and Astronautics
- 23. Figure 21: N10479 Written Analysis-Page 5 23 of 63 American Institute of Aeronautics and Astronautics
- 24. Figure 22: N10416 Written Analysis-Page 1 24 of 63 American Institute of Aeronautics and Astronautics
- 25. Figure 23: N10416 Written Analysis-Page 2 25 of 63 American Institute of Aeronautics and Astronautics
- 26. Figure 24: N10416 Written Analysis-Page 3 26 of 63 American Institute of Aeronautics and Astronautics
- 27. Figure 25: N10416 Written Analysis-Page 4 27 of 63 American Institute of Aeronautics and Astronautics
- 28. Figure 26: N10416 Written Analysis-Page 5 28 of 63 American Institute of Aeronautics and Astronautics
- 29. Figure 27: N10416 Written Analysis-Page 6 29 of 63 American Institute of Aeronautics and Astronautics
- 30. Figure 28: N10051 Written Analysis-Page 1 30 of 63 American Institute of Aeronautics and Astronautics
- 31. Figure 29: N10051 Written Analysis-Page 2 31 of 63 American Institute of Aeronautics and Astronautics
- 32. Figure 30: N10051 Written Analysis-Page 3 32 of 63 American Institute of Aeronautics and Astronautics
- 33. Figure 31: N10051 Written Analysis-Page 4 33 of 63 American Institute of Aeronautics and Astronautics
- 34. Figure 32: N10051 Written Analysis-Page 5 34 of 63 American Institute of Aeronautics and Astronautics
- 35. Figure 33: N10051 Written Analysis-Page 6 35 of 63 American Institute of Aeronautics and Astronautics
- 36. Figure 34: N10051 Written Analysis-Page 7 36 of 63 American Institute of Aeronautics and Astronautics
- 37. Figure 35: N10051 Written Analysis-Page 8 37 of 63 American Institute of Aeronautics and Astronautics
- 38. AppendixB:ExcelStressAnalysisSpreadsheets Figure36:N10347-ShortExcelAnalysis-Page1 38 of 63 American Institute of Aeronautics and Astronautics
- 39. Figure37:N10347-ShortExcelAnalysis-Page2 39 of 63 American Institute of Aeronautics and Astronautics
- 40. Figure38:N10347-ShortExcelAnalysis-Page3 40 of 63 American Institute of Aeronautics and Astronautics
- 41. Figure39:N10347-TallExcelAnalysis-Page1 41 of 63 American Institute of Aeronautics and Astronautics
- 42. Figure40:N10347-TallExcelAnalysis-Page2 42 of 63 American Institute of Aeronautics and Astronautics
- 43. Figure41:N10347-TallExcelAnalysis-Page3 43 of 63 American Institute of Aeronautics and Astronautics
- 44. Figure42:N10479ExcelAnalysis-Page1 44 of 63 American Institute of Aeronautics and Astronautics
- 45. Figure43:N10479ExcelAnalysis-Page2 45 of 63 American Institute of Aeronautics and Astronautics
- 46. Figure44:N10479ExcelAnalysis-Page3 46 of 63 American Institute of Aeronautics and Astronautics
- 47. Figure45:N10416ExcelAnalysis-Page1 47 of 63 American Institute of Aeronautics and Astronautics
- 48. Figure46:N10416ExcelAnalysis-Page2 48 of 63 American Institute of Aeronautics and Astronautics
- 49. Figure47:N10416ExcelAnalysis-Page3 49 of 63 American Institute of Aeronautics and Astronautics
- 50. Figure48:N10051ExcelAnalysis-Page1 50 of 63 American Institute of Aeronautics and Astronautics
- 51. Figure49:N10051ExcelAnalysis-Page2 51 of 63 American Institute of Aeronautics and Astronautics
- 52. Figure50:N10051ExcelAnalysis-Page3 52 of 63 American Institute of Aeronautics and Astronautics
- 53. Figure51:N10051ExcelAnalysis-Page4 53 of 63 American Institute of Aeronautics and Astronautics
- 54. Figure52:N10051ExcelAnalysis-Page5 54 of 63 American Institute of Aeronautics and Astronautics
- 55. AppendixC:CreoSimulationResults Figure53:N10347-Short,q=262psf(V=300knots)=⇒ny=4.12,nut=6.64 55 of 63 American Institute of Aeronautics and Astronautics
- 56. Figure54:N10347-Tall,q=200psf(V=265knots)=⇒ny=2.71,nut=4.36 56 of 63 American Institute of Aeronautics and Astronautics
- 57. Figure55:N10347-Tall,q=230psf(V=278knots)=⇒ny=2.46,nut=3.96 57 of 63 American Institute of Aeronautics and Astronautics
- 58. Figure56:N10479,q=100psf(V=191knots)=⇒ny=4.79,nut=7.71 58 of 63 American Institute of Aeronautics and Astronautics
- 59. Figure57:N10479,q=130psf(V=216knots)=⇒ny=3.68,nut=5.93 59 of 63 American Institute of Aeronautics and Astronautics
- 60. Figure58:N10479,q=195psf(V=262knots)=⇒ny=2.46,nut=3.96 60 of 63 American Institute of Aeronautics and Astronautics
- 61. Figure59:N10416,q=262psf(V=300knots)=⇒ny=3.21,nut=5.18 61 of 63 American Institute of Aeronautics and Astronautics
- 62. Figure60:N10051,q=50psf(V=135knots)=⇒ny=2.52,nut=4.06 62 of 63 American Institute of Aeronautics and Astronautics