Empfohlen

Empfohlen
Weitere ähnliche Inhalte
Kürzlich hochgeladen
Kürzlich hochgeladen (20)
Empfohlen
Empfohlen (20)
The effect of grazing intensity on the grasslands and cattle performance v8
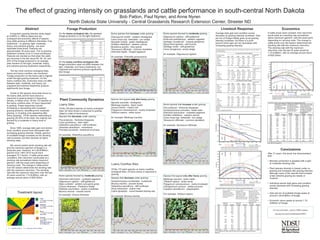
- 1. The effect of grazing intensity on grasslands and cattle performance in south-central North Dakota Bob Patton, Paul Nyren, and Anne Nyren North Dakota State University - Central Grasslands Research Extension Center, Streeter ND Abstract Forage Production Livestock Response Economics A long-term grazing intensity study began On the loamy ecological site, the greatest Some species that increase under grazing: Some species favored by moderate grazing: Average daily gain and condition scores If cattle prices were constant, then return/ton at CGREC in 1989 to determine the forage production is on the light treatment. decrease as grazing intensity increases. Gain would peak at a stocking rate somewhere Pascopyrum smithii - western wheatgrass Oligoneuron rigidum - stiff goldenrod below maximum gain/ton, with the exact point ecological and economic effects of season- per ton of forage initially goes up as grazing Average above ground biomass production by grazing treatment on loamy ecological sites from 1992 to 2010. Carex inops ssp. heliophila - sun sedge Ambrosia psilostachya - western ragweed depending on carrying costs. The change in long cattle grazing at different intensities. Five Above ground biomass (lbs/acre) intensity increases, but there is a point Beginning Middle of Peak End of Nassella viridula - green needlegrass Solidago canadensis - Canada goldenrod cattle prices over the season determines the treatments - no grazing, light, moderate, Treatment of season season yield season beyond which gain per ton decreases with Achillea millefolium - western yarrow Glycyrrhiza lepidota - wild licorice stocking rate with the maximum return/ton. heavy, and extreme grazing - are each Ungrazed 1,253 b1 2,448 b 2,728 c 2,592 c increasing grazing intensity. Light 1,314 a 2,765 a 3,168 a 3,071 a Bouteloua gracilis - blue grama Solidago mollis - soft goldenrod The stocking rate with the maximum replicated three times. Pastures are Taraxacum officinale - common dandelion Carex lanuginosa - wooly sedge Average daily gains, gains per acre, gains per ton of forage and condition scores from different approximately 30 acres each. The no grazing Moderate 1,178 c 2,535 b 2,941 b 2,844 b stocking intensities. return/ton over the last 20 years would be Heavy 901 d 2,148 c 2,421 d 2,339 d Artemisia frigida - fringed sagewort 1.74 AUM/ton, with an average annual return treatment consists of six 0.3-acre exclosures. Extreme 732 e 1,821 d 2,189 e 2,150 d An example: Oligoneuron rigidum Average Daily Gains (lbs./head/day) Pastures are stocked so that when the cattle LSD (0.05) 59 142 183 196 Desired Grazing Average 1991- of $28.24/ton. 1 An example: Potentilla pensylvanica Intensity 2006 2007 2008 2009 2010 2010 are removed in the fall, about 65, 50, 35, and Means in the same column followed by the same letter are not significantly different at P=0.05. 30 500 Light 0.57 1.36 1.75a1 2.05a 1.54 1.39a Moderate 0.62 1.22 1.58ab 1.99a 1.29 1.28a 20% of the forage produced in an average On the loamy overflow ecological site, Heavy 0.48 1.33 1.35b 1.48b 1.09 1.10b 140 year remains on the light, moderate, heavy, forage production does not differ between the E M Extreme 0.13 1.16 0.95c 1.09b 1.02 0.80c 120 2007 LSD (0.05) NS2 NS 0.38 0.42 NS 0.14 Percent frequency of occurrence in 25 X 25 cm frames M and extreme grazing treatments respectively. light, moderate, and heavy treatments, but 400 Average Gain (lbs./acre) 100 Average 1991- ungrazed and extreme produce significantly 20 H 2006 2007 2008 2009 2010 2010 80 The two most common ecological sites, less forage. E E 300 Light 11.01 44.41c 39.73b 47.37b 47.58 30.02c 60 up pe rc .i. 20 of loamy and loamy overflow, are monitored. H 2008 06 20 Plants/M2 Moderate 20.82 69.27bc 68.61ab 90.63a 68.95 55.19b 40 Dollars/Ton -yr Average above ground biomass production by grazing treatment on loamy overflow ecological sites from 1993 to 2010. 20-yr. a .a ve. ve Forage production on the loamy site is highest Above ground biomass (lbs/acre) E E H E E Heavy Extreme 20.77 7.48 107.47ab 122.96a 82.15a 76.10a 92.72a 90.79a 84.55 104.70 76.45a 81.42a 20 . H E E under the light grazing treatment. On the Treatment Beginning of season Middle of season Peak yield End of season 10 H H H E E H 200 H LSD (0.05) NS 42.67 29.04 34.31 NS 10.30 0 200 9 loamy overflow site, production does not differ Ungrazed 1,002 b 1 3,205 c 3,350 b 2,928 b E E E E U H M E E Average Gain (lbs./ton of forage) Average 1991- -20 low M E H L er between light, moderate, and heavy, but Light 1,156 a 3,890 a 4,173 a 3,936 a H H H E H H H M H M 100 H L M M H H E H M 2006 2007 2008 2009 2010 2010 -40 c.i .o f2 Moderate 1,230 a 3,666 ab 4,116 a 3,994 a E E E E -60 E M M M M H Light 9.83 23.19c 27.11c 33.80b 19.01c 19.53d ungrazed and extreme treatments produce 0- Moderate Optimum H 20 E L Extreme M L L E H E M M M yr. L Heavy H H M 10 M Light