

Empfohlen
Empfohlen
Weitere ähnliche Inhalte
Andere mochten auch
Andere mochten auch (8)
Ähnlich wie Photoacoustic Imaging Design
Ähnlich wie Photoacoustic Imaging Design (20)
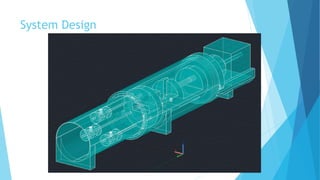
Photoacoustic Imaging Design
- 3. Motion of motor shaft String tied around motor shaft and allowed to hang vertically; distance from base of shaft measured Voltage varied and motor instructed to make one turn; distance of string from base of shaft measured One sample t-test with 5% significance level confirmed null hypothesis that data above threshold comes from normal distribution with mean equal to expected distance traveled of 29.6 mm (p = 0.3608)
- 4. Motion of Lens-Transducer system One sample t-test Forward Backward Mean significantly different from 2 mm (α = 0.05) No No P-value 0.2630 0.2194 When compared against each other with a two-sample t-test, the data from the ‘forward’ and ‘backward’ groups were found to be statistically equivalent (α = 0.05, p = 1.0000)
- 5. Effect of mass on deflection of central axis Customer requires maximum deviation of object from central axis of lens- transducer system be less than 1 mm Angular conversion gives limit of 0.3° Depending on where center of gravity of lens-transducer system is (likely between middle and end of shaft) its weight would cause unacceptable deviation We added a track to guide motion and prevent deflection (downside – more force for motor to work against)
- 6. Alignment of motion system Image printed and attached to front end of probe (lens) Device instructed to move by 2 mm intervals and camera used to take pictures at each interval (4 trials, 6 images each) Pictures overlaid on each other and certain points (red dots) tracked Deviation of center dot used to determine angular deviation of central axis, and from that deviation (in mm) at object
- 7. Alignment of motion system Trial 1 Trial 2 Trial 3 Trial 4 h0: m = 0 ha: m ≠ 0 h0 ha ha ha p-value 0.0514 0.0085 0.0185 0.0292 h0: m = 1 ha: m < 1 h0 h0 h0 h0 p-value 0.8877 0.9458 0.9336 0.8377 One-way ANOVA revealed all groups are statistically equivalent (α = 0.05, p = 0.8978) One sample t-tests showed that only trial 1 had a mean deviation statistically equivalent to 0 mm One sample t-tests showed that no group had a mean deviation significantly less than 1 mm Majority of data below 1 mm line; 3D-print for more accuracy
- 8. Future Changes to Design Change lens mounts to a singular piece for consistent attachment and alignment of lenses to the probe body Cap is divided into two pieces to allow the transducer wire to pass through and seal the system