Santander registered attributable net profit of EUR 1.704 billion (-51%), after covering 70% of real estate provisions required by the latest Spanish regulations
•
0 gefällt mir•838 views

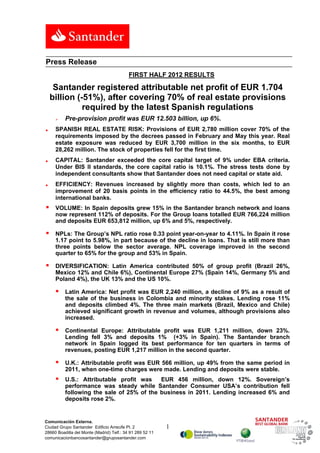
FIRST HALF 2012 RESULTS Santander registered attributable net profit of EUR 1.704 billion (-51%), after covering 70% of real estate provisions required by the latest Spanish regulations Pre-provision profit was EUR 12.503 billion, up 6%.

Empfohlen
Empfohlen
Weitere ähnliche Inhalte
Was ist angesagt?
Was ist angesagt? (8)
Andere mochten auch
Andere mochten auch (20)
Ähnlich wie Santander registered attributable net profit of EUR 1.704 billion (-51%), after covering 70% of real estate provisions required by the latest Spanish regulations
Ähnlich wie Santander registered attributable net profit of EUR 1.704 billion (-51%), after covering 70% of real estate provisions required by the latest Spanish regulations (20)
Mehr von BANCO SANTANDER
Mehr von BANCO SANTANDER (20)
Kürzlich hochgeladen
Kürzlich hochgeladen (20)
Santander registered attributable net profit of EUR 1.704 billion (-51%), after covering 70% of real estate provisions required by the latest Spanish regulations
- 1. Press Release FIRST HALF 2012 RESULTS Santander registered attributable net profit of EUR 1.704 billion (-51%), after covering 70% of real estate provisions required by the latest Spanish regulations Pre-provision profit was EUR 12.503 billion, up 6%. ■ SPANISH REAL ESTATE RISK: Provisions of EUR 2,780 million cover 70% of the requirements imposed by the decrees passed in February and May this year. Real estate exposure was reduced by EUR 3,700 million in the six months, to EUR 28,262 million. The stock of properties fell for the first time. ■ CAPITAL: Santander exceeded the core capital target of 9% under EBA criteria. Under BIS II standards, the core capital ratio is 10.1%. The stress tests done by independent consultants show that Santander does not need capital or state aid. ■ EFFICIENCY: Revenues increased by slightly more than costs, which led to an improvement of 20 basis points in the efficiency ratio to 44.5%, the best among international banks. VOLUME: In Spain deposits grew 15% in the Santander branch network and loans now represent 112% of deposits. For the Group loans totalled EUR 766,224 million and deposits EUR 653,812 million, up 6% and 5%, respectively. NPLs: The Group’s NPL ratio rose 0.33 point year-on-year to 4.11%. In Spain it rose 1.17 point to 5.98%, in part because of the decline in loans. That is still more than three points below the sector average. NPL coverage improved in the second quarter to 65% for the group and 53% in Spain. DIVERSIFICATION: Latin America contributed 50% of group profit (Brazil 26%, Mexico 12% and Chile 6%), Continental Europe 27% (Spain 14%, Germany 5% and Poland 4%), the UK 13% and the US 10%. Latin America: Net profit was EUR 2,240 million, a decline of 9% as a result of the sale of the business in Colombia and minority stakes. Lending rose 11% and deposits climbed 4%. The three main markets (Brazil, Mexico and Chile) achieved significant growth in revenue and volumes, although provisions also increased. Continental Europe: Attributable profit was EUR 1,211 million, down 23%. Lending fell 3% and deposits 1% (+3% in Spain). The Santander branch network in Spain logged its best performance for ten quarters in terms of revenues, posting EUR 1,217 million in the second quarter. U.K.: Attributable profit was EUR 566 million, up 49% from the same period in 2011, when one-time charges were made. Lending and deposits were stable. U.S.: Attributable profit was EUR 456 million, down 12%. Sovereign’s performance was steady while Santander Consumer USA’s contribution fell following the sale of 25% of the business in 2011. Lending increased 6% and deposits rose 2%. Comunicación Externa. Ciudad Grupo Santander Edificio Arrecife Pl. 2 1 28660 Boadilla del Monte (Madrid) Telf.: 34 91 289 52 11 comunicacionbancosantander@gruposantander.com
- 2. Madrid, July 26, 2012 - Banco Santander registered net attributable profit of EUR 1,704 million in the first half of the year, a fall of 51% compared with the same period last year. The decline is a result of setting aside EUR 1,304 million for provisions for real estate exposure in Spain of the second quarter ordinary profit of EUR 1,404 million. That resulted in an accounting profit of just EUR 100 million for the quarter. Banco Santander Chairman Emilio Botín said: “The first half results make us one of the most solid and efficient banks in the world and show we are able to increase revenues and keep costs under control even in a difficult environment. The provisions we are making will allow us to put real estate write-offs in Spain behind us by the end of this year.” Results In the first half of 2012, Banco Santander’s group revenues rose 5.3% to EUR 22,544 million and absorbed costs of EUR 10,041 million, up 5.1% compared with the same period last year. Latin America and Continental Europe produced strong revenue growth and the performance in Spain stood out. The Santander branch network achieved revenues of EUR 1,217 million between April and June, the highest figure of the last ten quarters. The difference between revenues and costs produced net operating income of EUR 12,503 million, 5.5% more than the same period last year and 10.2% more than the second half of 2011. The performance of revenues and costs resulted in an improvement of 20 basis points in the efficiency ratio to 44.5%, which makes Santander the most efficient international bank in the world. Pre-provision profit of EUR 12,503 million (EUR 25,000 million in annualised terms) shows Santander’s capacity to generate earnings and make provisions when the economic situation requires. EUR 6,540 million (+42%) was allocated to provisions for non-performing loans and a further EUR 1,896 million (EUR 1,304 million in net terms) was assigned to cover real estate exposure in Spain. The bank also assigned EUR 884 million from the sale of the Colombian business to real estate provisions. The NPL coverage ratio rose for the second quarter running, both for the group and the Spanish business, whose coverage ratios were 65% and 53%, respectively. H1 2012 Highlights 1 2 Solid Effort in real estate profit generation provisions in Spain Pre-provision profit: In Q2 2012: EUR 2,780 mln EUR 12,503 mln: +6% Reached > 70% decreed 3 4 Meeting Liquidity: capital requirements Focus on deposits in Spain LTD Group* <120% EBA >9% Commercial Gap Spain: Core Capital (BIS II) >10% -EUR 10 bln in H1 2012 H1 2012 recurring attributable profit: EUR 3,008 mln Attributable profit after provisions: EUR 1,704 mln (*) Loan-to-deposit ratio Comunicación Externa. Ciudad Grupo Santander Edificio Arrecife Pl. 2 2 28660 Boadilla del Monte (Madrid) Telf.: 34 91 289 52 11 comunicacionbancosantander@gruposantander.com
- 3. Without these extraordinary write-offs, ordinary attributable profit (before capital gains) would have been EUR 3,008 million, a fall of 14%. Broad geographic diversification in profit generation Attributable profit by geographic segment in H1 2012(1) Portugal: 2% Poland: 4% Spain: 14% Germany: 5% Brazil: 26% Other Europe: 2% UK: 13% Mexico: 12% US: 10% Other LatAm: Chile: 6% 6% (1) Over operating areas attributable profit Banco Santander’s diversification is the main reason group results have held up so well against such a difficult backdrop in Europe, where it carries out a large part of its business. Latin America contributes 50% of profits – Brazil makes up 26%, Mexico 12% and Chile 6%. Continental Europe accounts for 27%, of which Spain represents 14%, Germany 5% and Poland 4%, while the U.K. brings in 13% and the U.S. 10%. Business Growth in lending in emerging market units in Latin America and Poland was strong. Lending fell in deleveraging markets, such as Spain and Portugal, while deposits rose. Group outstanding loans came to EUR 766,224 million, or 117% of deposits of EUR 653,812 million, compared with 150% in December, 2008. In Spain, the loan-to-deposit ratio was 112%, with EUR 208,000 million in loans and EUR 187,000 million in deposits, down from 178% at the close of 2008. Banco Santander continued to enjoy access to wholesale funding markets, placing EUR 26,000 million in issues and securitizations in the market. The bank’s strong liquidity position, even in a period of stress, means it does not need to issue debt in 2012 to meet financing needs in Spain and Portugal. Customer funds under group management were one trillion euros at the close of June. Deposits increased by 6%, including EUR 9,803 million in commercial paper placed by the branch network in Spain and letters of credit in Brazil. The highest growth in deposits was registered in Mexico, with 19%, followed by Chile, with 15%, Poland, with 9%, Portugal, 7% and Brazil, 6%. In Spain, the Santander branch network increased deposits by 15%, gaining 0.7 point in market share. . Comunicación Externa. Ciudad Grupo Santander Edificio Arrecife Pl. 2 3 28660 Boadilla del Monte (Madrid) Telf.: 34 91 289 52 11 comunicacionbancosantander@gruposantander.com
- 4. Customer loans Customer funds under management Customer funds under management: June 2012 Customer loans: June 2012 (% o/ operating areas) (% o/ operating areas) USA: 4% Other Latin América: 4% USA: 6% Other Latin América: 2% Chile: 4% Chile: 4% Mexico: 4% Spain: 27% Mexico: 3% Spain: 28% Brazil: 10% Brazil: 14% Portugal: 3% Germany: 4% Portugal: 4% Poland: 1% Germany: 4% United Kingdom: Other Europe: 1% United Kingdom: Poland: 2% 35% 34% Other Europe: 2% Outstanding net loans were EUR 766,224 million at the end of 2012, up by nearly 6% from a year earlier. Lending increased by 18% in Brazil, 15% in Mexico, 6% in Chile, 13% in Poland and 6% in the U.S. Lending fell by 7% in Portugal, by 4% in Spain and was flat in the U.K. In Spain, the decline of 20% on the year in loans for real estate purposes was noteworthy. The non-performing loan rate was below the average for the sector in all the Group’s major markets. The Group non-performing loan ratio rose 0.33 percentage point from a year earlier to 4.11%, an increase of 0.13 point during the quarter. In Spain, NPLs were 5.98%, up 1.17 point year-on-year, affected by the decline in lending. In the U.K., NPLs were broadly unchanged at 1.83%. NPLs in Santander Consumer Finance fell by about one percentage point from a year earlier to 3.88%. In the U.S., the quarter-to- quarter decline continued, with NPLs at 2.27%. In Latin America, bad loans increased by about one percentage point in Brazil and Chile and about 80 basis points in Mexico. In all the Group’s markets, the NPLs were below the average for the sector, especially in Spain, where the industry’s rate is nearly three percentage points above Santander’s. Real estate risk in Spain Banco Santander stepped up its reduction of real estate risk during the first half of the year and, at the same time, increased its provisions for potential losses in this segment in Spain. Group real estate exposure in Spain was EUR 42,500 million at the close of 2008, of which EUR 4,800 million were acquired or repossessed properties and EUR 37,700 million were loans. Three and a half years later, that exposure has been reduced by EUR 14,200 million to EUR 28,300 million, of which EUR 19,900 million are loans and EUR 8,400 million acquired properties. This process has picked up speed and this is the first six-month period in which both the stock of properties and loans declined. In February and May of 2012, two royal decrees were approved which increased provisions for real estate loans and which must be charged against this year’s results. These rules require Banco Santander to set aside an additional gross EUR 8,800 million, which is partly covered by capital. The bank had already set aside EUR 1,800 million for this purpose in its 2011 results and has provided another EUR 2,780 million in the second quarter of 2012. Comunicación Externa. Ciudad Grupo Santander Edificio Arrecife Pl. 2 4 28660 Boadilla del Monte (Madrid) Telf.: 34 91 289 52 11 comunicacionbancosantander@gruposantander.com
- 5. These provisions, plus the portion that is charged against capital, mean that Banco Santander had covered more than 70% of its requirement under the new rules at the end of the first half. That figure would rise to more than 75% taking into account the EUR 490 million obtained through the reinsurance agreement with a unit of Deutsche Bank covering life insurance policies in Spain and Portugal. Capital and the share Since the beginning of the year, Banco Santander has exceeded the European Banking Authority’s core capital requirement of 9% on June 30. Under Basel II criteria, Banco Santander’s core capital ratio was 10.1%. Banco Santander’s market capitalization was EUR 49,261 million at June 30, which made it the largest bank in the euro zone in stock market value. That is significantly less than its total equity and financial capital of EUR 81,821 million at the end of June. Shareholder remuneration to be charged against 2012 results will be EUR 0.60 a share. This will be distributed through the Santander Dividendo Elección programme (scrip dividend) which allows shareholders to choose between receiving a dividend of approximately EUR 0.15 a share in cash or shares on each of the four usual dividend payment dates. The bank had 3,275,132 shareholders at the end of the first half. The Group employed 187,251 people, serving more than 102 million customers in 14,569 branches. That makes it the biggest international financial group in terms of shareholders and branch network. More information at: www.santander.com Comunicación Externa. Ciudad Grupo Santander Edificio Arrecife Pl. 2 5 28660 Boadilla del Monte (Madrid) Telf.: 34 91 289 52 11 comunicacionbancosantander@gruposantander.com
- 6. Key consolidated data Variation H1 '12 H1 '11 Amount % 2011 Balance sheet (EUR million) Total assets 1,292,677 1,231,908 60,770 4.9 1,251,525 Net customer loans 766,224 723,969 42,254 5.8 750,100 Customer deposits 644,009 624,414 19,595 3.1 632,533 Customer funds under management 1,000,165 995,741 4,424 0.4 984,353 Shareholders' equity 80,650 77,697 2,954 3.8 80,400 Total managed funds 1,417,861 1,374,028 43,833 3.2 1,382,980 Income statement (EUR million) Net interest income 15,499 14,299 1,199 8.4 29,110 Gross income 22,544 21,403 1,141 5.3 42,754 Pre‐provision profit 12,503 11,846 657 5.5 23,195 Profit from continuing operations 3,472 3,940 (467) (11.9) 7,812 Attributable profit to the Group 1,704 3,501 (1,797) (51.3) 5,351 EPS, profitability and efficiency (%) EPS (euro) 0.18 0.40 (0.22) (54.8) 0.60 Diluted EPS (euro) 0.18 0.39 (0.21) (54.8) 0.60 ROE 4.33 9.39 7.14 ROTE 6.38 14.07 10.81 ROA 0.34 0.65 0.50 RoRWA 0.76 1.35 1.06 Efficiency ratio (with amortisations) 44.5 44.7 45.7 BIS II ratios and NPL ratios (%) Core capital 10.10 9.20 10.02 Tier I 11.01 10.43 11.01 BIS II ratio 13.50 13.10 13.56 NPL ratio 4.11 3.78 3.89 NPL coverage 65 69 61 Market capitalisation and shares Shares (1) (millions at period‐end) 9,435 8,440 995 11.8 8,909 Share price (euros) 5.221 7.963 (2.742) (34.4) 5.870 Market capitalisation (EUR million) 49,261 67,210 (17,949) (26.7) 52,296 Book value (euro) 8.18 8.73 8.59 Price / Book value (X) 0.64 0.91 0.68 P/E ratio (X) 14.61 10.08 9.75 Other data Number of shareholders 3,275,132 3,223,047 52,085 1.6 3,293,537 Number of employees 187,251 187,133 118 0.1 189,766 Continental Europe 57,837 59,197 (1,360) (2.3) 58,864 o/w: Spain 31,610 32,042 (432) (1.3) 31,889 United Kingdom 26,993 26,802 191 0.7 27,505 Latin America 90,622 89,885 737 0.8 91,913 USA 9,363 9,000 363 4.0 9,187 Corporate Activities 2,436 2,249 187 8.3 2,297 Number of branches 14,569 14,679 (110) (0.7) 14,756 Continental Europe 6,540 6,643 (103) (1.6) 6,608 o/w: Spain 4,755 4,785 (30) (0.6) 4,781 United Kingdom 1,315 1,405 (90) (6.4) 1,379 Latin America 5,991 5,908 83 1.4 6,046 USA 723 723 — — 723 Information on recurring profit Attributable profit to the Group 3,008 3,501 (493) (14.1) 7,021 EPS (euro) 0.32 0.40 (0.08) (20.2) 0.79 Diluted EPS (euro) 0.31 0.39 (0.08) (20.2) 0.78 ROE 7.64 9.39 9.37 ROTE 11.26 14.07 14.18 ROA 0.54 0.65 0.63 RoRWA 1.21 1.35 1.35 P/E ratio (X) 8.28 10.08 7.43 Note: The financial information in this report was approved by the Board of Directors at its meeting on July, 24 2012, following a favourable report from the Audit and Compliance Committee on July, 18 2012. (1) In December 2011, includes shares issued to cover the exchange of preferred shares of December 2011 Comunicación Externa. Ciudad Grupo Santander Edificio Arrecife Pl. 2 6 28660 Boadilla del Monte (Madrid) Telf.: 34 91 289 52 11 comunicacionbancosantander@gruposantander.com
- 7. Key data by principal segments Net operating income Attributable profit to the Group Efficiency ratio (%) ROE (%) H1 '12 H1 '11 Var (%) H1 '12 H1 '11 Var (%) H1 '12 H1 '11 H1 '12 H1 '11 Income statement (EUR million) Continental Europe 3,998 3,762 6.3 1,211 1,578 (23.3) 44.0 44.9 7.71 10.73 o/w: Santander Branch Network 1,314 1,227 7.1 247 500 (50.6) 43.8 45.5 7.62 14.30 Banesto 653 597 9.4 82 168 (50.8) 43.5 46.0 3.44 7.16 Portugal 333 262 27.0 71 131 (46.1) 43.0 49.9 5.52 10.72 Santander Consumer Finance 919 992 (7.4) 382 369 3.6 42.3 39.0 7.08 7.91 Retail Poland (BZ WBK) 253 134 87.8 157 94 67.1 45.2 45.8 18.31 27.69 United Kingdom 1,307 1,750 (25.3) 566 381 48.6 51.2 42.6 8.61 6.02 Latin America 7,755 6,831 13.5 2,240 2,457 (8.8) 36.6 38.5 19.47 22.17 o/w: Brazil 5,684 4,969 14.4 1,152 1,381 (16.6) 34.0 36.7 18.17 23.73 Mexico 826 758 8.9 556 486 14.4 37.5 38.1 25.66 21.26 Chile 692 665 4.1 260 349 (25.5) 39.0 37.0 21.98 27.04 USA 770 905 (15.0) 456 517 (11.8) 42.6 34.2 17.75 26.33 Operating areas 13,829 13,248 4.4 4,474 4,934 (9.3) 40.9 40.7 12.30 14.48 Corporate Activities* (1,326) (1,402) (5.4) (1,466) (1,433) 2.3 Total Group* 12,503 11,846 5.5 3,008 3,501 (14.1) 44.5 44.7 7.64 9.39 Extraordinary net capital gains and provisions (1,304) — — Total Group 1,704 3,501 (51.3) 44.5 44.7 4.33 9.39 (*).‐ Excluding extraordinary net capital gains and provisions Net customer loans Customer deposits NPL ratio (%) * NPL coverage (%) * 30.06.12 30.06.11 Var (%) 30.06.12 30.06.11 Var (%) 30.06.12 30.06.11 30.06.12 30.06.11 Activity (EUR million) Continental Europe 302,519 312,420 (3.2) 247,172 259,448 (4.7) 5.68 4.76 60 61 o/w: Santander Branch Network * 102,163 107,312 (4.8) 84,679 80,037 5.8 9.16 6.73 49 47 Banesto 64,571 71,825 (10.1) 49,992 54,047 (7.5) 5.27 4.54 54 52 Portugal 27,289 29,212 (6.6) 23,772 22,228 6.9 5.42 3.25 53 62 Santander Consumer Finance 56,834 57,052 (0.4) 32,702 32,658 0.1 3.88 4.74 111 103 Retail Poland (BZ WBK) 9,191 8,659 6.1 10,463 10,217 2.4 4.93 6.43 62 67 United Kingdom 275,780 225,599 22.2 211,192 182,338 15.8 1.83 1.81 40 43 Latin America 141,115 132,095 6.8 136,183 138,596 (1.7) 5.14 4.20 90 105 o/w: Brazil 75,963 73,320 3.6 69,095 78,188 (11.6) 6.51 5.05 90 102 Mexico 20,454 17,722 15.4 26,033 20,824 25.0 1.64 2.45 183 165 Chile 29,074 25,555 13.8 23,228 18,829 23.4 4.65 3.65 64 89 USA 42,984 35,407 21.4 38,344 32,776 17.0 2.27 3.76 113 85 Operating areas 762,399 705,521 8.1 632,892 613,158 3.2 4.09 3.71 66 69 Total Group 766,224 723,969 5.8 644,009 624,414 3.1 4.11 3.78 65 69 * Santander Branch Network is the retail banking unit of Banco Santander S.A. The NPL ratio of Banco Santander S.A. at the end of June 2012 stood at 6.59% (5.08% in June 2011) and NPL coverage was 55% (44% in June 2011). Employees Branches 30.06.12 30.06.11 30.06.12 30.06.11 Operating means Continental Europe 57,837 59,197 6,540 6,643 o/w: Santander Branch Network 17,963 18,108 2,914 2,914 Banesto 9,234 9,470 1,698 1,717 Portugal 5,722 5,871 685 731 Santander Consumer Finance 11,656 11,765 637 662 Retail Poland (BZ WBK) 9,048 9,744 524 530 United Kingdom 26,993 26,802 1,315 1,405 Latin America 90,622 89,885 5,991 5,908 o/w: Brazil 54,647 53,132 3,784 3,728 Mexico 13,030 12,840 1,125 1,098 Chile 12,263 12,211 499 487 USA 9,363 9,000 723 723 Operating areas 184,815 184,884 14,569 14,679 Corporate Activities 2,436 2,249 Total Group 187,251 187,133 14,569 14,679 Comunicación Externa. Ciudad Grupo Santander Edificio Arrecife Pl. 2 7 28660 Boadilla del Monte (Madrid) Telf.: 34 91 289 52 11 comunicacionbancosantander@gruposantander.com