SlideShare ist ein Scribd-Unternehmen logo
1 von 15
Downloaden Sie, um offline zu lesen
Awad N Albalwi 3343297
Analysis of Food Additives by HPLC and UV-Vis
Aims:
• To determine the concentration of some additives in various beverages and an unknown
sample using High Performance Liquid Chromatography (HPLC).
• To use ultraviolet absorbance to measure the food additives caffeine and benzoic acid in
(non-diet) soft drinks, using Beer’s law and by solving simultaneous linear equations.
• To compare and contrast these two analytical methods as applied to the determination of
artificial sweetners.
format
Part A- HPLC
Procedure-
The Calibration standards were prepared in the ranges of 0-20,40,60,80&100 ppm for
caffeine, saccharin and benzoic acid by pipetting the required amount of stock solution into
100ml volumetric flasks and making up to the mark with MilliQ water.
The Soft drink was diluted by a factor of 10 to ensure the concentration of the
analytes in the can were within the calibration range.
The tea bag was weighed and the tea made up in a 250ml volumetric flask. And
then it was diluted by factor 20.
the pH of the eluent was measured using pH electrodes.
The unknown solutions were then collected and made up to the mark with MilliQ
waterin 100ml volumetric flask. The samples were than put through the HPLC starting with
the most dilute standards and the peak areas for each solution were recorded.
Pure caffeine and benzoic acid were injected into the HPLC column last to
determine which peak belonged to them. The caffeine peak was identified as a larger peak
at 3min , Benzoic Acid peak at the duration time (6min).
The parameters for the HPLC were as follows:
Eluent
25% MeOH/75% ,1ml Acetic acid
buffered to pH 3
Flow rate 1.4ml/min
Detector UV Detector – 254nm
Stationary
phase Band clone10u –C18
Column Length 150x3.9mm
Pressure 1494 psi
Loop size 20µL
Awad N Albalwi 3343297
B-UV-Vis Part
Procedure-
Standards in the range of 0,2,5,7.5&10ppm for benzoic acid and 0,4,10,15&20ppm for
Caffeine. The zero solution was prepared in 100ml volumetric flasks and 0.01M HCl. The
soft drink was diluted by a factor of 100. The tea was by a factor of 100 for analysis. the
unknown solution was collected and made up to the mark with milliQ water.
Once all samples and unknown were collected and prepared a baseline of the blank
was recorded The spectrum of each of the highest concentrated blanks was then recorded
and the wavelength of peak absorption was then recorded(230nm for benzoic acid and
273nm for caffeine).
The absorption of all standards was then recorded at 230 and 273nm and the
absorption of both caffeine and benzoic acid at both wavelengths was recorded. The
unknown, diluted soft drink & tea solutions were then recorded and the absorptions at
both wavelengths recorded.
The Calibration curves allowed the extinction coefficients for caffeine and benzoic
acid to be calculated at both wavelengths, this then allowed the concentrations of caffeine
and benzoic acid in the unknown, Soft drink and tea samples to be calculated by employing
the simultaneous equations described in the lab manual.
Results:
The following table shows the results obtained by both the HLPC and UV methods:
Standard mg/l Saccharin (Peak
Area)
Caffeine Peak Area Benzoic
Acid(Peak area)
20 91184 418983 95642
40 198222 831018 195612
60 283020 1224027 287027
80 491768 1686236 395409
100 522328 2028593 476241
a
Awad N Albalwi 3343297
b
c
d
e
f g
Awad N Albalwi 3343297
sample HPLC UV
Unknown [X] mg/L [X] mg/L
Caffeine 63±4 25mg/l 53±325mg/l
Benzoic Acid 84±425mg/l 88±225mg/l
Saccharin 50±2025mg/l
Soft drink [X] mg/l [X] mg/l
Caffeine
330±12mg/l
Or 33±1 in 100mg 465±25mg/l
Benzoic Acid ------- 87±225mg/l
Saccharin 231±46mg/l
Tea [X] mg/l Mg/l
Caffeine
104±4mg/l
Or 26±1mg/250ml 279 ±7mg/l
Discussion-
Both methods were successfully used to determine the concentrations of caffeine, benzoic
acid in various samples. Both methods gave results closely in case of unknown solution.
By using HPLC data , The calibration curves obtained by plotting the peak areas
against concentrations are very linear with R2
values being 0.999 for Caffeine and benzoic
acid and 0.974 for saccharin. These linear results give very accurate results as indicated by
relative errors of ±4 for caffeine, benzoic acid , but for saccharin was high in the unknown
solution .
The concentration of caffeine in soft drink was determined to be 33±1 mg/100ml. It
can be useful for measuring the accuracy ,if this result was comparing with that on the
label of soft drink. Unfortunately, the label data of soft drink was not provide by the
administrator.
The concentration of tea in the tea solution was calculated to be 26±1mg/250ml.
Caffeine & benzoic Acid -From Mcdevitt
Awad N Albalwi 3343297
In the UV prac the first thing that was required to be done was to measure the
wavelength of maximum absorption for caffeine and benzoic acid. This was done by
measuring absorbance of the highest concentration standard of each and measuring the
spectra from 210-300nm and then looking at the wavelength that corresponding to the
maximum absorption. The absorption of unknown ,soft drink & tea solutions was then
measured at both wavelengths (230 & 273nm). The concentration of caffeine and benzoic
acid was then able to be determined by using beers law and solving the appropriate
equations provided in the lab manual.
The concentrations of caffeine and benzoic acid in the unknown solutions were
calculated to be 53±3 mg/L and 88±2 mg/L respectively. The results are more closer to
those HPLC results (Table.1). On other hand , The concentration of caffeine in soft drink
was much greater than it from HPLC. The reason for this might be the absorbance is for
the caffeine and other contaminations such as saccharin.
The calculated concentration of caffeine in the soft drink was 465±25mg/l by UV/V. This
value is much larger than that obtained via HPLC (table.1). It is interesting that the result
coming from HPLC indicated that there is no area peak for benzoic acid while the UV/Vis
gives result in present it in soft drink . It is necessary to make sure that there is no benzoic
acid in soft drink by checking the label data of the soft drink or by measure the benzoic
acid by using other method such as GC/MS. If the investigation of present of benzoic acid
in soft drink is positive , that means there is systematic error in UV/Vis.
In the UV method beers law appears to hold for all analytes as can be seen by the
very linear plots of absorbance vs concentration for caffeine and benzoic acid at the two
wavelengths. However the graph for the absorbance of benzoic acid at 273nm has an R2
value of 0.9955 which is less than that for the other 3 graphs (graph ,e).
In order to overcome the problem of beers law not holding at higher concentrations
samples with high concentrations of analyte -such as tea sample - can be diluted so their
absorbance behaviour will obey beers law, the concentration of this diluted solution can
be calculated and then by taking into account the dilution factor the concentration in the
original sample can be calculated. It is also crucial to ensure the concentration of the
analyte solution is within the calibration range to ensure accurate calculations for the
concentration of the analyte are made.
conclusion :
Both methods used have their advantages and disadvantages over the other. HPLC
is best used when there are numerous components present as it will separate the
components out.
.
Awad N Albalwi 3343297
The Questions :
1. In HPLC, why is peak asymmetry a problem? Describe 3 possible causes of asymmetry.
1) Peak asymmetry is a problem in HPLC as it leads to non reproducible
results which means the usefulness of HPLC as an analytical tool is greatly diminished.
Possible causes of peak asymmetry include:
a) Overloading the column. Overloading can cause peak fronting which will
produce a band shape that contains a gradual rise and then an abrupt fall2. Overloading is
caused by having to much solute in the column. As the concentration of solute is increased
it will become more soluble in the mobile phase and as the solute is eluted little solute will
trail behind the peak resulting in an asymmetric band shape3
.
b) Peak tailing can occur when some sites in the stationary phase bind the solute more
strongly than others. Peak tailing results in a peak with a sharp rise in concentration at the
beginning and a long tail of gradually decreasing concentration after the peak4
.
c) Peak tailing may also arise due to degradation of the column.
2. For both methods, comment on the sensitivity of each analyte and give options for
improving the sensitivity.
The sensitivity of a particular method for the analytes to be investigated is one of
the major factors influencing which method to use. The sensitivity of a measurement gives
a measurement of the instrument response for a change
in concentration, for a calibration curve the sensitivity can be determined from the slope of
the calibration line. The sensitivities achieved in this experiment for both methods are
shown in the table below.
HPLC UV
Sensitivity (Peak area
units/ppm) Sensitivity (Abs units/ppm)
Saccharin 5568 Benzoic Acid 273nm 0.0079
Benzoic Acid 4803 Benzoic acid 230nm 0.0923
Caffeine 20482 Caffeine 273nm 0.02486
Caffeine 230nm 0.0262
Both methods have different sensitivities towards the different analytes. The HPLC
method was significantly more sensitive to caffeine than either benzoic acid or saccharin,
whereas the UV method was most sensitive towards benzoic acid at the wavelength of its
peak absorbance . The difference in sensitivities towards each analyte is due to the differing
instrument response towards the presence of each species, as each method has a different
type of detector each method will respond differently to different analytes.
The sensitivity of a measurement was determined by the type of detector used.
In the HPLC method a UV detector was employed. UV detectors are good for
gradient elutions with non absorbing solvents2
. The most common way to improve the
sensitivity of a measurement is to use a better detector, other detectors that may be
employed with HPLC that have good sensitivity towards the analytes include
electrochemical detectors and evaporative light scattering detectors2
, however the
sensitivity of each detector will be dependant on the analytes to be investigated.
Awad N Albalwi 3343297
3)In HPLC, if a peak was observed in a soft drink that corresponded to saccharin even
though it was not listed in the contents on the container, how could you go about
confirming the presence or otherwise of this compound?
3) The presence of saccharin in the can could be confirmed by a number of different
methods. One of the most effective methods would be the use of mass spectrometry to
identify the presence of sacchrain. The mass spectrum of saccharin could be viewed on a
database, the soft drink could then be analyzed by having a mass spectrometer attached to
the HPLC much like in GCMS and the mass spectrum of the peak compared to the
database. If a peak at m/z=183 is observed this would correspond to the molecular ion of
saccharin and indicate saccharin is most likely present.
The presence of saccharin could also be confirmed by injecting pure saccharin into
the HPLC under different chromatographic conditions and comparing the retention times of
the pure saccharin and the peak thought to correspond to saccharin as it is unlikely two
components will have the same retention times under two lots of conditions.
4. For the tea sample the concentration of caffeine may be expressed as mg caffeine/L
drink.Note that your extraction of caffeine from the solid food was not exhaustive; rather it
was performed in such a way as to yield a typical serving. Thus your result (recovery) for
mg caffeine/g solid food may be low. How could you check the completeness of recovery
of caffeine from the tea leaves?
4) The remaining caffeine in the tea bag could be extracted via the Swiss water
process. During this process the tea bags are soaked in hot water releasing the caffeine, the
water is then passed through a carbon filter which traps the caffeine molecules. The
caffeine can then be isolated and the amount obtained is weighed and compared to the
amount extracted by just making the tea. This would give an indication for the
completeness of recovery of the caffeine. The excess caffeine could also be extracted via an
extraction process using methylene chloride
3
.
6. Discuss the impact of saccharin and other compounds found in soft drinks on the
determination of caffeine and benzoic acid by UV/Vis. Could you improve the
method to account for these additional compounds? How?
HPLC is very sensitive to other analytes that may be present. During HPLC all
analytes are separated out in the column, however during the UV-Vis measurements other
analytes are not separated out, these impurities may also absorb light at the two
wavelengths used and thus give an absorbance reading that is higher than the actual reading
if just caffeine and benzoic acid was present. This effect was demonstrated by measuring
the spectra of the unknown solution with saccharin present, the spectra showed saccharin
absorbed some UV radiation at 230 and 273nm, this resulted in the absorbance at these two
wavelengths being higher than those corresponding to the unknown solution containing no
saccharin. The experiment could however be modified to take into account the presence of
saccharin in the unknown. The absorption of all species (caffeine, benzoic acid and
Awad N Albalwi 3343297
saccharin) over a range of concentrations could be measured and from the calibration
graphs the extinction coefficients could be determined. By noting that the total absorption
is the sum of all the absorptions a least squares analysis can be used to minimize the square
of the difference between the calculated absorbance and a guessed absorbance which is
obtained by guessing a value of the concentration of the analytes, this can be done
efficiently using the solver function in excel2
. The calculated concentrations that result in
the “guessed” absorbance being as close as possible to the measured absorbance such that
the square of their difference is minimized will give the concentration of the unknowns. If
not accounted for the presence of additional analytes that absorb over the wavelengths in
question can lead to significant errors resulting in higher than actual concentrations being
calculated. This is a significant disadvantage of the use of UV spectroscopy over HPLC
methods.
References:
1
Mcdevitt, V.L, Rodriquez, A, Williams, K.R, 1998, Analysis of Soft Drinks: UV
Spectrophotometry, Liquid Chromatography and Capillary Electrophoresis, Journal of
Chemical Education, Vol 75, No5, pg625-628
2
Harris, D.C, Quantitative Chemical Analysis , W.H, Freeman and
Company.
3
http://departments.oxy.edu/tops/Caffeine/CAFFEINE-T.pdf
Awad N Albalwi 3343297
TEACHER REFERENCE PAGES-CAFFEINE EXTRACTION LAB
Chemistry Caffeine Lab, Page 6 4/26/01
Introduction
Extraction and purification of natural products from common tea bags would help students
familiarize themselves with chemistry on a molecular basis.
In this experiment, students will extract caffeine from tea and purify it by sublimation.
Caffeine is an example of an alkaloid. Alkaloids are nitrogen-containing ring compounds of
plant
origin that usually have a bitter taste and some biological activity. Morphine, nicotine, and
quinine
are three examples (see Figure A). Caffeine is a central nervous system stimulant. Because
its
ingestion results in wakefulness, it is the principal ingredient of No-Doz tables. It is also
used to
counteract the hypnotic effect of other drugs and is found in a number of analgesics.
Figure A
The caffeine content of some common foods and drugs is summarized in Table 1.
Table 1. Caffeine Content of Common Food and Drugs
Coffee 80 - 125 mg/cup
Coffee, decaffeinated 2 - 4 mg/cup
Tea 30 -75 mg/cup
Cola 35 - 60 mg/12 oz
No-Doz 100 mg/tablet
TEACHER REFERENCE PAGES-CAFFEINE EXTRACTION LAB
Chemistry Caffeine Lab, Page 7 4/26/01
Equipment
Centrifuge
Analytical Balance
Supplies
10 Hot plates
10 Lab service dishes (purple)
10 Centrifuge tubes
Tea bags
10 DI Water bottles
Pasteur Pipets
10 10 mL Glass Pipets
10 Pipet pumps
10 100 mL Glass Beakers
10 50 mL Glass Beakers
Vials 1M Na2CO3
Vials Na2SO4
Vials 1,1,1-Trichloroethane
100 Vials, empty
10 Stirring rods
2 Large hot plates
2 Large Aluminum pans for sand baths
Awad N Albalwi 3343297
Sand
Foil
Ice
Kimwipes
Purpose
To extract and measure the caffeine in a tea bag.
Key Words
These terms should be clear to students before running the lab:
Sublimation, Extraction, Purification, Alkaloid, Caffeine, Decaffeinated.
TEACHER REFERENCE PAGES-CAFFEINE EXTRACTION LAB
Chemistry Caffeine Lab, Page 8 4/26/01
Procedure
Refer to student handout for procedure. The sodium carbonate solution is used instead of
water because caffeine is more soluble in it.
Reducing the volume to less than 10 mL is step 4 is important because the centrifuge tubes
only hold 12 mL. Students will add 3 mL of solvent and then use a Pasteur pipette to
remove
liquid, and too much liquid will overflow the tubes. It is best to have only 6-8 mL of
concentrated solution in order to obtain the maximum caffeine and to ease the extraction
procedure.
Caution students regarding step 5 and the release of pressure in the vial. If the mixture in
this step is shaken too vigorously, it may spew out when pressure is released, or an
emulsion may
form, making the extraction step more difficult.
Make certain that the centrifuge is balanced by equally distributing centrifuge tubes.
Demonstrate the technique for step 7.
The lab may be stopped after step 10 and continued the next day if necessary.
The sodium sulfate in step 11 is used to remove any water remaining in the 1,1,1-TCE
extract.
Due to moisture contamination and condensation, the mass of a beaker at room
temperature will be different from one which is cooled by ice or heated on the hot plate. All
efforts should be made to compare masses of beakers with and without caffeine at the same
temperature.
The ideal solvent for this extraction of caffeine is methylene chloride, but that chemical is
not permitted in high school classrooms. 1,1,1-TCE is not as good a solvent for caffeine,
but it
does successfully demonstrate the techniques of this lab.
Questions
1. What is the solubility of caffeine in water? In 1,1,1 trichloroethane?
solubility in water: 22 mg/mL @ 25C, 180 mg/mL @ 80C, and 670 mg/mL @
100C, somewhat soluble in 1,1,1-trichloroethane (teachers, we’re trying to
determine the precise solubility. If any one knows, please let us know.)
2. Why is 1,1,1 trichloroethane a better solvent for this extraction than water?
the tannins, etc. are not soluble in it. (Teachers, we usually would expect to use a
solvent which would dissolve more of the caffeine, and that improved solubility would
be another reason. In this case, that is not true.)
TEACHER REFERENCE PAGES-CAFFEINE EXTRACTION LAB
Chemistry Caffeine Lab, Page 9 4/26/01
Awad N Albalwi 3343297
3. How does sublimation differ from vaporization?
substance goes directly from a solid to a gas, not from a solid to a liquid and then to a
gas
4. What was the purpose of the sublimation step of this lab?
to remove the caffeine from the pigments and other impurities
5. Based on your knowledge of caffeine explain the reasons for this concern and possible
effects on the body.
excess known to cause birth defects
6. In your local grocery store you will find decaffeinated coffee and tea. Based on what
you learned in this experiment propose a method by which the decaffeination process
occurs.
extraction with solvents such as 1,1,1-trichloroethane or methylene chloride. Current
common commercial process involves extraction with liquid carbon dioxide (under
pressure). also "Swiss water process"
References
1. L. F. Fieser and K. L. Williamson, Organic Experiments, 6/e, D. C. Heath and Co.,
Lexington, MA, 1987.
2. D. L. Pavia, G. M. Lampman, G. S. Kriz, R. G. Engel, Introduction to Organic
Laboratory Techniques, A Microscale Approach, Saunders College Publications, San
Francisco, 1990.
Awad N Albalwi 3343297
No. of points x (mg/L) y (Peak Area) xy x^2 d d^2
6 0 0 0 0 -803.667 645880.1
20 95642 1912840 400 -1502.27 2256805
40 195612 7824480 1600 2127.133 4524696
60 287027 17221620 3600 -2798.47 7831416
80 395409 31632720 6400 9242.933 85431817
100 476241 47624100 10000 -6265.67 39258579
0 0 0 0
0 0 0 0
0 0 0 0
Benzoic 0 0 0 0
0 0 0 0
0 0 0 0
0 0 0 0
0 0 0 0
0 0 0 0
0 0 0 0
0 0 0 0
0 0 0 0
Sums 300 1449931 1.06E+08 22000 7.37E-11 1.4E+08
+/-
S.d. (y) 5915.006
D= 42000
m= 4817.03 70.697846
b = 803.6667 4280.9672
Measured
y 100000 Measured 1 times
Calc. X 20.59284 1.3947794
Awad N Albalwi 3343297
No. of points x (mg/L) y (Peak Area) xy x^2 d d^2
6 0 0 0 0 -7352.38 54057506
20 418983 8379660 400 1981.105 3924776
40 831018 33240720 1600 4366.59 19067112
60 1224027 73441620 3600 -12273.9 1.51E+08
80 1686236 1.35E+08 6400 40285.56 1.62E+09
100 2028593 2.03E+08 10000 -27007 7.29E+08
0 0 0 0
0 0 0 0
Caffein 0 0 0 0
0 0 0 0
0 0 0 0
0 0 0 0
0 0 0 0
0 0 0 0
0 0 0 0
0 0 0 0
0 0 0 0
0 0 0 0
Sums 300 6188857 4.53E+08 22000 -3.3E-10 2.58E+09
+/-
S.d. (y) 25396.85
D= 42000
m= 20482.48 303.55045
b = 7352.381 18380.893
Measured
y Measured 1 times
Calc. X #VALUE! #VALUE!
Awad N Albalwi 3343297
No. of points x (mg/L) y (Peak Area) xy x^2 d d^2
6 0 0 0 0 16466.57 2.71E+08
20 91184 1823680 400 -4019.66 16157644
40 187954 7518160 1600 -18919.9 3.58E+08
60 283020 16981200 3600 -35524.1 1.26E+09
80 491768 39341440 6400 61553.66 3.79E+09
100 522328 52232800 10000 -19556.6 3.82E+08
0 0 0 0
0 0 0 0
Saccharin 0 0 0 0
0 0 0 0
0 0 0 0
0 0 0 0
0 0 0 0
0 0 0 0
0 0 0 0
0 0 0 0
0 0 0 0
0 0 0 0
Sums 300 1576254 1.18E+08 22000 -1.2E-10 6.08E+09
+/-
S.d. (y) 38982.5
D= 42000
m= 5583.511 465.93004
b = -16466.6 28213.465
Measured
y Measured 1 times
Calc. X #VALUE! #VALUE!
Awad N Albalwi 3343297

Weitere ähnliche Inhalte

Was ist angesagt?

Presentation on adulteration in fats and oils manoj
Presentation on adulteration in fats and oils manojPresentation on adulteration in fats and oils manoj
Presentation on adulteration in fats and oils manojhimaja donthula
 
CARBOHYDRATES IN FOOD ANALYSIS
CARBOHYDRATES IN FOOD ANALYSISCARBOHYDRATES IN FOOD ANALYSIS
CARBOHYDRATES IN FOOD ANALYSISMachealJayaraj
 
Preservatives: Classification & Food Analysis
Preservatives: Classification & Food AnalysisPreservatives: Classification & Food Analysis
Preservatives: Classification & Food AnalysisVinit Gohel
 
Refining process of fat and oil
Refining process of fat and oilRefining process of fat and oil
Refining process of fat and oilArmia Naguib
 
Instrumental techniques of flavor evaluation
Instrumental techniques of flavor evaluationInstrumental techniques of flavor evaluation
Instrumental techniques of flavor evaluationMohit Bhardwaj
 
Notes* for the subject 'Food Analysis'
Notes* for the subject 'Food Analysis'Notes* for the subject 'Food Analysis'
Notes* for the subject 'Food Analysis'Sanathoiba Singha
 
General methods for analysis of food carbohydrates
General methods for analysis of food carbohydratesGeneral methods for analysis of food carbohydrates
General methods for analysis of food carbohydratesDr Raj kumar Kudari
 
General analytical methods of milk powder final
General analytical methods of milk powder finalGeneral analytical methods of milk powder final
General analytical methods of milk powder finalSkAzizuddin1
 
Determination of Ash content in food samples
Determination of Ash content in food samplesDetermination of Ash content in food samples
Determination of Ash content in food samplesAyeshaSiddiqa94
 
General analytical method of cheese (shameer m.pharm analysis 2020)
General analytical method of cheese (shameer m.pharm analysis 2020)General analytical method of cheese (shameer m.pharm analysis 2020)
General analytical method of cheese (shameer m.pharm analysis 2020)ShameerAbid
 
Protein Analysis - Kjeldhal
Protein Analysis - KjeldhalProtein Analysis - Kjeldhal
Protein Analysis - KjeldhalSanjai
 
Vitamin Analysis in Food
Vitamin Analysis in FoodVitamin Analysis in Food
Vitamin Analysis in FoodAshenGimantha1
 
Hydrogenation of Edible Oils
Hydrogenation  of Edible OilsHydrogenation  of Edible Oils
Hydrogenation of Edible OilsGerard B. Hawkins
 

Was ist angesagt? (20)

Presentation on adulteration in fats and oils manoj
Presentation on adulteration in fats and oils manojPresentation on adulteration in fats and oils manoj
Presentation on adulteration in fats and oils manoj
 
Analysis of lipids, fats & oils
Analysis of lipids, fats & oilsAnalysis of lipids, fats & oils
Analysis of lipids, fats & oils
 
CARBOHYDRATES IN FOOD ANALYSIS
CARBOHYDRATES IN FOOD ANALYSISCARBOHYDRATES IN FOOD ANALYSIS
CARBOHYDRATES IN FOOD ANALYSIS
 
Rajatt
RajattRajatt
Rajatt
 
Preservatives: Classification & Food Analysis
Preservatives: Classification & Food AnalysisPreservatives: Classification & Food Analysis
Preservatives: Classification & Food Analysis
 
Refining process of fat and oil
Refining process of fat and oilRefining process of fat and oil
Refining process of fat and oil
 
Instrumental techniques of flavor evaluation
Instrumental techniques of flavor evaluationInstrumental techniques of flavor evaluation
Instrumental techniques of flavor evaluation
 
Notes* for the subject 'Food Analysis'
Notes* for the subject 'Food Analysis'Notes* for the subject 'Food Analysis'
Notes* for the subject 'Food Analysis'
 
General methods for analysis of food carbohydrates
General methods for analysis of food carbohydratesGeneral methods for analysis of food carbohydrates
General methods for analysis of food carbohydrates
 
General analytical methods of milk powder final
General analytical methods of milk powder finalGeneral analytical methods of milk powder final
General analytical methods of milk powder final
 
Fat estimation method
Fat estimation  methodFat estimation  method
Fat estimation method
 
Determination of Ash content in food samples
Determination of Ash content in food samplesDetermination of Ash content in food samples
Determination of Ash content in food samples
 
Analysis of vitamins
Analysis of vitaminsAnalysis of vitamins
Analysis of vitamins
 
General analytical method of cheese (shameer m.pharm analysis 2020)
General analytical method of cheese (shameer m.pharm analysis 2020)General analytical method of cheese (shameer m.pharm analysis 2020)
General analytical method of cheese (shameer m.pharm analysis 2020)
 
Protein Analysis - Kjeldhal
Protein Analysis - KjeldhalProtein Analysis - Kjeldhal
Protein Analysis - Kjeldhal
 
Vitamin Analysis in Food
Vitamin Analysis in FoodVitamin Analysis in Food
Vitamin Analysis in Food
 
Analysis of vitamin
Analysis of vitaminAnalysis of vitamin
Analysis of vitamin
 
Hydrogenation of Edible Oils
Hydrogenation  of Edible OilsHydrogenation  of Edible Oils
Hydrogenation of Edible Oils
 
Peroxide value
Peroxide valuePeroxide value
Peroxide value
 
Analysis of fibre
Analysis of fibreAnalysis of fibre
Analysis of fibre
 

Ähnlich wie Chemical lab report analysis of food additives by hplc and uv-vis

VALIDATION AND DETERMINATION OF CAFFEINE CONTENT IN ENERGY DRINKS BY USING HP...
VALIDATION AND DETERMINATION OF CAFFEINE CONTENT IN ENERGY DRINKS BY USING HP...VALIDATION AND DETERMINATION OF CAFFEINE CONTENT IN ENERGY DRINKS BY USING HP...
VALIDATION AND DETERMINATION OF CAFFEINE CONTENT IN ENERGY DRINKS BY USING HP...Ruqsar Fatima
 
Comparative investigation of food supplements containing ascorbic acid Danka ...
Comparative investigation of food supplements containing ascorbic acid Danka ...Comparative investigation of food supplements containing ascorbic acid Danka ...
Comparative investigation of food supplements containing ascorbic acid Danka ...Georgi Daskalov
 
CHROMATOGRAPHY APPLICATION
CHROMATOGRAPHY  APPLICATIONCHROMATOGRAPHY  APPLICATION
CHROMATOGRAPHY APPLICATIONfarafaraly
 
A.m.v protocol for advipro
A.m.v protocol for adviproA.m.v protocol for advipro
A.m.v protocol for adviproBassem Elsayed
 
Chemical analysis formal lab report by molly winterbottom
Chemical analysis formal lab report by molly winterbottomChemical analysis formal lab report by molly winterbottom
Chemical analysis formal lab report by molly winterbottomMollyWinterbottom
 
Identifying components and concentrations in samples given using hplc
Identifying components and concentrations in samples given using hplcIdentifying components and concentrations in samples given using hplc
Identifying components and concentrations in samples given using hplcJacobScholes1
 
HPLC METHOD ADAPALENE & BENZOYL PEROXIDE
HPLC METHOD ADAPALENE & BENZOYL PEROXIDEHPLC METHOD ADAPALENE & BENZOYL PEROXIDE
HPLC METHOD ADAPALENE & BENZOYL PEROXIDESwamiVivekanandaPhar
 
Analysis of Capsaicin and Dihydrocapsaicin in Chili Peppers Using the PerkinE...
Analysis of Capsaicin and Dihydrocapsaicin in Chili Peppers Using the PerkinE...Analysis of Capsaicin and Dihydrocapsaicin in Chili Peppers Using the PerkinE...
Analysis of Capsaicin and Dihydrocapsaicin in Chili Peppers Using the PerkinE...PerkinElmer, Inc.
 
Development and Validation of Reversed Phase-High-Performance Liquid Chromato...
Development and Validation of Reversed Phase-High-Performance Liquid Chromato...Development and Validation of Reversed Phase-High-Performance Liquid Chromato...
Development and Validation of Reversed Phase-High-Performance Liquid Chromato...BRNSS Publication Hub
 
A spectrophotometric determination of ascorbic acid
A spectrophotometric determination of ascorbic acidA spectrophotometric determination of ascorbic acid
A spectrophotometric determination of ascorbic acidssuser4d011c
 
Quality control tests for Syrups and Elixirs.
Quality control tests for Syrups and Elixirs.Quality control tests for Syrups and Elixirs.
Quality control tests for Syrups and Elixirs.Umair hanif
 
LC-MS/MS method for the quantification of carbinoxamine in human plasma
LC-MS/MS method for the quantification of carbinoxamine in human plasmaLC-MS/MS method for the quantification of carbinoxamine in human plasma
LC-MS/MS method for the quantification of carbinoxamine in human plasmaIOSR Journals
 
CHEM318ResearchProject
CHEM318ResearchProjectCHEM318ResearchProject
CHEM318ResearchProjectAudree Co
 
hplc treaning presetation.pptx
hplc treaning presetation.pptxhplc treaning presetation.pptx
hplc treaning presetation.pptxPravin Amabade
 

Ähnlich wie Chemical lab report analysis of food additives by hplc and uv-vis (20)

VALIDATION AND DETERMINATION OF CAFFEINE CONTENT IN ENERGY DRINKS BY USING HP...
VALIDATION AND DETERMINATION OF CAFFEINE CONTENT IN ENERGY DRINKS BY USING HP...VALIDATION AND DETERMINATION OF CAFFEINE CONTENT IN ENERGY DRINKS BY USING HP...
VALIDATION AND DETERMINATION OF CAFFEINE CONTENT IN ENERGY DRINKS BY USING HP...
 
Comparative investigation of food supplements containing ascorbic acid Danka ...
Comparative investigation of food supplements containing ascorbic acid Danka ...Comparative investigation of food supplements containing ascorbic acid Danka ...
Comparative investigation of food supplements containing ascorbic acid Danka ...
 
Obreshkova
ObreshkovaObreshkova
Obreshkova
 
CHROMATOGRAPHY APPLICATION
CHROMATOGRAPHY  APPLICATIONCHROMATOGRAPHY  APPLICATION
CHROMATOGRAPHY APPLICATION
 
A.m.v protocol for advipro
A.m.v protocol for adviproA.m.v protocol for advipro
A.m.v protocol for advipro
 
Chemical analysis formal lab report by molly winterbottom
Chemical analysis formal lab report by molly winterbottomChemical analysis formal lab report by molly winterbottom
Chemical analysis formal lab report by molly winterbottom
 
Identifying components and concentrations in samples given using hplc
Identifying components and concentrations in samples given using hplcIdentifying components and concentrations in samples given using hplc
Identifying components and concentrations in samples given using hplc
 
Acid Base Titration Lab
Acid Base Titration LabAcid Base Titration Lab
Acid Base Titration Lab
 
04_IJPBA_1896_20.pdf
04_IJPBA_1896_20.pdf04_IJPBA_1896_20.pdf
04_IJPBA_1896_20.pdf
 
HPLC METHOD ADAPALENE & BENZOYL PEROXIDE
HPLC METHOD ADAPALENE & BENZOYL PEROXIDEHPLC METHOD ADAPALENE & BENZOYL PEROXIDE
HPLC METHOD ADAPALENE & BENZOYL PEROXIDE
 
Analysis of Capsaicin and Dihydrocapsaicin in Chili Peppers Using the PerkinE...
Analysis of Capsaicin and Dihydrocapsaicin in Chili Peppers Using the PerkinE...Analysis of Capsaicin and Dihydrocapsaicin in Chili Peppers Using the PerkinE...
Analysis of Capsaicin and Dihydrocapsaicin in Chili Peppers Using the PerkinE...
 
Development and Validation of Reversed Phase-High-Performance Liquid Chromato...
Development and Validation of Reversed Phase-High-Performance Liquid Chromato...Development and Validation of Reversed Phase-High-Performance Liquid Chromato...
Development and Validation of Reversed Phase-High-Performance Liquid Chromato...
 
04_IJPBA_1896_20.pdf
04_IJPBA_1896_20.pdf04_IJPBA_1896_20.pdf
04_IJPBA_1896_20.pdf
 
04_IJPBA_1896_20.pdf
04_IJPBA_1896_20.pdf04_IJPBA_1896_20.pdf
04_IJPBA_1896_20.pdf
 
A spectrophotometric determination of ascorbic acid
A spectrophotometric determination of ascorbic acidA spectrophotometric determination of ascorbic acid
A spectrophotometric determination of ascorbic acid
 
Quality control tests for Syrups and Elixirs.
Quality control tests for Syrups and Elixirs.Quality control tests for Syrups and Elixirs.
Quality control tests for Syrups and Elixirs.
 
B03708012
B03708012B03708012
B03708012
 
LC-MS/MS method for the quantification of carbinoxamine in human plasma
LC-MS/MS method for the quantification of carbinoxamine in human plasmaLC-MS/MS method for the quantification of carbinoxamine in human plasma
LC-MS/MS method for the quantification of carbinoxamine in human plasma
 
CHEM318ResearchProject
CHEM318ResearchProjectCHEM318ResearchProject
CHEM318ResearchProject
 
hplc treaning presetation.pptx
hplc treaning presetation.pptxhplc treaning presetation.pptx
hplc treaning presetation.pptx
 

Mehr von Awad Albalwi

double co-sensitization strategy using.pdf
double co-sensitization strategy using.pdfdouble co-sensitization strategy using.pdf
double co-sensitization strategy using.pdfAwad Albalwi
 
Electrochemistry part9
Electrochemistry part9Electrochemistry part9
Electrochemistry part9Awad Albalwi
 
Electrochemistry part8
Electrochemistry part8Electrochemistry part8
Electrochemistry part8Awad Albalwi
 
Electrochemistry part7
Electrochemistry part7Electrochemistry part7
Electrochemistry part7Awad Albalwi
 
Electrochemistry part6
Electrochemistry part6Electrochemistry part6
Electrochemistry part6Awad Albalwi
 
Electrochemistry part5
Electrochemistry part5Electrochemistry part5
Electrochemistry part5Awad Albalwi
 
Electrochemistry part4
Electrochemistry part4Electrochemistry part4
Electrochemistry part4Awad Albalwi
 
Electrochemistry part3
Electrochemistry part3Electrochemistry part3
Electrochemistry part3Awad Albalwi
 
Electrochemistry part2
Electrochemistry part2Electrochemistry part2
Electrochemistry part2Awad Albalwi
 
Electrochemistry part1
Electrochemistry part1Electrochemistry part1
Electrochemistry part1Awad Albalwi
 
Report writing arabic lang 4
Report writing  arabic lang 4Report writing  arabic lang 4
Report writing arabic lang 4Awad Albalwi
 
Data analysis Arabic language part 3
Data analysis  Arabic language part 3Data analysis  Arabic language part 3
Data analysis Arabic language part 3Awad Albalwi
 
Research methodology Arabic language part 2
Research methodology Arabic language part 2Research methodology Arabic language part 2
Research methodology Arabic language part 2Awad Albalwi
 
Research methodology Arabic language part 2
Research methodology Arabic language part 2Research methodology Arabic language part 2
Research methodology Arabic language part 2Awad Albalwi
 
Research methodology Arabic language part 1
Research methodology Arabic language part 1Research methodology Arabic language part 1
Research methodology Arabic language part 1Awad Albalwi
 
Crystal Structure, Topological and Hirshfeld Surface Analysis of a Zn(II) Zwi...
Crystal Structure, Topological and Hirshfeld Surface Analysis of a Zn(II) Zwi...Crystal Structure, Topological and Hirshfeld Surface Analysis of a Zn(II) Zwi...
Crystal Structure, Topological and Hirshfeld Surface Analysis of a Zn(II) Zwi...Awad Albalwi
 
Poster conference - Template
Poster conference - TemplatePoster conference - Template
Poster conference - TemplateAwad Albalwi
 
What evidence is there for water on mars 2009
What evidence is there for water on mars 2009What evidence is there for water on mars 2009
What evidence is there for water on mars 2009Awad Albalwi
 
Application of Statistical and mathematical equations in Chemistry -Part 6
Application of Statistical and mathematical equations in Chemistry -Part 6Application of Statistical and mathematical equations in Chemistry -Part 6
Application of Statistical and mathematical equations in Chemistry -Part 6Awad Albalwi
 

Mehr von Awad Albalwi (20)

double co-sensitization strategy using.pdf
double co-sensitization strategy using.pdfdouble co-sensitization strategy using.pdf
double co-sensitization strategy using.pdf
 
Electrochemistry part9
Electrochemistry part9Electrochemistry part9
Electrochemistry part9
 
Electrochemistry part8
Electrochemistry part8Electrochemistry part8
Electrochemistry part8
 
Electrochemistry part7
Electrochemistry part7Electrochemistry part7
Electrochemistry part7
 
Electrochemistry part6
Electrochemistry part6Electrochemistry part6
Electrochemistry part6
 
Electrochemistry part5
Electrochemistry part5Electrochemistry part5
Electrochemistry part5
 
Electrochemistry part4
Electrochemistry part4Electrochemistry part4
Electrochemistry part4
 
Electrochemistry part3
Electrochemistry part3Electrochemistry part3
Electrochemistry part3
 
Electrochemistry part2
Electrochemistry part2Electrochemistry part2
Electrochemistry part2
 
Electrochemistry part1
Electrochemistry part1Electrochemistry part1
Electrochemistry part1
 
Report writing arabic lang 4
Report writing  arabic lang 4Report writing  arabic lang 4
Report writing arabic lang 4
 
Data analysis Arabic language part 3
Data analysis  Arabic language part 3Data analysis  Arabic language part 3
Data analysis Arabic language part 3
 
Research methodology Arabic language part 2
Research methodology Arabic language part 2Research methodology Arabic language part 2
Research methodology Arabic language part 2
 
Research methodology Arabic language part 2
Research methodology Arabic language part 2Research methodology Arabic language part 2
Research methodology Arabic language part 2
 
Research methodology Arabic language part 1
Research methodology Arabic language part 1Research methodology Arabic language part 1
Research methodology Arabic language part 1
 
Crystal Structure, Topological and Hirshfeld Surface Analysis of a Zn(II) Zwi...
Crystal Structure, Topological and Hirshfeld Surface Analysis of a Zn(II) Zwi...Crystal Structure, Topological and Hirshfeld Surface Analysis of a Zn(II) Zwi...
Crystal Structure, Topological and Hirshfeld Surface Analysis of a Zn(II) Zwi...
 
Poster conference - Template
Poster conference - TemplatePoster conference - Template
Poster conference - Template
 
What evidence is there for water on mars 2009
What evidence is there for water on mars 2009What evidence is there for water on mars 2009
What evidence is there for water on mars 2009
 
Application of Statistical and mathematical equations in Chemistry -Part 6
Application of Statistical and mathematical equations in Chemistry -Part 6Application of Statistical and mathematical equations in Chemistry -Part 6
Application of Statistical and mathematical equations in Chemistry -Part 6
 
Application of Statistical and mathematical equations in Chemistry -Part 6
Application of Statistical and mathematical equations in Chemistry -Part 6Application of Statistical and mathematical equations in Chemistry -Part 6
Application of Statistical and mathematical equations in Chemistry -Part 6
 

Kürzlich hochgeladen

Raman spectroscopy.pptx M Pharm, M Sc, Advanced Spectral Analysis
Raman spectroscopy.pptx M Pharm, M Sc, Advanced Spectral AnalysisRaman spectroscopy.pptx M Pharm, M Sc, Advanced Spectral Analysis
Raman spectroscopy.pptx M Pharm, M Sc, Advanced Spectral AnalysisDiwakar Mishra
 
TEST BANK For Radiologic Science for Technologists, 12th Edition by Stewart C...
TEST BANK For Radiologic Science for Technologists, 12th Edition by Stewart C...TEST BANK For Radiologic Science for Technologists, 12th Edition by Stewart C...
TEST BANK For Radiologic Science for Technologists, 12th Edition by Stewart C...ssifa0344
 
Pests of cotton_Borer_Pests_Binomics_Dr.UPR.pdf
Pests of cotton_Borer_Pests_Binomics_Dr.UPR.pdfPests of cotton_Borer_Pests_Binomics_Dr.UPR.pdf
Pests of cotton_Borer_Pests_Binomics_Dr.UPR.pdfPirithiRaju
 
Spermiogenesis or Spermateleosis or metamorphosis of spermatid
Spermiogenesis or Spermateleosis or metamorphosis of spermatidSpermiogenesis or Spermateleosis or metamorphosis of spermatid
Spermiogenesis or Spermateleosis or metamorphosis of spermatidSarthak Sekhar Mondal
 
Nightside clouds and disequilibrium chemistry on the hot Jupiter WASP-43b
Nightside clouds and disequilibrium chemistry on the hot Jupiter WASP-43bNightside clouds and disequilibrium chemistry on the hot Jupiter WASP-43b
Nightside clouds and disequilibrium chemistry on the hot Jupiter WASP-43bSérgio Sacani
 
9654467111 Call Girls In Raj Nagar Delhi Short 1500 Night 6000
9654467111 Call Girls In Raj Nagar Delhi Short 1500 Night 60009654467111 Call Girls In Raj Nagar Delhi Short 1500 Night 6000
9654467111 Call Girls In Raj Nagar Delhi Short 1500 Night 6000Sapana Sha
 
All-domain Anomaly Resolution Office U.S. Department of Defense (U) Case: “Eg...
All-domain Anomaly Resolution Office U.S. Department of Defense (U) Case: “Eg...All-domain Anomaly Resolution Office U.S. Department of Defense (U) Case: “Eg...
All-domain Anomaly Resolution Office U.S. Department of Defense (U) Case: “Eg...Sérgio Sacani
 
Stunning ➥8448380779▻ Call Girls In Panchshil Enclave Delhi NCR
Stunning ➥8448380779▻ Call Girls In Panchshil Enclave Delhi NCRStunning ➥8448380779▻ Call Girls In Panchshil Enclave Delhi NCR
Stunning ➥8448380779▻ Call Girls In Panchshil Enclave Delhi NCRDelhi Call girls
 
Recombination DNA Technology (Nucleic Acid Hybridization )
Recombination DNA Technology (Nucleic Acid Hybridization )Recombination DNA Technology (Nucleic Acid Hybridization )
Recombination DNA Technology (Nucleic Acid Hybridization )aarthirajkumar25
 
GBSN - Microbiology (Unit 2)
GBSN - Microbiology (Unit 2)GBSN - Microbiology (Unit 2)
GBSN - Microbiology (Unit 2)Areesha Ahmad
 
Hire 💕 9907093804 Hooghly Call Girls Service Call Girls Agency
Hire 💕 9907093804 Hooghly Call Girls Service Call Girls AgencyHire 💕 9907093804 Hooghly Call Girls Service Call Girls Agency
Hire 💕 9907093804 Hooghly Call Girls Service Call Girls AgencySheetal Arora
 
Discovery of an Accretion Streamer and a Slow Wide-angle Outflow around FUOri...
Discovery of an Accretion Streamer and a Slow Wide-angle Outflow around FUOri...Discovery of an Accretion Streamer and a Slow Wide-angle Outflow around FUOri...
Discovery of an Accretion Streamer and a Slow Wide-angle Outflow around FUOri...Sérgio Sacani
 
Disentangling the origin of chemical differences using GHOST
Disentangling the origin of chemical differences using GHOSTDisentangling the origin of chemical differences using GHOST
Disentangling the origin of chemical differences using GHOSTSérgio Sacani
 
Green chemistry and Sustainable development.pptx
Green chemistry  and Sustainable development.pptxGreen chemistry  and Sustainable development.pptx
Green chemistry and Sustainable development.pptxRajatChauhan518211
 
STERILITY TESTING OF PHARMACEUTICALS ppt by DR.C.P.PRINCE
STERILITY TESTING OF PHARMACEUTICALS ppt by DR.C.P.PRINCESTERILITY TESTING OF PHARMACEUTICALS ppt by DR.C.P.PRINCE
STERILITY TESTING OF PHARMACEUTICALS ppt by DR.C.P.PRINCEPRINCE C P
 
GFP in rDNA Technology (Biotechnology).pptx
GFP in rDNA Technology (Biotechnology).pptxGFP in rDNA Technology (Biotechnology).pptx
GFP in rDNA Technology (Biotechnology).pptxAleenaTreesaSaji
 
Traditional Agroforestry System in India- Shifting Cultivation, Taungya, Home...
Traditional Agroforestry System in India- Shifting Cultivation, Taungya, Home...Traditional Agroforestry System in India- Shifting Cultivation, Taungya, Home...
Traditional Agroforestry System in India- Shifting Cultivation, Taungya, Home...jana861314
 
Biological Classification BioHack (3).pdf
Biological Classification BioHack (3).pdfBiological Classification BioHack (3).pdf
Biological Classification BioHack (3).pdfmuntazimhurra
 
Biopesticide (2).pptx .This slides helps to know the different types of biop...
Biopesticide (2).pptx  .This slides helps to know the different types of biop...Biopesticide (2).pptx  .This slides helps to know the different types of biop...
Biopesticide (2).pptx .This slides helps to know the different types of biop...RohitNehra6
 

Kürzlich hochgeladen (20)

Raman spectroscopy.pptx M Pharm, M Sc, Advanced Spectral Analysis
Raman spectroscopy.pptx M Pharm, M Sc, Advanced Spectral AnalysisRaman spectroscopy.pptx M Pharm, M Sc, Advanced Spectral Analysis
Raman spectroscopy.pptx M Pharm, M Sc, Advanced Spectral Analysis
 
TEST BANK For Radiologic Science for Technologists, 12th Edition by Stewart C...
TEST BANK For Radiologic Science for Technologists, 12th Edition by Stewart C...TEST BANK For Radiologic Science for Technologists, 12th Edition by Stewart C...
TEST BANK For Radiologic Science for Technologists, 12th Edition by Stewart C...
 
Pests of cotton_Borer_Pests_Binomics_Dr.UPR.pdf
Pests of cotton_Borer_Pests_Binomics_Dr.UPR.pdfPests of cotton_Borer_Pests_Binomics_Dr.UPR.pdf
Pests of cotton_Borer_Pests_Binomics_Dr.UPR.pdf
 
Spermiogenesis or Spermateleosis or metamorphosis of spermatid
Spermiogenesis or Spermateleosis or metamorphosis of spermatidSpermiogenesis or Spermateleosis or metamorphosis of spermatid
Spermiogenesis or Spermateleosis or metamorphosis of spermatid
 
Nightside clouds and disequilibrium chemistry on the hot Jupiter WASP-43b
Nightside clouds and disequilibrium chemistry on the hot Jupiter WASP-43bNightside clouds and disequilibrium chemistry on the hot Jupiter WASP-43b
Nightside clouds and disequilibrium chemistry on the hot Jupiter WASP-43b
 
9654467111 Call Girls In Raj Nagar Delhi Short 1500 Night 6000
9654467111 Call Girls In Raj Nagar Delhi Short 1500 Night 60009654467111 Call Girls In Raj Nagar Delhi Short 1500 Night 6000
9654467111 Call Girls In Raj Nagar Delhi Short 1500 Night 6000
 
All-domain Anomaly Resolution Office U.S. Department of Defense (U) Case: “Eg...
All-domain Anomaly Resolution Office U.S. Department of Defense (U) Case: “Eg...All-domain Anomaly Resolution Office U.S. Department of Defense (U) Case: “Eg...
All-domain Anomaly Resolution Office U.S. Department of Defense (U) Case: “Eg...
 
Stunning ➥8448380779▻ Call Girls In Panchshil Enclave Delhi NCR
Stunning ➥8448380779▻ Call Girls In Panchshil Enclave Delhi NCRStunning ➥8448380779▻ Call Girls In Panchshil Enclave Delhi NCR
Stunning ➥8448380779▻ Call Girls In Panchshil Enclave Delhi NCR
 
Recombination DNA Technology (Nucleic Acid Hybridization )
Recombination DNA Technology (Nucleic Acid Hybridization )Recombination DNA Technology (Nucleic Acid Hybridization )
Recombination DNA Technology (Nucleic Acid Hybridization )
 
GBSN - Microbiology (Unit 2)
GBSN - Microbiology (Unit 2)GBSN - Microbiology (Unit 2)
GBSN - Microbiology (Unit 2)
 
Hire 💕 9907093804 Hooghly Call Girls Service Call Girls Agency
Hire 💕 9907093804 Hooghly Call Girls Service Call Girls AgencyHire 💕 9907093804 Hooghly Call Girls Service Call Girls Agency
Hire 💕 9907093804 Hooghly Call Girls Service Call Girls Agency
 
Discovery of an Accretion Streamer and a Slow Wide-angle Outflow around FUOri...
Discovery of an Accretion Streamer and a Slow Wide-angle Outflow around FUOri...Discovery of an Accretion Streamer and a Slow Wide-angle Outflow around FUOri...
Discovery of an Accretion Streamer and a Slow Wide-angle Outflow around FUOri...
 
Disentangling the origin of chemical differences using GHOST
Disentangling the origin of chemical differences using GHOSTDisentangling the origin of chemical differences using GHOST
Disentangling the origin of chemical differences using GHOST
 
Green chemistry and Sustainable development.pptx
Green chemistry  and Sustainable development.pptxGreen chemistry  and Sustainable development.pptx
Green chemistry and Sustainable development.pptx
 
STERILITY TESTING OF PHARMACEUTICALS ppt by DR.C.P.PRINCE
STERILITY TESTING OF PHARMACEUTICALS ppt by DR.C.P.PRINCESTERILITY TESTING OF PHARMACEUTICALS ppt by DR.C.P.PRINCE
STERILITY TESTING OF PHARMACEUTICALS ppt by DR.C.P.PRINCE
 
GFP in rDNA Technology (Biotechnology).pptx
GFP in rDNA Technology (Biotechnology).pptxGFP in rDNA Technology (Biotechnology).pptx
GFP in rDNA Technology (Biotechnology).pptx
 
Traditional Agroforestry System in India- Shifting Cultivation, Taungya, Home...
Traditional Agroforestry System in India- Shifting Cultivation, Taungya, Home...Traditional Agroforestry System in India- Shifting Cultivation, Taungya, Home...
Traditional Agroforestry System in India- Shifting Cultivation, Taungya, Home...
 
Biological Classification BioHack (3).pdf
Biological Classification BioHack (3).pdfBiological Classification BioHack (3).pdf
Biological Classification BioHack (3).pdf
 
Biopesticide (2).pptx .This slides helps to know the different types of biop...
Biopesticide (2).pptx  .This slides helps to know the different types of biop...Biopesticide (2).pptx  .This slides helps to know the different types of biop...
Biopesticide (2).pptx .This slides helps to know the different types of biop...
 
The Philosophy of Science
The Philosophy of ScienceThe Philosophy of Science
The Philosophy of Science
 

Chemical lab report analysis of food additives by hplc and uv-vis

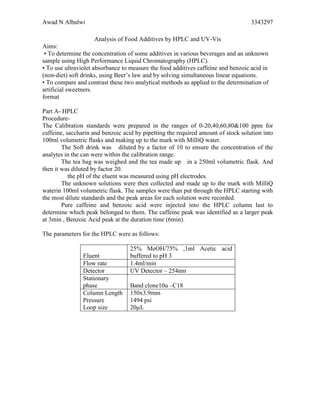
  • 1. Awad N Albalwi 3343297 Analysis of Food Additives by HPLC and UV-Vis Aims: • To determine the concentration of some additives in various beverages and an unknown sample using High Performance Liquid Chromatography (HPLC). • To use ultraviolet absorbance to measure the food additives caffeine and benzoic acid in (non-diet) soft drinks, using Beer’s law and by solving simultaneous linear equations. • To compare and contrast these two analytical methods as applied to the determination of artificial sweetners. format Part A- HPLC Procedure- The Calibration standards were prepared in the ranges of 0-20,40,60,80&100 ppm for caffeine, saccharin and benzoic acid by pipetting the required amount of stock solution into 100ml volumetric flasks and making up to the mark with MilliQ water. The Soft drink was diluted by a factor of 10 to ensure the concentration of the analytes in the can were within the calibration range. The tea bag was weighed and the tea made up in a 250ml volumetric flask. And then it was diluted by factor 20. the pH of the eluent was measured using pH electrodes. The unknown solutions were then collected and made up to the mark with MilliQ waterin 100ml volumetric flask. The samples were than put through the HPLC starting with the most dilute standards and the peak areas for each solution were recorded. Pure caffeine and benzoic acid were injected into the HPLC column last to determine which peak belonged to them. The caffeine peak was identified as a larger peak at 3min , Benzoic Acid peak at the duration time (6min). The parameters for the HPLC were as follows: Eluent 25% MeOH/75% ,1ml Acetic acid buffered to pH 3 Flow rate 1.4ml/min Detector UV Detector – 254nm Stationary phase Band clone10u –C18 Column Length 150x3.9mm Pressure 1494 psi Loop size 20µL
  • 2. Awad N Albalwi 3343297 B-UV-Vis Part Procedure- Standards in the range of 0,2,5,7.5&10ppm for benzoic acid and 0,4,10,15&20ppm for Caffeine. The zero solution was prepared in 100ml volumetric flasks and 0.01M HCl. The soft drink was diluted by a factor of 100. The tea was by a factor of 100 for analysis. the unknown solution was collected and made up to the mark with milliQ water. Once all samples and unknown were collected and prepared a baseline of the blank was recorded The spectrum of each of the highest concentrated blanks was then recorded and the wavelength of peak absorption was then recorded(230nm for benzoic acid and 273nm for caffeine). The absorption of all standards was then recorded at 230 and 273nm and the absorption of both caffeine and benzoic acid at both wavelengths was recorded. The unknown, diluted soft drink & tea solutions were then recorded and the absorptions at both wavelengths recorded. The Calibration curves allowed the extinction coefficients for caffeine and benzoic acid to be calculated at both wavelengths, this then allowed the concentrations of caffeine and benzoic acid in the unknown, Soft drink and tea samples to be calculated by employing the simultaneous equations described in the lab manual. Results: The following table shows the results obtained by both the HLPC and UV methods: Standard mg/l Saccharin (Peak Area) Caffeine Peak Area Benzoic Acid(Peak area) 20 91184 418983 95642 40 198222 831018 195612 60 283020 1224027 287027 80 491768 1686236 395409 100 522328 2028593 476241 a
  • 3. Awad N Albalwi 3343297 b c d e f g
  • 4. Awad N Albalwi 3343297 sample HPLC UV Unknown [X] mg/L [X] mg/L Caffeine 63±4 25mg/l 53±325mg/l Benzoic Acid 84±425mg/l 88±225mg/l Saccharin 50±2025mg/l Soft drink [X] mg/l [X] mg/l Caffeine 330±12mg/l Or 33±1 in 100mg 465±25mg/l Benzoic Acid ------- 87±225mg/l Saccharin 231±46mg/l Tea [X] mg/l Mg/l Caffeine 104±4mg/l Or 26±1mg/250ml 279 ±7mg/l Discussion- Both methods were successfully used to determine the concentrations of caffeine, benzoic acid in various samples. Both methods gave results closely in case of unknown solution. By using HPLC data , The calibration curves obtained by plotting the peak areas against concentrations are very linear with R2 values being 0.999 for Caffeine and benzoic acid and 0.974 for saccharin. These linear results give very accurate results as indicated by relative errors of ±4 for caffeine, benzoic acid , but for saccharin was high in the unknown solution . The concentration of caffeine in soft drink was determined to be 33±1 mg/100ml. It can be useful for measuring the accuracy ,if this result was comparing with that on the label of soft drink. Unfortunately, the label data of soft drink was not provide by the administrator. The concentration of tea in the tea solution was calculated to be 26±1mg/250ml. Caffeine & benzoic Acid -From Mcdevitt
  • 5. Awad N Albalwi 3343297 In the UV prac the first thing that was required to be done was to measure the wavelength of maximum absorption for caffeine and benzoic acid. This was done by measuring absorbance of the highest concentration standard of each and measuring the spectra from 210-300nm and then looking at the wavelength that corresponding to the maximum absorption. The absorption of unknown ,soft drink & tea solutions was then measured at both wavelengths (230 & 273nm). The concentration of caffeine and benzoic acid was then able to be determined by using beers law and solving the appropriate equations provided in the lab manual. The concentrations of caffeine and benzoic acid in the unknown solutions were calculated to be 53±3 mg/L and 88±2 mg/L respectively. The results are more closer to those HPLC results (Table.1). On other hand , The concentration of caffeine in soft drink was much greater than it from HPLC. The reason for this might be the absorbance is for the caffeine and other contaminations such as saccharin. The calculated concentration of caffeine in the soft drink was 465±25mg/l by UV/V. This value is much larger than that obtained via HPLC (table.1). It is interesting that the result coming from HPLC indicated that there is no area peak for benzoic acid while the UV/Vis gives result in present it in soft drink . It is necessary to make sure that there is no benzoic acid in soft drink by checking the label data of the soft drink or by measure the benzoic acid by using other method such as GC/MS. If the investigation of present of benzoic acid in soft drink is positive , that means there is systematic error in UV/Vis. In the UV method beers law appears to hold for all analytes as can be seen by the very linear plots of absorbance vs concentration for caffeine and benzoic acid at the two wavelengths. However the graph for the absorbance of benzoic acid at 273nm has an R2 value of 0.9955 which is less than that for the other 3 graphs (graph ,e). In order to overcome the problem of beers law not holding at higher concentrations samples with high concentrations of analyte -such as tea sample - can be diluted so their absorbance behaviour will obey beers law, the concentration of this diluted solution can be calculated and then by taking into account the dilution factor the concentration in the original sample can be calculated. It is also crucial to ensure the concentration of the analyte solution is within the calibration range to ensure accurate calculations for the concentration of the analyte are made. conclusion : Both methods used have their advantages and disadvantages over the other. HPLC is best used when there are numerous components present as it will separate the components out. .
  • 6. Awad N Albalwi 3343297 The Questions : 1. In HPLC, why is peak asymmetry a problem? Describe 3 possible causes of asymmetry. 1) Peak asymmetry is a problem in HPLC as it leads to non reproducible results which means the usefulness of HPLC as an analytical tool is greatly diminished. Possible causes of peak asymmetry include: a) Overloading the column. Overloading can cause peak fronting which will produce a band shape that contains a gradual rise and then an abrupt fall2. Overloading is caused by having to much solute in the column. As the concentration of solute is increased it will become more soluble in the mobile phase and as the solute is eluted little solute will trail behind the peak resulting in an asymmetric band shape3 . b) Peak tailing can occur when some sites in the stationary phase bind the solute more strongly than others. Peak tailing results in a peak with a sharp rise in concentration at the beginning and a long tail of gradually decreasing concentration after the peak4 . c) Peak tailing may also arise due to degradation of the column. 2. For both methods, comment on the sensitivity of each analyte and give options for improving the sensitivity. The sensitivity of a particular method for the analytes to be investigated is one of the major factors influencing which method to use. The sensitivity of a measurement gives a measurement of the instrument response for a change in concentration, for a calibration curve the sensitivity can be determined from the slope of the calibration line. The sensitivities achieved in this experiment for both methods are shown in the table below. HPLC UV Sensitivity (Peak area units/ppm) Sensitivity (Abs units/ppm) Saccharin 5568 Benzoic Acid 273nm 0.0079 Benzoic Acid 4803 Benzoic acid 230nm 0.0923 Caffeine 20482 Caffeine 273nm 0.02486 Caffeine 230nm 0.0262 Both methods have different sensitivities towards the different analytes. The HPLC method was significantly more sensitive to caffeine than either benzoic acid or saccharin, whereas the UV method was most sensitive towards benzoic acid at the wavelength of its peak absorbance . The difference in sensitivities towards each analyte is due to the differing instrument response towards the presence of each species, as each method has a different type of detector each method will respond differently to different analytes. The sensitivity of a measurement was determined by the type of detector used. In the HPLC method a UV detector was employed. UV detectors are good for gradient elutions with non absorbing solvents2 . The most common way to improve the sensitivity of a measurement is to use a better detector, other detectors that may be employed with HPLC that have good sensitivity towards the analytes include electrochemical detectors and evaporative light scattering detectors2 , however the sensitivity of each detector will be dependant on the analytes to be investigated.
  • 7. Awad N Albalwi 3343297 3)In HPLC, if a peak was observed in a soft drink that corresponded to saccharin even though it was not listed in the contents on the container, how could you go about confirming the presence or otherwise of this compound? 3) The presence of saccharin in the can could be confirmed by a number of different methods. One of the most effective methods would be the use of mass spectrometry to identify the presence of sacchrain. The mass spectrum of saccharin could be viewed on a database, the soft drink could then be analyzed by having a mass spectrometer attached to the HPLC much like in GCMS and the mass spectrum of the peak compared to the database. If a peak at m/z=183 is observed this would correspond to the molecular ion of saccharin and indicate saccharin is most likely present. The presence of saccharin could also be confirmed by injecting pure saccharin into the HPLC under different chromatographic conditions and comparing the retention times of the pure saccharin and the peak thought to correspond to saccharin as it is unlikely two components will have the same retention times under two lots of conditions. 4. For the tea sample the concentration of caffeine may be expressed as mg caffeine/L drink.Note that your extraction of caffeine from the solid food was not exhaustive; rather it was performed in such a way as to yield a typical serving. Thus your result (recovery) for mg caffeine/g solid food may be low. How could you check the completeness of recovery of caffeine from the tea leaves? 4) The remaining caffeine in the tea bag could be extracted via the Swiss water process. During this process the tea bags are soaked in hot water releasing the caffeine, the water is then passed through a carbon filter which traps the caffeine molecules. The caffeine can then be isolated and the amount obtained is weighed and compared to the amount extracted by just making the tea. This would give an indication for the completeness of recovery of the caffeine. The excess caffeine could also be extracted via an extraction process using methylene chloride 3 . 6. Discuss the impact of saccharin and other compounds found in soft drinks on the determination of caffeine and benzoic acid by UV/Vis. Could you improve the method to account for these additional compounds? How? HPLC is very sensitive to other analytes that may be present. During HPLC all analytes are separated out in the column, however during the UV-Vis measurements other analytes are not separated out, these impurities may also absorb light at the two wavelengths used and thus give an absorbance reading that is higher than the actual reading if just caffeine and benzoic acid was present. This effect was demonstrated by measuring the spectra of the unknown solution with saccharin present, the spectra showed saccharin absorbed some UV radiation at 230 and 273nm, this resulted in the absorbance at these two wavelengths being higher than those corresponding to the unknown solution containing no saccharin. The experiment could however be modified to take into account the presence of saccharin in the unknown. The absorption of all species (caffeine, benzoic acid and
  • 8. Awad N Albalwi 3343297 saccharin) over a range of concentrations could be measured and from the calibration graphs the extinction coefficients could be determined. By noting that the total absorption is the sum of all the absorptions a least squares analysis can be used to minimize the square of the difference between the calculated absorbance and a guessed absorbance which is obtained by guessing a value of the concentration of the analytes, this can be done efficiently using the solver function in excel2 . The calculated concentrations that result in the “guessed” absorbance being as close as possible to the measured absorbance such that the square of their difference is minimized will give the concentration of the unknowns. If not accounted for the presence of additional analytes that absorb over the wavelengths in question can lead to significant errors resulting in higher than actual concentrations being calculated. This is a significant disadvantage of the use of UV spectroscopy over HPLC methods. References: 1 Mcdevitt, V.L, Rodriquez, A, Williams, K.R, 1998, Analysis of Soft Drinks: UV Spectrophotometry, Liquid Chromatography and Capillary Electrophoresis, Journal of Chemical Education, Vol 75, No5, pg625-628 2 Harris, D.C, Quantitative Chemical Analysis , W.H, Freeman and Company. 3 http://departments.oxy.edu/tops/Caffeine/CAFFEINE-T.pdf
  • 9. Awad N Albalwi 3343297 TEACHER REFERENCE PAGES-CAFFEINE EXTRACTION LAB Chemistry Caffeine Lab, Page 6 4/26/01 Introduction Extraction and purification of natural products from common tea bags would help students familiarize themselves with chemistry on a molecular basis. In this experiment, students will extract caffeine from tea and purify it by sublimation. Caffeine is an example of an alkaloid. Alkaloids are nitrogen-containing ring compounds of plant origin that usually have a bitter taste and some biological activity. Morphine, nicotine, and quinine are three examples (see Figure A). Caffeine is a central nervous system stimulant. Because its ingestion results in wakefulness, it is the principal ingredient of No-Doz tables. It is also used to counteract the hypnotic effect of other drugs and is found in a number of analgesics. Figure A The caffeine content of some common foods and drugs is summarized in Table 1. Table 1. Caffeine Content of Common Food and Drugs Coffee 80 - 125 mg/cup Coffee, decaffeinated 2 - 4 mg/cup Tea 30 -75 mg/cup Cola 35 - 60 mg/12 oz No-Doz 100 mg/tablet TEACHER REFERENCE PAGES-CAFFEINE EXTRACTION LAB Chemistry Caffeine Lab, Page 7 4/26/01 Equipment Centrifuge Analytical Balance Supplies 10 Hot plates 10 Lab service dishes (purple) 10 Centrifuge tubes Tea bags 10 DI Water bottles Pasteur Pipets 10 10 mL Glass Pipets 10 Pipet pumps 10 100 mL Glass Beakers 10 50 mL Glass Beakers Vials 1M Na2CO3 Vials Na2SO4 Vials 1,1,1-Trichloroethane 100 Vials, empty 10 Stirring rods 2 Large hot plates 2 Large Aluminum pans for sand baths
  • 10. Awad N Albalwi 3343297 Sand Foil Ice Kimwipes Purpose To extract and measure the caffeine in a tea bag. Key Words These terms should be clear to students before running the lab: Sublimation, Extraction, Purification, Alkaloid, Caffeine, Decaffeinated. TEACHER REFERENCE PAGES-CAFFEINE EXTRACTION LAB Chemistry Caffeine Lab, Page 8 4/26/01 Procedure Refer to student handout for procedure. The sodium carbonate solution is used instead of water because caffeine is more soluble in it. Reducing the volume to less than 10 mL is step 4 is important because the centrifuge tubes only hold 12 mL. Students will add 3 mL of solvent and then use a Pasteur pipette to remove liquid, and too much liquid will overflow the tubes. It is best to have only 6-8 mL of concentrated solution in order to obtain the maximum caffeine and to ease the extraction procedure. Caution students regarding step 5 and the release of pressure in the vial. If the mixture in this step is shaken too vigorously, it may spew out when pressure is released, or an emulsion may form, making the extraction step more difficult. Make certain that the centrifuge is balanced by equally distributing centrifuge tubes. Demonstrate the technique for step 7. The lab may be stopped after step 10 and continued the next day if necessary. The sodium sulfate in step 11 is used to remove any water remaining in the 1,1,1-TCE extract. Due to moisture contamination and condensation, the mass of a beaker at room temperature will be different from one which is cooled by ice or heated on the hot plate. All efforts should be made to compare masses of beakers with and without caffeine at the same temperature. The ideal solvent for this extraction of caffeine is methylene chloride, but that chemical is not permitted in high school classrooms. 1,1,1-TCE is not as good a solvent for caffeine, but it does successfully demonstrate the techniques of this lab. Questions 1. What is the solubility of caffeine in water? In 1,1,1 trichloroethane? solubility in water: 22 mg/mL @ 25C, 180 mg/mL @ 80C, and 670 mg/mL @ 100C, somewhat soluble in 1,1,1-trichloroethane (teachers, we’re trying to determine the precise solubility. If any one knows, please let us know.) 2. Why is 1,1,1 trichloroethane a better solvent for this extraction than water? the tannins, etc. are not soluble in it. (Teachers, we usually would expect to use a solvent which would dissolve more of the caffeine, and that improved solubility would be another reason. In this case, that is not true.) TEACHER REFERENCE PAGES-CAFFEINE EXTRACTION LAB Chemistry Caffeine Lab, Page 9 4/26/01
  • 11. Awad N Albalwi 3343297 3. How does sublimation differ from vaporization? substance goes directly from a solid to a gas, not from a solid to a liquid and then to a gas 4. What was the purpose of the sublimation step of this lab? to remove the caffeine from the pigments and other impurities 5. Based on your knowledge of caffeine explain the reasons for this concern and possible effects on the body. excess known to cause birth defects 6. In your local grocery store you will find decaffeinated coffee and tea. Based on what you learned in this experiment propose a method by which the decaffeination process occurs. extraction with solvents such as 1,1,1-trichloroethane or methylene chloride. Current common commercial process involves extraction with liquid carbon dioxide (under pressure). also "Swiss water process" References 1. L. F. Fieser and K. L. Williamson, Organic Experiments, 6/e, D. C. Heath and Co., Lexington, MA, 1987. 2. D. L. Pavia, G. M. Lampman, G. S. Kriz, R. G. Engel, Introduction to Organic Laboratory Techniques, A Microscale Approach, Saunders College Publications, San Francisco, 1990.
  • 12. Awad N Albalwi 3343297 No. of points x (mg/L) y (Peak Area) xy x^2 d d^2 6 0 0 0 0 -803.667 645880.1 20 95642 1912840 400 -1502.27 2256805 40 195612 7824480 1600 2127.133 4524696 60 287027 17221620 3600 -2798.47 7831416 80 395409 31632720 6400 9242.933 85431817 100 476241 47624100 10000 -6265.67 39258579 0 0 0 0 0 0 0 0 0 0 0 0 Benzoic 0 0 0 0 0 0 0 0 0 0 0 0 0 0 0 0 0 0 0 0 0 0 0 0 0 0 0 0 0 0 0 0 0 0 0 0 Sums 300 1449931 1.06E+08 22000 7.37E-11 1.4E+08 +/- S.d. (y) 5915.006 D= 42000 m= 4817.03 70.697846 b = 803.6667 4280.9672 Measured y 100000 Measured 1 times Calc. X 20.59284 1.3947794
  • 13. Awad N Albalwi 3343297 No. of points x (mg/L) y (Peak Area) xy x^2 d d^2 6 0 0 0 0 -7352.38 54057506 20 418983 8379660 400 1981.105 3924776 40 831018 33240720 1600 4366.59 19067112 60 1224027 73441620 3600 -12273.9 1.51E+08 80 1686236 1.35E+08 6400 40285.56 1.62E+09 100 2028593 2.03E+08 10000 -27007 7.29E+08 0 0 0 0 0 0 0 0 Caffein 0 0 0 0 0 0 0 0 0 0 0 0 0 0 0 0 0 0 0 0 0 0 0 0 0 0 0 0 0 0 0 0 0 0 0 0 0 0 0 0 Sums 300 6188857 4.53E+08 22000 -3.3E-10 2.58E+09 +/- S.d. (y) 25396.85 D= 42000 m= 20482.48 303.55045 b = 7352.381 18380.893 Measured y Measured 1 times Calc. X #VALUE! #VALUE!
  • 14. Awad N Albalwi 3343297 No. of points x (mg/L) y (Peak Area) xy x^2 d d^2 6 0 0 0 0 16466.57 2.71E+08 20 91184 1823680 400 -4019.66 16157644 40 187954 7518160 1600 -18919.9 3.58E+08 60 283020 16981200 3600 -35524.1 1.26E+09 80 491768 39341440 6400 61553.66 3.79E+09 100 522328 52232800 10000 -19556.6 3.82E+08 0 0 0 0 0 0 0 0 Saccharin 0 0 0 0 0 0 0 0 0 0 0 0 0 0 0 0 0 0 0 0 0 0 0 0 0 0 0 0 0 0 0 0 0 0 0 0 0 0 0 0 Sums 300 1576254 1.18E+08 22000 -1.2E-10 6.08E+09 +/- S.d. (y) 38982.5 D= 42000 m= 5583.511 465.93004 b = -16466.6 28213.465 Measured y Measured 1 times Calc. X #VALUE! #VALUE!
  • 15. Awad N Albalwi 3343297