Business Model Canvas (BMC)- A new venture concept
Ariba Knowledge Nuggets: Procurement Reporting
1. Ariba Procurement Reporting
Ariba Knowledge Nuggets OOTB — Out of the box or prepackaged reports are available within your Ariba
Procurement application. The description of each prepackaged report includes a list
of the data elements used in the report. These default analytical, parameterized, and
compound reports are delivered with Reporting and Analysis as a basis for your own
customization or adaptation for your particular company’s needs. The reports are
grouped into folders by area, for example, Purchase Order Reports. Within the
Purchase Order Reports folder are reports relating to purchase order activity.
The reports that are available to you, and the fields that are available in those reports,
depend upon your company’s Ariba Spend Management solution configuration.
Today, I will cover report options in the default configuration. The best way to become
familiar with the reports is to work with them. In addition to the standard data fields
associated with each of the supplied facts, many of the reports contain user-defined
fields based on these data fields. In some reports, the data has been constrained to
illustrate a type of analytical report. For example, sometimes unclassified data has
been excluded from the pivot table view for easier recognition of other trends. So,
while these are out of the box or OOTB, there is an element of customization to fit your
particular reporting needs.
Reports are useful to gauge adoption, usage, and results. These tips, tricks,
suggestions and best practices are designed to help you get the most from your Ariba
solutions, achieve organizational success and elevate your procurement program to
best-in-class.
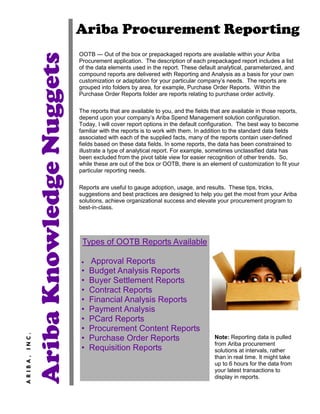
Types of OOTB Reports Available
• Approval Reports
• Budget Analysis Reports
• Buyer Settlement Reports
• Contract Reports
• Financial Analysis Reports
• Payment Analysis
• PCard Reports
• Procurement Content Reports
ARIBA, INC.
• Purchase Order Reports Note: Reporting data is pulled
from Ariba procurement
• Requisition Reports solutions at intervals, rather
than in real time. It might take
up to 6 hours for the data from
your latest transactions to
display in reports.
2. Approval Reports
Run this report... To see this data…
Approval History A detailed history of all approvals (including denials) from all completed approvables,
such as requisitions, invoices, travel authorizations, and so forth. This report displays
approval completed (approval history) approvable counts by approvable ID, approvable
title, approvable type, approvable status, action date, approved by user, approver,
reason, and state in detail view, filtered by submit date. Drill down or filter further by
approvable status, approvable type, and approved by user.
Pending Approval A detailed report of all approvals that are in process. This report displays pending
approvable counts by approvable ID, title approvable type, approver, signed date, and
reason in detail view, filtered by submit date. Drill down or filter further by approvable
status and approvable type.
Budget Analysis Reports
Run this report... To see this data…
Budget Analysis Budgeted and transaction amounts, and remaining available funds, for all budget items.
This report displays budget amount, transaction amount, and funds available amount by
budget code, document number, transaction date, transaction type, action, transaction
line number, transaction split line number, and asset, filtered by calendar transaction
date in detail view. Drill down or filter data further by accounting company, purchasing
company, department, fiscal year, account ID, period, budget start date, and budget end
date.
Buyer Settlement Reports
Run this report... To see this data…
Commodity Analysis A comprehensive analysis of spend by commodity. Begin with the big picture, and
identify spend amounts, number of suppliers, number of items, commodities, etc.
Identify areas of savings opportunities and drill into the details to review detailed item-
level information to aid in your savings opportunity identification and sourcing strategic
decisions. This report displays invoice spend for top-level commodity categories by
invoice quarter in aggregate view. Drill down or filter data further by supplier, company,
company code, invoice date, contract, line type, part name, region, and unit of measure.
Invoice Accrual Report Invoice spend for each supplier. The report displays a detail view of invoice spend in US
dollars and the original currency for suppliers, invoice IDs, account IDs, and department
or cost center IDs with invoice number, accounting date, ERP supplier, and original cur
rency code. Drill down or filter data further by business unit ID and reconciliation status;
by default, invoices with Paying and Paid reconciliation status are excluded.
Invoice Summary Report Invoice amounts and counts for each supplier, grouped by status. The report displays an
aggregate view of amount invoiced, amount accepted, amount disputed, and invoice
count for business unit IDs, suppliers, invoice status, and reconciliation status.
Invoice Summary Report by Contract Invoice amounts and counts for each contract and supplier. The report displays a detail
view of amount invoiced, amount accepted, amount disputed, and invoice count for
contract IDs and suppliers with business unit ID, invoice ID, invoice status, invoice date,
and reconciliation status.
Order Liability Report Purchase orders that have not yet been fully invoiced for each supplier and purchasing
business unit. The report displays a detail view of PO spend, total amount left to invoice,
and total amount left to reconcile for suppliers and business unit IDs with PO ID, ordered
date, requester, ERP supplier, account ID, and department or cost center ID.
Purchase Price Variance by Commodity Commodity price variances. Commodity managers can use it to drill deeper by
commodity and part into their supply base to analyze minimum, maximum and unit prices
and quantities per part to identify savings opportunities. This report displays invoice
spend, count, and price variance cost for top-level commodity categories in aggregate
view. Drill down or filter data further by account, supplier, commodity, company code,
invoice date, contract, line type, part name, region, and unit of measure.
3. Buyer Settlement Reports
Run this report... To see this data…
Spend Concentration Analysis by Commodity Commodity spend at the part level, including the total number of parts
purchased and average spend per part. Commodities with large spend on a
small number of parts often enable greater sourcing savings. Drill into deeper
levels of commodities with large number of parts as one of the inputs in your
sourcing opportunity analysis. This report displays invoice line count and
average invoice spend per part for top-level commodity categories in aggregate
view. Drill down or filter data further by account, supplier, company code,
contract, line type, part name, and region.
Important To Know
All analytical reporting in any Ariba solution is based upon fact tables
• Fact tables contain all of the information a user wants to report on
• What fact tables are available depends on the solutions
Fact tables are made up of
• Dimensions – Information about a business
• Measurements – Numerical data that contains measurable information about the fact
Reports in Ariba are based upon Microsoft Excel pivot tables
• After a report has been created it can be further modified by “pivoting” on any dimensional information
Reports are built around the numerical measurements with dimensions providing the associated business
information
4. Contract Reports
Run this report... To see this data…
Contract Days Left Contracts that have not yet expired, grouped by number of days left until expiration.
This report displays a detail view of contracts by duration (in months) with contract ID,
parent contract, status, supplier, contact, effective date, expiry, and days left.
Contract By Amount Left Contracts that have remaining amounts that can be purchased against them, grouped by
the percentage of amount remaining. This report displays a detail view of contract
cumulated amount ordered, maximum commitment, and remaining amount percentage
with contract ID, parent contract, status, contact, effective date, expiration date, and
expiry. Drill down or filter data further by supplier and contract release type; by default,
the report only displays contracts of type Release.
Contract By Invoiceable Amount Left Contracts that have remaining invoiceable amounts that can be invoiced against them,
grouped by the percentage of invoiceable amount remaining. This report displays a
detail view of contract cumulated amount reconciled, cumulated amount invoiced,
maximum commitment, and remaining reconcilable amount percentage with contract ID,
parent contract, status, supplier, contact, effective date, expiration date, and expiry. Drill
down or filter data further by supplier and contract release type; by default, the report
only displays contracts of type Release.
Contract By Reconcilable Amount Left Contracts that have remaining amounts that can be reconciled against them, grouped by
the percentage of reconcilable amount remaining. This report displays a detail view of
contract remaining reconcilable amount percentage, cumulated amount reconciled,
cumulated amount invoiced, and maximum commitment with contract ID, parent
contract, status, supplier, contact, effective date, expiration date, and expiry. Drill down
or filter data further by supplier and contract release type; by default, the report only
displays contracts of type No Release.
Contract Line By Amount Left Contract line items that still have remaining amounts that can be purchased against
them, grouped by the percentage of amount remaining. This report displays a detail
view of contract line item amount ordered left percentage, amount ordered, amount
ordered left, quantity ordered, quantity ordered left maximum amount, and maximum
quantity with contract ID, supplier, supplier part number, and description. Drill down or
filter data further by contract release type; by default, the report only displays contracts of
type Release.
You can't manage
what you don't
measure. It is an old
management adage
that is accurate today.
Unless you measure
something you don't
know if it is getting
better or worse. You
can't manage for
improvement if you
don't measure to see
what is getting better
and what isn't.
5. Contract Reports
Run this report... To see this data…
Contract Line By Quantity Left Contract line items that still have remaining quantities that can be purchased against
them, grouped by the percentage of quantity remaining. This report displays a detail
view of contract line item remaining quantity ordered percentage, amount ordered,
remaining amount ordered, quantity ordered, remaining quantity ordered, maximum
amount, and maximum quantity with contract ID, supplier, supplier part number, and
description. Drill down or filter data further by contract release type; by default, the
report only displays contracts of type Release.
Contract Line By Receivable Amount Left Contract line items that still have remaining amounts that can be received against them,
grouped by the percentage of amount receivable remaining. This report displays a detail
view of contract line item remaining amount receivable percentage, amount received,
remaining amount receivable, quantity received, remaining quantity receivable, maxi
mum amount, and maximum quantity with contract ID, supplier, supplier part name, and
description. Drill down or filter data further by contract release type; by default, the
report only displays contracts of type No Release.
Contract Line By Receivable Quantity Contract line items that still have remaining quantities that can be received against them,
Left grouped by the percentage of quantity receivable remaining. This report displays a detail
view of contract line item remaining quantity receivable percentage, amount received,
remaining amount receivable, quantity received, remaining quantity receivable, maxi
mum amount, and maximum quantity with contract ID, supplier, supplier part number,
and description. Drill down or filter data further by contract release type; by default, the
report only displays contracts of type No Release.
Contract Line By Reconcilable Contract line items that still have remaining amounts that can be reconciled against
Amount Left them, grouped by the percentage of amount reconcilable remaining. This report displays
a detail view of each contract line item’s contract, remaining amount reconciled percent
age, amount reconciled, remaining amount reconcilable, quantity reconciled, remaining
quantity reconcilable, maximum amount, and maximum quantity with supplier, supplier
part number, and description.
Contract Line By Reconcilable Contract line items that still have remaining quantities that can be reconciled against
Quantity Left them, grouped by the percentage of quantity reconcilable remaining. This report
displays a detail view of each contract line item’s contract, remaining quantity reconcile
able percentage, amount reconciled, remaining amount reconcilable, quantity reconciled,
remaining quantity reconcilable, maximum amount, and maximum quantity with supplier,
supplier part number, and description.
Best Practice Tip
It is important that you
communicate your metrics
both up and down the
organization.
Your boss wants to know
what's going on, but your
employees need to know
also. They are not motivated
to improve unless they know
how they are doing.
In addition, most of the
suggestions on how to
improve will come from them.
6. Financial Reports
Run this report... To see this data…
Financial Analysis Report Lists invoice spend by supplier. Analyze spend by supplier to find suppliers who sell to
different business units within your company at different prices, and aggregate total
spend into one contract. This report displays financial transaction data for reference
document line amount, invoiced amount, and received amount for suppliers, transaction
dates, supplier IDs, supplier locations, event types, transaction document numbers,
transaction document line numbers, transaction document line unit prices, transaction
document line quantities, reference document currencies, reference document numbers,
reference document line numbers, reference document split line numbers, reference
document line quantities, commodity IDs, account IDs, department IDs, and reference
document line amounts in detail view. Drill down or filter data further by transaction date.
By default, the report only displays transactions that were carried out in the past 6
months.
Best Practice Tip
Review your
metrics and use
them to guide
your decisions.
With your metrics in
place, you can tell which
strategies are working
and which aren't. If you
make a change, you use
the metrics to tell you
whether the change
improved things or not.
Payment Analysis
Run this report... To see this data…
Lost Payment Discount by Supplier Lists invoice payments and lost discounts for suppliers. Gain visibility into your top
vendors where your company has missed most of the available payment discounts. Link
the discount lost to the respective vendor's invoicing performance to diagnose the
potential causes of such losses by analyzing total invoice amount, invoice exception
count and early payment discount lost with that supplier within this single report. This
report displays invoice spend, invoice payment paid amount, invoice exception invoice
count, and discount lost for suppliers in aggregate view. Drill down or filter data further
by supplier and calendar accounting date.
Payment Discount Earned vs. Lost Lists maximum possible discount and actual earned discount for invoice payments.
Track whether vendor early payment discounts have been effectively captured during
payment process by analyzing the maximum payment discounts available and the actual
discount amount captured. Report also provides details on whether the discounts are
earned within terms specified or outside terms. This report displays invoice payment
maximum discount and earned discount for discount terms in aggregate view. Drill down
or filter data further by discount term, calendar payment date, and supplier. By default,
this report excludes data for the No Discount Available and To Be Paid discount terms.
7. Payment Analysis Reports (con’t)
Run this report... To see this data…
Payment Forecast Lists on hold, pending, and scheduled payments by amount, available discount, and
invoice count. Track future payments and discounts by analyzing the to pay amount an
the maximum payment discount available (by terms), especially with the ability to
forecast pending payments and discounts for invoices that have not yet been approved.
This report displays invoice payment amount, maximum discount, and invoice count for
payment status by payment created quarter in aggregate view. Drill down or filter data
further by payment status, created date, discount terms, net terms, payable status,
calendar payment date, and supplier. By default, this report excludes payments with Paid
status.
Payment Performance Lists payment amounts per net term by payment date. Monitor overall vendor payment
performance over time by analyzing payments that are made within net terms and
payments that are outside net terms. Further drill down by supplier to identify
opportunities to improve vendor relations by paying vendors on time. This report
displays invoice payment amounts for payment terms by calendar payment date in
aggregate view. Drill down or filter data further by payment date, terms, payable status,
status, and supplier.
P Card Reports
Run this report... To see this data…
Charges Load Report Purchase card charge loads, grouped by loaded date, purchase card number, and
reconcile approvable. This report displays a detail view of purchase card charge load
base amounts with loaded date, PCard number, reconcile approvable ID, supplier name,
approvable type, charge status, transaction date, PCard holder, and charge ID.
PCard Charge Reconciliation Report Approvable purchase card charge amounts, grouped by PCO # and reconcile
approvable status. This report displays a detail view of purchase card charge amount
and tax amounts with PCO #, reconcile approvable status, reconcile approvable ID,
reconcile approvable ID line number, PCard number, transaction date, loaded date, and
description. Drill down or filter data further by approvable type and reconcile approvable
ID; by default, the report only displays PCard charges of type Procure.
P Card Best Practice Tips
1. Secure senior management support while involving
key players.
2. Establish checks and balances.
3. Establish consistent policies across the organization.
4. Mandate training for cardholders and card managers
before a card is issued.
5. Establish protective controls up front.
6. Use technology to streamline back-end auditing.
7. Audit beyond the traditional.
8. Foster positive relationships with cardholders.
9. Conduct periodic peer reviews before official audits
occur.
10. Network to gain new ideas.
Based upon JPMorgan PCard Survey:
8. Procurement Content Reports
Run this report... To see this data…
Catalog Aggregation A summary of catalog content by supplier and commodity. This report displays an
aggregate view of catalog item count for suppliers and top-level commodity categories.
Checkout Summary A summary of checkout requisition data for catalog items. This report displays a detail
view of requisition quantity, unit price, and spend by supplier, top-level commodity
category, and manufacturer, with unit of measure, cost center or department, description,
requisition line number, and requester. Drill down or filter data further by business unit
ID.
Catalog vs. Non-Catalog Items A comparison of catalog and non-catalog checked out commodities at the requisition line
level. This report displays a detail view of requisition spend and line count by line type
and top-level commodity category with unit of measure, cost center or department,
requisition line number, requisition ID, and requisition date. Drill down or filter data
further by business unit ID, supplier, and manufacturer.
Top Items Purchased by PunchOut vs. A comparison of how many requisition lines are for punched out versus contained items,
Contained with details of those requisition lines. This report displays a detail view of requisition line
counts for punched out and contained items and top level commodity categories with unit
of measure, cost center or department, description, requisition ID, and requisition date.
Drill down or filter data further by business unit ID, supplier, and manufacturer.
Total Number of Items Purchased An overview of the number of requisition lines for each commodity, with details of those
requisition lines. This report displays a detail view of requisition line counts by top level
commodity category with unit of measure, cost center or department, description,
requester, requisition ID, requisition line number, and requisition date. Drill down or filter
data further by business unit ID, supplier, and manufacturer.
Best Practice Tip for e-Catalog Success
• A successful catalog technical lead will need to have the skills required
to understand content requirements, educate suppliers on these
requirements, cleanse and manipulate large amounts of catalog data,
and troubleshoot technical errors that may occur during the enablement.
• Depending on your industry, services can be one of the largest spend
categories and is often overlooked.
• According to Aberdeen, Best-in-class organizations do at least 74
percent of their buying through an eCatalog.
• The time from catalog upload to availability in production is less than
three days at a best-in-class organization.
9. Purchase Order Reports
Run this report... To see this data…
Catalog vs. Non-Catalog Ordered Items A comparison of catalog and non-catalog commodities in purchase orders. This report
displays a detail view of purchase order spend and line counts by line type and top-level
commodity category with unit of measure, cost center or department, description, PO line
number, PO status, PO ID, user, and ordered date. Drill down or filter data further by
business unit ID, supplier, and manufacturer.
Order Details by Commodity and Supplier Purchase orders, grouped by commodity, supplier, and purchasing business unit.
Identifies what items your company is ordering, from which suppliers, and which parts
of the company are placing the orders. This report displays a detail view of PO unit
price, quantity, and spend by top-level (L1) commodity category, supplier, and business
unit ID, with unit of measure, department or cost center, description, PO line number, PO
status, ordered date, and PO ID.
Order Summary by Commodity Purchase orders, grouped by commodity and supplier. Provides a basic view of what
commodities your company is ordering and from which suppliers. This report displays a
detail view of PO spend by top-level (L1) commodity categories and suppliers, with
ordered date, description, PO status, and PO ID. Drill down or filter data further by
business unit ID.
Order Summary by Contract and Purchase orders, grouped by contract and commodity. Provides a basic view of the
Commodity contracts your company is purchasing against and what items are being ordered. This
report displays a detail view of PO spend by contract ID and top-level (L1)
commodity category, with ordered date, description, PO status, PO ID, and supplier.
Order Summary by Contract and Purchase orders, grouped by contract and department or cost center. Provides a basic
Department or Cost Center view of the contracts your company is purchasing against and which parts of your
company are placing the orders. This report displays a detail view of PO spend by
contract and department or cost center, with ordered date, PO status, PO ID, and
supplier. Drill down or filter data further by business unit ID.
Order Summary by Department or Purchase orders, grouped by department or cost center, commodity, and supplier.
Cost Center Provides a basic view of which parts of your company are placing orders, what items
they are purchasing, and from which suppliers. This report displays a detail view of PO
spend by department or cost center, top-level (L1) commodity category, and supplier,
with ordered date, PO status, and PO ID. Drill down or filter data further by business
unit ID.
Order Summary by Supplier Purchase orders, grouped by supplier, department or cost center, and commodity.
Provides a basic view of which suppliers your company is purchasing from, which parts
of your company are placing the orders, and what items they are purchasing. This report
displays a detail view of PO spend by supplier, department or cost center, and op-level
(L1) commodity category, with ordered date, PO status, and PO ID. Drill down or filter
data further by business unit ID.
Orders by Commodity and Department Purchase orders grouped by commodity and department or cost center. Provides a
detailed view of what items your company is purchasing and which parts of the company
are placing the orders. This report displays a detail view of PO quantity, unit price, and
spend by top-level (L1) commodity category and department or cost center, with unit of
measure, supplier, description, PO line number, ordered date, PO status, and PO ID.
Drill down or filter data further by business unit ID.
Orders Overview Purchase orders, grouped by supplier. Provides a high-level overview of the purchase
orders placed with each supplier. This report displays an aggregate view of PO count,
spend, and average spend by supplier. Drill down or filter data further by purchasing
company business unit ID.
10. Purchase Order Reports (con’t)
Run this report... To see this data…
PCard Order Details Purchase orders, grouped by PCard number and holder. Identifies which PCards are
responsible for purchase orders and who holds those cards. This report displays a detail
view of PO spend by PCard number and holder, with PCard expiration date, PO ID, PO
status, ordered date, supplier, PO line number, and department or cost center.
Purchase Order Activity Purchase orders, grouped by line type. Provides a high-level view of catalog vs. non-
catalog purchase order spend; drill down and filter data further to identify where the
non-catalog purchase order spend is coming from. This report displays an aggregate
view of PO spend, counts, and line counts by line type (catalog vs. non-catalog). Drill
down or filter data further by business unit ID and ordered date. Use the detail view to
examine PO ID, ordered date, requester, ERP supplier, account ID, account, department
or cost center ID, department or cost center, accounting company GL business unit, and
business unit ID.
Purchase Price Variance by Commodity Commodities and price variance data, to help you understand the impact of price
variance on your company’s spend. This report displays an aggregate view of PO
spend, price variance cost and percentage, and PO count for top-level commodity
categories. Drill down or filter data further by commodity, ordered date, supplier,
company, account, company code, part name, unit of measure, contract, IsPunchOut
Item, and line type.
Requisition Total by Supplier Purchase orders, grouped by supplier. Provides a high-level view of purchase order
spend with each supplier. This report displays an aggregate view of PO spend and line
counts by supplier. Drill down or filter data further by business unit ID.
Spend Concentration Analysis by An overview of how many purchase order lines account for spend on each part in
Commodity commodity categories. This report displays an aggregate view of PO total line count and
average spend per part by top-level commodity category. Drill down or filter data further
by supplier, company code, part name, contract, IsPunchOut Item, and line type.
Spend Penetration by Commodity An overview of commodity spend by quarter. This report displays an aggregate view of
PO spend by top-level commodity category for the past eight quarters. Drill down or filter
data further by ordered date, supplier, company code, account, part name, unit of
measure, contract, IsPunchOut Item, and line type.
Top Items Ordered by PunchOut vs. A comparison of how many purchase order lines are for PunchOut versus contained
Contained items, with details of those purchase order lines. This report displays a detail view of
purchase order line counts for punched out and contained items and top level commodity
categories with unit of measure, cost center or department, description, PO line number,
PO status, ordered date, and PO ID. Drill down or filter data further by business unit ID,
supplier, and manufacturer.
Total Number of Items Ordered An overview of the number of purchase order lines for each commodity, with details of
those purchase order lines. This report displays a detail view of purchase order line
counts by top level commodity category with unit of measure, cost center or department,
description, PO line number, PO status, ordered date, and user. Drill down or filter data
further by business unit ID, supplier, and manufacturer.
11. Requisition Reports
Run this report... To see this data…
Commodity Details Requisitions, grouped by commodity. Provides a detailed view of what items your
company is requisitioning. This report displays a detail view of requisition quantity, unit
price, and spend by top-level (L1) commodity category, with unit of measure and
requisition ID.
Department or Cost Center Details Requisitions, grouped by business unit, department or cost center, and commodity.
Provides a detailed view of which parts of your company are generating requisitions and
what items they are requisitioning. This report displays a detail view of requisition
quantity, unit price, and spend by business unit ID, department or cost center, and
top-level (L1) commodity, with unit of measure and department or cost center.
Requisition Detail A list of requisitions with both header and line item information. Provides a detailed view
of all of your company’s requisitions. Filter on any of the non-total columns to narrow
down the data the report displays. This report displays a detail view of requisition
quantity, unit price, and spend with unit of measure, department or cost center, supplier,
description, PO ID, requisition line number, requisition date, requisition status, requester,
requisition title, and requisition ID.
Requisition Summary A list of requisitions. Provides a basic view of all of your company’s requisitions. Filter on
any of the non-total columns to narrow down the data the report displays. This report
displays a detail view of requisition spend with requisition status, requisition date,
requisition title, preparer, requester, and requisition ID.
Supplier Details Requisitions, grouped by supplier and commodity. Provides a detailed view of which
suppliers your company is generating requisitions with and what items they are for. This
report displays a detail view of requisition quantity, unit price, and spend by supplier and
top-level (L1) commodity category, with unit of measure, description, and requisition ID.
Requisition Approval Cycle Time
Requesters with the Longest Requests, grouped by requester. Identifies the requesters whose requisitions take the
Approval Time longest to approve or deny requests. This report displays a detail view of request
approval time, count, number of approvers, and approver approval time by requester,
with request ID, type, status, and submitted date. Drill down or filter data further by
approved/denied date and status; by default, the report only displays requests with
Approved or Denied status.
Requisition Approval Time by Approval data for requests. Identifies which departments are taking the longest to
Originating Document approve or deny requests. This report displays an aggregate view of request approval
time, approver approval time, number of approvers, request count, and average requisi
tion amount. Drill down or filter data further by requesting management or users, status,
and type. Use the detail view to examine request ID, type, status, and submitted date. By
default, the report only display requests with Approved or Denied status.
Requisition Approval Time by Size Approval data for requests. Provides an overview of requisition approval efficiency and
of Requisition helps you determine whether the size of a requisition is related to its approval cycle time.
This report displays an aggregate view of request approval time, number of approvers,
approver approval time, and request count. Drill down or filter data further by
approved/denied date, requesting management or users, status, and type. Use the detail
view to examine request ID, type, status, and submitted date.
12. User Activity
Run this report... To see this data…
Active Approvers by Month (XLS) The number of users approving requests in each month. You can export this report with
the associated Excel template. This report displays an aggregate view of the number of
users by submitted/approved month. Drill down or filter data further by activity type,
document type, and user. Use the detail view to examine users, submitted/approved
date, document type, and activity type. By default, the report only displays data for the
Approved activity type.
Active Requisitioners by Month The number of users submitting requisitions in each month. You can export this report
with the associated Excel template. This report displays an aggregate view of the
number of submitters by submitted/approved month. Drill down or filter data further by
activity type, document type, and user. Use the detail view to examine users,
submitted/approved date, document type, and activity type. By default, the report only
displays data for the Submitted activity type and the Requisition document type.