SlideShare ist ein Scribd-Unternehmen logo
1 von 15
ICES Journal of Marine Science, 2022, 0, 1–15
DOI: 10.1093/icesjms/fsac229
Original Article
Effects of fishing on the trophic structure of carnivorous
fish assemblages from shallow rocky bottoms of the
Mediterranean Sea and the temperate Atlantic Ocean
Luis Cardona 1,*
, Olga Reñones2
, Adam Gouraguine3
, Fabiana Saporiti1
, Asunción Borrell 1
,
Alex Aguilar1
and Joan Moranta2
1
IRBio and Department of Evolutionary Biology, Ecology and Environmental Science, Faculty of Biology, University of Barcelona, Barcelona
08028, Spain
2
Instituto Español de Oceanografía (IEO, CSIC), Centre Oceanogràfic de Balears, Ecosystem Oceanography Group (GRECO), Palma 07015,
Spain
3
School of Natural and Environmental Sciences, Newcastle University, Newcastle-Upon-Tyne NE1 7RU, UK
*Corresponding author: tel:+34934031368; e-mail: luis.cardona@ub.edu.
Here, we assess whether fishery exploitation affects the trophic structure of carnivorous fish. We censused fish and analysed the stable isotope
ratios of C and N of species targeted by fishermen in areas open to fishing and marine protected areas (MPAs) in the Mediterranean Sea and
the north-eastern Atlantic Ocean. Results demonstrated a major impact of fishing on the biomass and size structure of nektobenthic carnivorous
fish. However, those changes did not modify the diversity of the trophic resources used by the assemblage, the pattern of resource partitioning
between species, or the degree of trophic redundancy. These results add to recent evidence suggesting that MPAs implemented in fished
seascapes may fail to restore the original structure of the food webs that once existed in pre-fished ecosystems because regional decimation
and extinction of highly mobile predators prevent recovering the original diversity of predators at local scales, even in no-take areas. If so,
more strict local fishing regulations are unlikely to restore the original diversity of high trophic level carnivores and restoration goals should be
reframed in terms of an objective that is less unrealistic than restoring the pre-fished condition while still recovering aspects of the historical
trophic structure.
Keywords: fishing, food web structure, marine protected areas, predation, stable isotope analysis.
Introduction
Fishing has had a profound effect on the biomass of carni-
vores in most marine ecosystems worldwide (McCauley et
al., 2015). As a result, the functional role of carnivores in
present-day fishery-driven ecosystems has been largely sup-
pressed (Estes et al., 2011; Roff et al., 2016; Hammerschlag
et al., 2019). Remaining predatory interactions are greatly re-
duced compared to those occurring prior to industrial fishing
(Cheng et al., 2019; Eger and Baum, 2020), and the structure
of marine food webs has been profoundly altered (Frank et
al., 2005; Myers et al., 2007; Heithaus et al., 2012), a change
that often started well before the monitoring of fishing impact
(Saporiti et al., 2014; Bas et al., 2019; Ólafsdóttir et al., 2021).
Marine protected areas (MPAs) are the primary manage-
ment tool of marine conservation and have been proposed
to restore the original structure and functioning of marine
ecosystems (Sandin et al., 2008; Lamb and Johnson, 2010;
Cheng et al., 2019; Eger and Baum, 2020). The restoration
of the size structure of fish populations is one of the ex-
pected benefits of MPAs (Baskett and Barnett, 2015), because
fish live longer, grow larger, and attain higher densities and
biomass within well-managed MPAs (Halpern, 2003; Hilborn
et al., 2004; Baskett and Barnett, 2015). This can in turn
result in increased mortality rates for prey, compared to areas
open to fishing (Cheng et al., 2019; Eger and Baum, 2020),
and may elicit risk avoidance responses, thus modifying the
habitat use patterns of herbivores and mesopredators (Bond
et al., 2019; Hammerschlag et al., 2019). Those changes may
trigger trophic cascades, and assessing their strength has been
the focus of most of the previous research on the so-called
“reserve effect” (Sala et al., 2012; Cheng et al., 2019; Eger
and Baum, 2020).
Gape size and maximum prey body size escalate with body
size in carnivorous fish (Gill, 2003), which results in major
ontogenetic dietary changes in many species (e.g. Reñones et
al., 2002; Olson et al., 2019; Moranta et al., 2020; Olson
et al., 2020). As body size and gape size of carnivorous fish
are expected to increase in MPAs, their diets are expected to
change accordingly, which can result in increased vulnerabil-
ity of large prey species previously unexploited by predators
in areas open to fishing (Hamilton et al., 2014; Olson et al.,
2020). If so, a more diverse size structure at marine reserves
will result in broader trophic niches for individual carnivore
species (Hamilton et al., 2014). Furthermore, prey selectivity
by carnivores is highly dependent on prey availability and car-
nivore satiation (Schoener, 1971; Pulliam, 1974; Werner and
Hall, 1974; Stephens and Krebs, 1986; Gill, 2003) and hence,
the diets of carnivores inhabiting marine reserves may differ
largely from those observed on conspecifics of the same size in-
habiting fishery-driven ecosystems (e.g. Dell et al., 2015; Car-
dona et al., 2020; Moranta et al., 2020; Olson et al., 2020).
All these processes may result in a broader diversity of trophic
resources used by the whole community in MPAs (Olson et al.,
2019) and changes in the topology of the food web (e.g. Li-
Received: August 9, 2022. Revised: November 21, 2022. Accepted: November 28, 2022
C
 The Author(s) 2022. Published by Oxford University Press on behalf of International Council for the Exploration of the Sea. This is an Open Access
article distributed under the terms of the Creative Commons Attribution License (https://creativecommons.org/licenses/by/4.0/), which permits unrestricted
reuse, distribution, and reproduction in any medium, provided the original work is properly cited.
Downloaded
from
https://academic.oup.com/icesjms/advance-article/doi/10.1093/icesjms/fsac229/6962286
by
guest
on
12
February
2023
2 L. Cardona et al.
Figure 1. Map of the study sites in the Mediterranean Sea and the north-eastern Atlantic (central panel). Balearic Islands (right panels): two areas open
to fishing off western Mallorca (OFA; CE: Cala en Basset, DR: Dragonera) and two MPAs at Cabrera National Park (MPA; CR: Coll Roig, ES: Estels).
Galicia (left panel): two areas open to fishing (OFA; PC: Punta Corbeira, IE: Illas Estelas) and two MPAs at Atlantic Islands National Park (MPA; FM: Furna
de Monteagudo, CB: Cabo dos Bicos).
bralato et al., 2010; Fry and Davis, 2015). Nevertheless, some
authors claim that MPAs implemented in fished seascapes can-
not fully restore the diversity of trophic interactions from the
pre-fished ecosystems because only a fraction of the predator
diversity is restored (D’Agata et al., 2016; Roff et al., 2016;
McClanahan et al., 2019).
The stable isotope ratios in animal tissues integrate over
variable time spans those in the diet of the consumer (New-
some et al., 2007; Boeklen et al., 2011; Marshall et al., 2019),
and hence, stable isotope analysis offers a convenient ap-
proach to characterizing the trophic niche of species. The sta-
ble isotope ratio of nitrogen (δ15
N) is a good proxy for the
trophic position of the consumer, while the stable isotope ratio
of carbon (δ13
C) informs about the primary sources of C sup-
porting it (Newsome et al., 2007; Boeklen et al., 2011; Mar-
shall et al., 2019). When represented in the δ13
C–δ15
N space,
or isospace, the bivariated stable isotope ratio of each indi-
vidual species defines an area analogous to the trophic niche,
the so-called isotopic niche. Methods have been developed to
calculate the area of the isotopic niche and the overlap be-
tween species (Jackson et al., 2011; Syväranta et al., 2013),
to describe the diversity of resources used by the whole com-
munity and the degree of trophic redundancy among species
(Layman et al., 2007), and to compare the topology of dif-
ferent communities within the isospace after accounting for
differences in isotopic baselines (Fry and Davis, 2015).
Here, we conducted underwater visual census to assess the
changes caused by fishing on the biomass and structure of car-
nivorous fish inhabiting shallow temperate rocky bottoms in
the Mediterranean Sea and the adjoining Atlantic Ocean and
used the stable isotope ratios of C and N to investigate if re-
source use partitioning between carnivorous fish is sensitive
to those changes.
Material and methods
Site description and experimental design
Sampling was conducted in the Balearic Islands (western
Mediterranean Sea), under permit SEN 265/16, issued by the
Govern de les Illes Balears, and in Galicia (north-eastern At-
lantic Ocean), under permit no. 310/RS 608071, issued by the
Xunta de Galicia. Both permits allowed the capture and sacri-
fice of fish. In the Balearic Islands, the sampling was restricted
to rocky substrates between 5 and 15 m depth in two MPAs lo-
cated within the Cabrera National Park and at two sites open
to commercial and recreational fishing (thereafter OFA, Open
Fishing Area) located off western Mallorca (Figure 1). The
Cabrera National Park is a protected area where recreational
fishing (both angling and spearfishing) has been prohibited
since 1991 and where commercial fishing is completely for-
bidden in a number of no-take reserves, including the two sites
surveyed here in areas shallower than 20 m. Commercial fish-
ing in areas deeper than 20 m is regulated by effort and gear.
By contrast, both commercial and recreational fishing are al-
lowed in the two study sites located off western Mallorca. Pre-
vious research had reported major differences in the structure
of the rocky-reef fish assemblages from Cabrera National Park
and the sites off western Mallorca, and the latter were classi-
fied as fully exploited or overexploited (Coll et al., 2013 and
2020).
In Galicia, the sampling was restricted to subtidal rocky
substrates between 3 and 6 m depth at high tide. The sam-
pling was carried out at two MPA off Cíes Islands, a small
archipelago included in the National Park of the Atlantic Is-
lands of Galicia and at two OFA sites open to commercial
and recreational fishing located at the mouth of the adjoin-
ing Ria de Vigo (Figure 1). Recreational fishing, both angling
Downloaded
from
https://academic.oup.com/icesjms/advance-article/doi/10.1093/icesjms/fsac229/6962286
by
guest
on
12
February
2023
Food web structure in marine protected areas 3
Table 1. Fish censused and sampled at the eight study sites in the Balearic Islands and Galicia.
Species NUVC TLUVC NSIA TLSIA TG
Balearic Islands
Coris julis 299 5–17.5 32 6.9–12.5 CM
Dentex dentex 1 17.5 - - RAP
Diplodus annularis 46 7.5–17.5 - - CM
Diplodus puntazzo 8 27.5–37.5 - - CM
Diplodus sargus 73 12.5–37.5 21 15.7–33.2 CM
Diplodus vulgaris 183 7.5–27.5 21 15.6–25.3 CM
Epinephelus marginatus
(juveniles)
19 12.5–42.5 24 16.8–46.1 RAP
Epinephelus marginatus
(adults)
1 47.5 9 57.2–85.6 RAP
Labrus merula 6 22.5–42.5 - - CM
Labrus viridis 2 37.5–42.5 - - RAP
Mullus surmuletus 5 7.5–32.5 - - CM
Sciaena umbra 4 37.5–42.5 - - CM
Seriola spp. 2 42.5 - - RAP
Serranus cabrilla 4 12.5–22.5 27 11.7–18.2 CM
Serranus scriba 84 7.5–22.5 32 12.4–17.6 CM
Shpyraena spp. 49 42.5–47.5 - - RAP
Spondyliosoma cantharus 51 12.5–27.5 21 10.9–21.5 CM
Symphodus mediterraneus 14 7.5–12.5 - - CM
Symphodus melanocercus 1 7.5 - - CM
Symphodus ocellatus 28 5–12.5 - - CM
Symphodus roissalli 3 7.5–12.5 - - CM
Symphodus rostratus 3 7.5–12.5 - - CM
Symphodus tinca 90 5–27.5 21 11–24.2 CM
Thalassoma pavo 90 5–17.5 - - CM
Galicia - -
Centrolabrus exoletus 3 12.5 23 3.8–10.4 CM
Coris julis 1 22.5 - - CM
Dicentrarchus labrax 0 - 20 32.7–42.2 RAP
Diplodus sargus 19 12.5–37.5 22 19.7–36.3 CM
Diplodus vulgaris 253 5.0–27.5 22 11.9–28.1 CM
Gobisculus flavescens - - 23 5.5–6.0 CM
Labrus bergylta (plain
morph)
157 7.5–52.5 32 15.8–37.0 CM
Labrus bergylta (spotted
morph)
23 7.5–52.5 32 16.4–41.7 CM
Symphodus melops 299 5–27.5 32 10.8–20.6 CM
Species, number of individuals recorded during a visual census (NUVC) and their length range (TLUVC), number of individuals sampled for stable isotope
analysis (NSIA) and their length range (TLSIA), and the trophic guild (TG). CM: mesophagous carnivores. RAP: roving/ambush predatory). UVC: underwater
visual census; SIA: stable isotope analysis.
Table 2. Environmental characteristics (± standard error) at the four study sites in the Balearic Islands (Marine Protected Areas—MPA—in Cabrera, CR:
Coll Roig and ES: Estels; Open Fishing Areas—OFA—in Mallorca, CE: Cala en Basset and DR: Dragonera) and Galicia (Marine Protected Areas—MPA—in
Cíes Islands, FM: Furna de Monteagudo and CB: Cabo dos Bicos; Open Fishing Areas—OFA—in Ria de Vigo, PC: Punta Corbeira and IE: Illas Estelas).
MPA OFA
Balearic Islands CR ES CE DR
Depth (m) 13.5 ± 0.9 14.4 ± 1.2 9.8 ± 0.8 11.3 ± 0.5
Roughness 2.4 ± 0.3 2.6 ± 0.2 2.2 ± 0.4 3.0 ± 0.2
Boulder (%) 58.6 ± 13.9 77.3 ± 8.1 55.5 ± 13.2 80.3 ± 13.0
Wave Exposure Low High Low High
Galicia FM CB PC IE
Depth (m) 4.4 ± 1.4 4.4 ± 0.2 4.5 ± 0.8 3.6 ± 0.9
Roughness 2.1 ± 0.8 3.1 ± 0.3 1.8 ± 0.3 1.9 ± 0.3
Boulder (%) 43.5 ± 12.9 92.5 ± 15.0 56.3 ± 9.7 63.0 ± 12.7
Wave Exposure Low High Low High
and spearfishing, has been forbidden in areas shallower than
10 m in the two MPA sites at the Cíes Islands since 2002,
but small-scale artisanal fishing is allowed (Ouréns et al.,
2015).
Underwater visual censuses
At each site, fish underwater visual censuses were carried out
along 50 × 5 m transects (Table 1). Along all transects, the
fish were counted, and their total length was estimated and
Downloaded
from
https://academic.oup.com/icesjms/advance-article/doi/10.1093/icesjms/fsac229/6962286
by
guest
on
12
February
2023
4 L. Cardona et al.
Table 3. Summary statistics of ANOVA to assess the variability of environmental characteristics (depth, roughness, and percentage of boulders) at the
four study sites in the Balearic Islands and Galicia.
Depth Roughness Boulder (%)
df MS F p MS F p MS F p
Balearic Islands
Protection 1 45.7 14.5 0.065 0.02 0.02 0.903 0.02 0.12 0.763
Site (protection) 2 3.3 0.4 0.364 0.83 2.45 0.129 0.09 1.60 0.242
Residuals 12 3.0 0.34 0.09
Galicia
Protection 1 0.56 0.73 0.482 2.64 2.60 0.248 0.15 0.29 0.642
Site (protection) 2 0.77 0.90 0.432 1.01 5.27 0.002 0.51 15.97 0.001
Residuals 12 0.85 0.19 0.03
Site is a random effect nested within protection. The boulders coverage was transformed as arcsine (x). Numbers in bold denote statistically significant effects.
assigned to the nearest 5 cm category. Extensive training using
artificial fish (Bell et al., 1985) was carried out prior to field
work, achieving accuracy in size estimates of 4 cm for 20–
40 cm fish and 10 cm for larger fish. Following the surveys,
fish lengths were transformed to biomass using the length–
weight relationships reported by Coull et al. (1989), Morales-
Nin and Moranta (1997), Morey et al. (2003), and Reñones
et al. (2007). Since the aim of the study was to compare
the density of carnivorous fish between and within localities,
the surveys included Carangidae, Dasyatidae, Labridae, Mull-
idae, Scienidae, Serranidae, Sparidae, and Sphyraenidae in the
Balearic Islands (Table 1), while Labridae, Moronidae, and
Sparidae were included in Galicia. The surveys were carried
out between 24 June and 8 July 2016 in the Balearic Islands
and 27 June and 2 July 2017 in Galicia.
To calculate the average depth of the transect, depth was
recorded at 0, 10, 20, 30, 40, and 50 m along the transect once
fish were counted. A roughness index (Ordines et al., 2005)
and the coverage of different substrate types (homogeneous
rock, gravel, boulders, and sand) were estimated visually along
the transect to characterize the habitat.
Sampling collection
Following visual censuses, selected nektobenthic carnivorous
fish species were captured at each site using hook and line,
spears, hand nets, and baited traps. The species selected were
numerically abundant or made a major contribution to total
biomass (Table 1), and their home ranges are small enough
to guarantee they remain within the limits of the MPAs stud-
ied (Pastor et al., 2009; Palmer et al., 2011; Villegas-Rios et
al., 2013b; Belo et al., 2016), except for Dicentrarchus labrax
(Pita and Freire, 2011). It should be noted that Labrus bergylta
has two morphs that differ in many biological traits (Villegas
Ríos et al., 2013a) and hence were analysed independently.
All the specimens, except adult Epinephelus marginatus, were
sacrificed and taken to the laboratory, were total length (TL
hereafter) was recorded (Table 1) and dorsolateral white mus-
cle was sampled and stored frozen (−20◦
C) for subsequent
analysis. Adult E. marginatus (TL  45 cm) were not sacri-
ficed because of their old age and regional scarcity (Reñones
et al., 2007). They were captured alive in baited traps, mea-
sured (total length) on board, and a sample of dorsal mus-
cle was collected with a 6 mm biopsy punch (Ackerson et al.,
2014) prior to being released. No adults of E. marginatus were
observed or captured at any of the OFA sites in the Balearic
Islands.
Samples of the four most abundant species of macro-
phytes (Balearic Islands: Carpodesmia barchycarpa, Dicty-
ota dichotoma, Halopteris scoparia, and Posidonia ocean-
ica; Galicia: Codium tomentosum, Dictyota dichotoma, Sac-
chorhiza polyschides, and Ulva lactuca) were collected at each
site after fish sampling to assess differences in the isotope base-
line within each region.
Stable isotope analysis
Samples were thawed at room temperature and dried in a lab-
oratory oven at 55◦
C for 24 h. Once dry, samples were ground
to a fine powder with a mortar and pestle, dried again for
24 h at 55◦
C, and rinsed with a 2:1 chloroform: methanol
solution to remove lipids. The chloroform: methanol solu-
tion was changed until it was transparent. Samples were dried
again for 24 h at 55◦
C. Once processed, 0.3 mg of the sam-
ple were weighed into 3.3 × 5 mm tin cups. All the tin cups
were combusted at 900◦
C and analysed in a continuous flow
isotope ratio mass spectrometer (Flash 1112 IRMS Delta C
Series EA, Thermo Finnigan; www.thermofisher.com) at the
Centres Científics i Tecnològics de la Universitat de Barcelona
(www.ccit.ub.edu) in Barcelona, Spain.
The abundance of stable isotopes is expressed using the
δ notation, where the relative variations of stable isotope
ratios are expressed as per mil (‰) deviations from prede-
fined reference scales [atmospheric nitrogen for δ15
N and Vi-
enna Pee Dee Belemnite (V-PDB) calcium carbonate for δ13
C].
However, due to limited supplies, isotopic reference materials,
which included known isotopic compositions relative to inter-
national measurement standards, were analysed instead. For
nitrogen, isotopic reference materials of known 15
N/14
N ra-
tios were used to a precision of 0.2 ‰, and these were namely:
(NH4)2SO4 (IAEA N1, δ15
N = +0.4 ‰, and IAEA N2, δ15
N =
+20.3 ‰), L-glutamic acid (IAEA USGS40, δ15
N = −4.6 ‰),
and KNO3 (IAEA NO3, δ15
N = +4.7 ‰). For carbon, iso-
topic reference materials of known 13
C/13
C ratios were used
to a precision of 0.3 ‰, and these were namely: polyethylene
(IAEA CH7, δ13
C = −31.8‰), sucrose (IAEA CH6, δ13
C =
−10.4‰), L-glutamic acid (USGS 40, δ13
C = −26.2‰), and
caffeine (IAEA 600, δ13
C = −27.7‰).
These isotopic reference materials were used to recalibrate
the system once every 12 samples and were analysed in or-
der to compensate for any measurement drift over time. The
raw data were recalculated, taking into account a linear re-
gression previously calculated for isotopic reference materials
(Skrzypek, 2013).
Downloaded
from
https://academic.oup.com/icesjms/advance-article/doi/10.1093/icesjms/fsac229/6962286
by
guest
on
12
February
2023
Food web structure in marine protected areas 5
Figure 2. Descriptors of the fish communities inhabiting the shallow rocky bottom sites in the areas open to fishing (OPA; grey) and MPAs (green) were
studied in the Balearic Islands (top panels) and Galicia (bottom panels). The horizontal bar inside the box is the mean; the limits of the box are the upper
and lower quartiles; and dots denote outliers.
Table 4. Summary statistics of the ANOVA to assess the effect of protection from fishing management (OFA versus MPA) in the two study areas for the
fish community descriptors.
Species richness Abundance Biomass
df MS F p MS F p MS F p
Balearic Islands
Protection 1 42.25 33.8 0.003 3164 6.88 0.120 1.32 41.44 0.023
Site (protection) 2 1.25 0.43 0.660 460 1.71 0.223 0.03 1.29 0.309
Residuals 12 2.92 270 0.02
Galicia
Protection 1 1.56 0.68 0.497 2256 0.72 0.486 0.52 30.50 0.031
Site (protection) 2 2.31 1.08 0.374 3136 0.95 0.414 0.01 0.32 0.733
Residuals 12 2.15 3303 0.32
Site is a random effect nested within protection. Biomass was transformed as log (x). Numbers in bold denote statistically significant effects.
Downloaded
from
https://academic.oup.com/icesjms/advance-article/doi/10.1093/icesjms/fsac229/6962286
by
guest
on
12
February
2023
6 L. Cardona et al.
Figure 3. Size structure of the fish communities inhabiting the shallow rocky bottom sites in the areas open to fishing (OFA; grey) and MPA (green) was
studied in the Balearic Islands (top panels) and Galicia (bottom panels).
Table 5. Summary statistics of an ANOVA run to assess differences in the δ15
N and δ13
C values of primary producers between MPA and OFA in the
Balearic Islands and Galicia.
δ15
N δ13
C
df MS F p df MS F p
Balearic Islands
Site 3 2.3 9.9 0.001 3 14.1 12.8 0.001
Species 3 9.7 42.2 0.001 3 293.5 265.2 0.001
Interaction 9 0.8 3.6 0.001 9 2.2 2.0 0.050
Residuals 64 0.2 64 1.11
Galicia
Site 3 10.8 32.4 0.001 3 1.5 0.5 0.7
Species 3 1.1 3.3 0.030 3 132.1 44.1 0.001
Interaction 9 0.6 1.8 0.080 9 5.2 1.7 0.100
Residuals 64 0.3 64 3.0
Bold types denote statistically significant effects.
Data analysis
The habitat characteristics (depth, roughness, and boulder
coverage) of the four sampling sites within each region were
compared by means of an ANOVA. Management was a fixed
factor, and site was a random effect nested within manage-
ment. All data were checked for normality and homogeneity
of variance and transformed to log (x) when these assump-
tions were not met. The boulder coverage data were presented
Downloaded
from
https://academic.oup.com/icesjms/advance-article/doi/10.1093/icesjms/fsac229/6962286
by
guest
on
12
February
2023
Food web structure in marine protected areas 7
Figure 4. Graphical representation of the General Lineal Model (GLM) and GAM (only for C. julis) analyses for the isotopic composition of fish species in
the Balearic Islands. When significant differences are detected between protection levels without significant size related trends, a box plot is
represented (the boundary of the box indicates the 25th and 75th percentiles, thin and thick lines within the box mark the median and mean,
respectively, and whiskers (error bars) above and below the box indicate the 90th and 10th percentiles). When no significant differences in the protection
level were detected but the size related changes were significant, the line of the regression is included in the graph. When no significant differences
were obtained for any of the terms included in the model, only the isotopic values were represented (grey and green circles). OFA: areas open to fishing.
MPA: marine protected areas.
as percentages, which require arcsine transformation to pro-
duce normally distributed data with homogeneous variances
(Zar, 1996).
Fish community descriptors (species richness, abundance,
and biomass) were calculated for nektobenthic carnivorous
fish at each site. The same ANOVA model described above
was used to test if fish assemblages from MPA and OFA sites in
the same regions differed in species richness, abundance, and
biomass. Descriptors’ data were log-transformed (log x) when
necessary to meet the assumptions of the analysis. ANOVA
was also used to test if the δ13
C and δ15
N macrophyte values
varied between sites in the same region.
The existence of statistically significant differences in the
stable isotope ratio values of macrophytes from the sites in the
same region (see results) revealed shifts in the isotopic base-
line that prevented the direct comparison of the stable isotope
ratios of fish. Following Fry and Davis (2015), we rescaled
fish δ13
C and δ15
N values into a Z-score, which is a measure
of how many standard deviations below or above the popula-
tion mean a raw score is. Furthermore, the Fry–Davis method
gives rescaled individual distances to the community mean in
‰ units and not in standard deviation units. This approach al-
lows comparing the isotopic spaces of the study sites in each
region without the influence of the isotopic baseline, using
the rescaled individual distances (13
C and 15
N, hereafter).
General Linear Models (GLM) or General Additive Models
(GAM) with a gaussian distribution and identity link function
were used to assess the variability of 13
C and 15
N values
in the fish population. Because no differences were detected
between sites in the fish community descriptors (see results),
the model included only management (a categorical variable),
fish total length (a continuous variable), and the interaction
between both. When the interaction term was not significant,
it was excluded from the model, and the models were run in-
cluding only the two main explanatory variables. Model fit
was evaluated by inspecting the residuals graphs for poten-
tial violations of the model assumptions, particularly normal-
ity, homogeneity, and independence (Zar, 1996). The percent-
age of variability explained by the lineal models R2
= 100
× (null deviance—residual deviance/null deviance) was calcu-
lated. GLM and GAM were performed with the programme
R using the mgcv package (http://www.r-project.org/).
Rescaled individual distances were also used to compare
the trophic structure of the assemblage using SIBER (Stable
Isotope Bayesian Ellipses in R; Jackson et al., 2011). This is
a Bayesian version of Layman metrics (Layman et al., 2007),
Downloaded
from
https://academic.oup.com/icesjms/advance-article/doi/10.1093/icesjms/fsac229/6962286
by
guest
on
12
February
2023
8 L. Cardona et al.
Table 6. Summary statistics of the GLM and GAM (only for C. julis in the Balearic Islands) to test the effect of protection from fishing and the total length
of the rescaled stable isotope ratios of the fish species considered.
Intercept Protection Fish length
Balearic Islands p Coefficient (SE) p Coefficient (SE) p
Var/Dev
explained (%)
C. julis 13
C 0.11 − 0.38 (0.19) 0.17 s (1.84 edf) 0.01 27.8
15
N 0.001 0.06 (0.10) 0.56 s (2.40 edf) 0.001 76.3
S. tinca 13
C 0.88 − 0.12 (0.48) 0.81 − 0.02 (0.06) 0.70 1.1
15
N 0.04 − 0.77 (0.39) 0.07 0.05 (0.05) 0.31 22.5
D. sargus 13
C 0.12 − 0.73 (0.42) 0.10 0.06 (0.04) 0.20 16.7
15
N 0.23 − 1.20 (0.48) 0.02 0.01 (0.05) 0.83 27.4
D. vulgaris 13
C 0.02 0.10 (0.39) 0.79 − 0.13 (0.06) 0.05 20.3
15
N 0.01 − 0.09 (0.26) 0.72 − 0.09 (0.04) 0.05 20.7
S. cantharus 13
C 0.95 0.03 (0.50) 0.94 0.02 (0.09) 0.85 0.2
15
N 0.47 − 0.32 (0.69) 0.65 − 0.05 (0.13) 0.68 1.7
E. marginatus 13
C 0.58 − 0.45 (0.38) 0.38 0.03 (0.01) 0.04 24.6
15
N 0.21 − 0.67 (0.30) 0.03 0.06 (0.01) 0.001 70.35
S. cabrilla 13
C 0.44 0.29 (0.39) 0.39 − 0.17 (0.10) 0.10 10.7
15
N 0.001 0.09 (0.18) 0.63 0.23 (0.06) 0.001 50.1
S. scriba 13
C 0.21 − 0.18 (0.17) 0.28 0.10 (0.05) 0.06 14.3
15
N 0.001 0.06 (0.16) 0.70 0.18 (0.05) 0.001 30.6
Galicia
C. exoletus 13
C 0.001 − 0.70 (0.31) 0.04 0.31 (0.06) 0.001 60.3
15
N 0.001 0.57 (0.18) 0.004 0.23 (0.03) 0.001 74.1
L. bergylta (plain) 13
C 0.006 0.43 (0.24) 0.08 0.04 (0.02) 0.04 22.9
15
N 0.18 0.89 (0.22) 0.001 − 0.01 (0.02) 0.81 35.2
L. bergylta (spotted) 13
C 0.25 0.12 (0.20) 0.57 0.02 (0.01) 0.12 9.8
15
N 0.18 − 0.10 (0.29) 0.72 0.005 (0.02) 0.79 0.6
S. melops 13
C 0.59 − 5.80 (1.60) 0.001 0.004 (0.08) 0.86 47.1
15
N 0.03 0.08 (0.31) 0.79 0.04 (0.04) 0.45 3.1
D. sargus 13
C 0.68 0.76 (0.65) 0.26 0.06 (0.07) 0.40 22.5
15
N 0.05 − 0.45(0.52) 0.40 − 0.06 (0.06) 0.32 20.1
D. vulgaris 13
C 0.08 0.72 (0.44) 0.12 0.08 (0.05) 0.10 39.9
15
N 0.31 − 0.51 (0.20) 0.02 0.02 (0.02) 0.31 25.2
G. flavescens 13
C 0.001 − 0.32 (0.13) 0.02 23.5
15
N 0.001 − 0.39 (0.13) 0.006 30.8
D. labrax 13
C 0.03 − 1.69 (0.07) 0.002 − 0.14 (0.09) 0.17 44.2
15
N 0.001 − 0.10 (0.32) 0.76 − 0.20 (0.06) 0.008 50.5
Bold type denotes statistically significant effects. SE: standard error; Var: variance (GLM models); Dev: deviance (GAM models); p: significant differences in
bold. The protection × fish length interaction term was statistically significant only for S. melops (coefficient = 0.33; standard error = 0.11; p = 0.005).
which informs of the diversity of resources used by the assem-
blage and resource use partitioning by the assemblage. The N
range (NR) provides information on the trophic length of the
community; the C range (CR) is the width of the food web
and gives us an idea of the diversity of C sources fueling the
food web; the total area of the convex hull (TA); and the mean
distance to the centroid (CD) provide measures of the average
degree of trophic diversity within a food web, the mean dis-
tance to the nearest neighbour (MNND) provides a measure
of the overall density of species packing, and the standard de-
viation of the nearest distance (SDNND) gives a measure of
the evenness of spatial redundancy. SIBER calculates the 95,
75, and 50% credible intervals for the metrics of each pop-
ulation. The codes for running SIBER analyses can be found
at https://cran.r-project.org/web/packages/SIBER/vignettes/In
troduction-to-SIBER.html. Similar numbers of individuals of
each species were collected at each OFA and MPA area, to get
a balanced design. Adult E. marginatus are the only exception,
as they were missing from OFA sites. The total sample size per
species is reported at Table 1.
Because no differences were detected between sites in the
fish community descriptors (see results), we pooled the fish
samples from two OFA and two MPA sites from each region
to calculate the Layman metrics. Later, we calculated the 95%
CI on the difference between the means of OFA and MPA sites
from the same region and concluded that statistically signifi-
cant differences did not exist if the 95% CI of the difference
included zero (Bolstrad and Curran, 2016).
Results
Habitat characteristics and fish assemblages
The seascape of the four study sites in the Balearic Islands was
characterized by the existence of patches of the seagrass P.
oceanica scattered between brown macroalgae-covered boul-
ders, and no differences were observed in the mean values of
habitat characteristics between the four study sites (Tables 2
and 3). Similarly, macroalgae-covered boulders were also the
prevalent habitat at the four Galicia sites (Table 2), but there
were site-scale differences in roughness and boulder cover
(Table 3), because Cabo dos Bicos, an MPA site, has signifi-
cantly higher values of both habitat descriptors. The species
richness and biomass of nektobenthic carnivorous fish were
higher at MPA than at OFA areas in the Balearic Islands, with-
out significant differences in abundance or any significant ef-
fect of site (Figure 2 and Table 4).
In Galicia, biomass was the only descriptor of the fish com-
munity that differed between both levels of protection, with
Downloaded
from
https://academic.oup.com/icesjms/advance-article/doi/10.1093/icesjms/fsac229/6962286
by
guest
on
12
February
2023
Food web structure in marine protected areas 9
Figure 5. Graphical representation of the GLM analysis for the isotopic composition of fish species in Galicia. When significant differences are detected
between protection levels without significant size related trends, a box plot is represented (the boundary of the box indicates the 25th and 75th
percentiles, thin and thick lines within the box mark the median and mean, respectively, and whiskers (error bars) above and below the box indicate the
90th and 10th percentiles). When no significant differences in the protection level were detected but the size related changes were significant, the line
of the regression is included in the graph. When no significant differences were obtained for any of the terms included in the model, only the isotopic
values were represented (grey and green circles). OFA: areas open to fishing. MPA: marine protected areas.
highly significant values of biomass at the MPA than at OFA
and without any significant effect of site (Figure 2 and Table
4). Individuals ranging between 7.5 and 17.5 cm prevailed nu-
merically in both MPA and OFA sites in the Balearic Islands
(Figure 3). However, individuals from the intermediate size
classes (17.5 cm) made the largest contribution to biomass in
OFA, whereas individuals 27.5 cm made the largest contri-
bution to biomass in MPA (Figure 3). The size structure of the
fish community in the OFA and MPA sites of Galicia was more
similar, although individuals in the larger size classes (42.5 and
52.5 cm) were scarcer at some of the OFA sites.
Stable isotope ratios and the topology of the fish
assemblage in the isospace
Macrophytes from different sites in the same region differed
in their stable isotope ratios (Supplementary Figure SM1
and Table 5), thus revealing differences in the isotope base-
line and the need for rescaling the stable isotope ratios of fish
before comparing them across protection levels (see materials
and methods).
Half the species in the Balearic Islands and most of the
species in Galicia shifted their positions in the 13
C–15
N
isospace from site to site (Supplementary Figures SM2 and
SM3). However, data analysis (GLM or GAM) revealed no
effect of the protection from fishing on the 13
C values of
any fish species from the Balearic Islands, a statistically sig-
nificant effect of the protection on the 15
N values of only
two species from the Balearic Islands (Figure 4 and Table 6),
and a significant effect of the protection from fishing on the
stable isotope ratios of most fish species from Galicia (Figure
5 and Table 6). The same analysis revealed a diversity of rela-
tionships between the stable isotope ratios and fish body size
in both regions.
In the Balearic Islands, Diplodus sargus and Epinephelus
marginatus were the only two species whose 15
N values
were affected by protection from fishing, as both were sig-
nificantly higher in the OFA than in the MPA sites (Figure 4
and Table 6). Fishing had no effect on their 13
C values, and
no relationship existed between body size and stable isotope
ratios in D. sargus, although both 13
C and 15
N increased
with body size in E. marginatus. The stable isotope ratios of
Symphodus tinca and Spondyliosoma cantharus were not in-
fluenced by protection or body size and those of the remain-
ing five species changed with body size but not with protec-
tion from fishing. Both the 13
C and 15
N values of C. julis
Downloaded
from
https://academic.oup.com/icesjms/advance-article/doi/10.1093/icesjms/fsac229/6962286
by
guest
on
12
February
2023
10 L. Cardona et al.
Figure 6. Layman metrics of the assemblages of nektobenthic carnivorous fish from OFA and MPA from the Balearic Islands and Galicia. CD: mean
distance to the centroid, MNND: mean distance to the nearest neighbour; SDNND: standard deviation of the nearest distance. Squares denote the
mean, and boxes the 50, 75, and 95% CIs.
Table 7. Difference between the mean and 95% CI for each Layman metric for the assemblage of nektobenthic, carnivorous fish in areas open to fishing
and MPAs in the Balearic Islands and Galicia.
Balearic Islands Galicia
Difference 95% CI Difference 95% CI
N range − 1.6 −2.7/1.3 0.0 −1.2/2.8
C range − 0.9 −1.5/1.8 1.0 −0.1/3.6
Total area − 0.5 −2.9/5.1 − 1.3 −3.4/4.6
CD 0.0 −0.2/0.4 0.0 −0.2/0.6
MNND − 0.3 −0.5/0.6 0.0 −0.3/0.7
SDNND − 0.4 −0.6/0.5 0.3 −0.1/1.1
Differences are statistically significant if the 95% CI of the difference does not include 0.
increased with size, although with a non-lineal relationship.
The 13
C values of Serranus cabrilla and Serranus scriba did
not show any significant relationship with body size, but their
15
N values increased significantly with body size, both in
OFA and MPA. Finally, Diplodus vulgaris was the only species
whose 13
C and 15
N values decreased with body size at
both protection levels (Figure 4 and Table 6).
In Galicia, both the 13
C and 15
N values of D. labrax, D.
vulgaris, and Gobiusculus flavescens were significantly higher
in the OFA than in the MPA sites; the 13
C of Centrolabrus
exoletus was also higher in the OFA than in the MPA sites, but
the opposite was true for 15
N (Figure 5 and Table 6). The
15
N of L. bergylta (plain) was also lower in the OFA than
in the MPA sites. Furthermore, the stable isotope ratios of D.
sargus and L. bergylta (spotted) were not influenced by pro-
tection. Regarding the effect of body size on stable isotope ra-
tios, both the 13
C and 15
N values of C. exoletus increased
with body size, the 13
C of L. bergylta (plain) increased with
size, the 15
N of D. labrax decreased with body size and the
stale isotope ratios of D. sargus and L. bergylta (spotted) did
not change with body size. Finally, Symphodus melops was
the only species with a significant interaction between protec-
tion level and size for the 13
C (p = 0.005), with a signifi-
cant increasing trend with size only in the MPA (Figure 5 and
Table 6).
No statistically significant differences existed between any
of the Layman metrics of OFA and MPA sites from the same
region, including the total area of the convex hull (Figure 6
and Table 7). Furthermore, the overlap between the standard
ellipses of OFA and MPA sites from the same region was al-
ways 90% (Figure 7 and Table 8). These results indicate no
differences in the diversity of trophic resources used by the
assemblage, the resource partitioning between species, or the
degree of trophic redundancy.
Discussion
The results reported here demonstrate a significant impact of
fishing on the biomass of nektobenthic carnivorous fish from
shallow rocky bottoms in the Balearic Islands and Galicia.
Downloaded
from
https://academic.oup.com/icesjms/advance-article/doi/10.1093/icesjms/fsac229/6962286
by
guest
on
12
February
2023
Food web structure in marine protected areas 11
Figure 7. Convex hulls (top) and standard ellipses (bottom) in the isospace of the assemblages of nektobenthic carnivorous fish from areas open to
fishing (grey symbols) and MPAs (green symbols) in the Balearic Islands and Galicia. Note that the range of values on the both axes is different for the
Balearic Islands and Galicia.
Table 8. Overlap between the standard ellipses of the assemblages of nektobenthic, carnivorous fish in areas open to fishing and MPAs in the Balearic
Islands and Galicia.
Balearic Islands Galicia
Area (‰2
) Overlap (%) Area (‰2
) Overlap (%)
OFA 5.27 91.7 5.33 98.5
MPA 5.19 93.1 5.44 96.5
However, protection from fishing caused no significant change
in the trophic structure of the fish assemblage in either of the
two regions. The stability of the trophic structure of the fish
assemblage in the Balearic Islands is particularly remarkable
because E. marginatus dominates the fish biomass in MPAs,
and individuals 45 cm TL have a unique trophic niche
(Harmelin and Harmelin-Vivien, 1999; Reñones et al., 2002;
this study), but the species is virtually absent from areas open
to fishing (Coll et al., 2013, 2020; Hackradt et al. 2014; this
study).
Stable isotope ratios are certainly rather coarse proxies of
diet, lack the taxonomic resolution of stomach contents anal-
ysis, and may fail to capture diet shifts where isotopic gra-
dients are weak (Newsome et al., 2007). Nevertheless, the
Layman metrics have previously demonstrated their capac-
ity to reveal differences in the food web structure of ecosys-
tems at different geographic and temporal scales (Abrantes et
al., 2014; Saporiti et al., 2014, 2015; López-Rasgado et al.,
2016; Bas et al., 2019; Stuthman and Castellanos-Galindo,
2020; Cardona et al., 2021). Particularly relevant here is the
absence of significant changes in the total area of the convex
hull and the almost complete overlap of the standard ellipses
of the whole communities, as they are universally considered
to reveal changes in the diversity of trophic resources con-
sumed (Hamilton et al., 2014; Marsh et al., 2017; Olson et al.,
2019).
Furthermore, the experimental design minimized potential
confounding factors. First, fishing restrictions in the MPAs of
the Balearic Islands and Galicia had been in force for 25 and
15 years, respectively, periods long enough to allow the built-
up and stabilization of fish biomass (Coll et al., 2013). Second,
no consistent differences existed in the habitat characteristics
of the marine reserves and control sites, and hence, habitat
heterogeneity is unlikely to be confounded with the effect of
protection. Third, the species studied here are highly seden-
tary, and their home ranges are small enough to guarantee they
remain within the limits of the MPAs (Pastor et al., 2009; Alós
et al., 2011; Palmer et al., 2011; Villegas-Rios et al., 2013b;
Belo et al., 2016), except for D. labrax (Pita and Freire, 2011).
As a consequence, the absence of differences between the
trophic structure of the assemblage of nektobenthic carnivo-
rous fish in MPAs and control areas is not an artefact resulting
Downloaded
from
https://academic.oup.com/icesjms/advance-article/doi/10.1093/icesjms/fsac229/6962286
by
guest
on
12
February
2023
12 L. Cardona et al.
from the constant reshuffling of individuals between adjoining
areas.
Fourth, not all the fish species in the community were sam-
pled, but all the species making a major contribution to the
abundance or biomass were collected for stable isotope anal-
ysis, and the same species were sampled at every locality in
the Balearic Islands and Galicia to ensure that differences in
the trophic structure of the community, if any, were because of
shifts in species diet and not because of changes in the species
included in the analysis (Saporiti et al., 2015; Marsh et al.,
2017; Olson et al., 2019). Actually, most of the species stud-
ied are opportunistic carnivores consuming diverse prey (e.g.
Sala and Ballesteros, 1997; Harmelin and Harmelin-Vivien,
1999; Reñones et al., 2002; Figueiredo et al., 2005; Spitz et
al., 2013; Pita and Freire, 2019) and all them were targeted
by commercial or recreational fishermen in the Balearic Is-
lands (Morales-Nin et al., 2005; Maynou et al., 2013) and
most of them in Galicia, except G. flavescens, C. exoletus,
and S. melops (Ouréns et al., 2015; Pita and Freire, 2016).
Thus, they were expected to shift their diets and stable iso-
tope ratios in response to changes in the size structure and
biomass of the assemblage (Cardona et al., 2020; Moranta
et al., 2020). Such opportunistic behaviour and trophic plas-
ticity are demonstrated by the broad variability observed in
the 13
C and 15
N values of most species, which hindered
any significant correlation between body size and stable iso-
tope ratios in several species, both in the Balearic Islands and
Galicia, and resulted in a significant effect of protection of the
isotopic niche of two species in the Balearic Islands and several
species in Galicia.
Fifth, we also tried to sample individuals of the same species
within a similar body size at each locality, but this was impos-
sible for species strongly affected by fishing. The most extreme
examples were E. marginatus in the Balearic Islands and D.
sargus in Galicia, where individuals larger than 45cm TL and
26cm TL were virtually absent from the areas open to fishing
in the Balearic Islands and Galicia, respectively. The size dis-
tribution of several smaller species, such as S. melops in Gali-
cia, was also biased towards larger individuals in MPAs. For
this reason, body size was included in the models analysing
the effect of protection on the stable isotope ratios of carniv-
orous fish. Body size was indeed the major determinant of the
13
C or 15
N values of most species in the Balearic Islands
and several species in Galicia, and hence, the shifts in the size
structure of the assemblage reported here might have resulted
in a diversification of the resources exploited by the assem-
blage (Hamilton et al., 2014; Olson et al., 2020). However,
our results do not confirm any change in the trophic structure
of the assemblage.
The biomass of the fish populations in the areas open to
fishing in the Balearic Islands was dominated by individuals of
intermediate body size. Protection from fishing dramatically
altered the size structure of the population and resulted in in-
verted biomass pyramids in the MPAs of the Balearic Islands.
This was because of a much higher abundance of individuals
30 cm, mostly D. sargus and E. marginatus, but also indi-
viduals of species virtually absent from areas open to fishing,
such as Labrus viridis and Sciaena umbra, although in low
numbers. Similarly, the biomass of the fish populations in ar-
eas open to fishing in Galicia was dominated by individuals of
intermediate body size, but the built-up of fish biomass in the
MPAs resulted mostly from a larger abundance of individuals
of intermediate body size. Certainly, the abundance of large
D. sargus and L. bergylta increased in the MPAs of Galicia,
but the number and identity of the species did not change as a
result of protection from fishing, and the size structure of the
fish community remained largely unchanged.
Differences in the management of MPAs in the Balearic Is-
lands and Galicia and in the biology of the top predators of
each region explain the differences in the process leading to
the built-up of fish biomass in marine protected areas in both
regions. We studied true no-take areas in the Balearic Islands
(Coll et al., 2020), whereas a small-scale artisanal fishery was
allowed to operate in the MPAs of Galicia (Ouréns et al.,
2015). Partial protection from fishing did not prevent a sig-
nificant increase in the biomass of carnivorous fish there, but
this was mostly due to a higher abundance of a mesopredador,
L. bergylta (Pita and Freire, 2019; Cardona et al., 2020). On
the contrary, the biomass of D. labrax, the top predator of
the ecosystem (Pita and Freire, 2019; this study), remained
low, contrary to the situation in no-take areas in Portugal
(Gil Fernández et al., 2016). This highlights the impact of the
small-scale artisanal fishery operating in the MPAs of Galicia
(Ouréns et al., 2015), but differences in the behaviour of E.
marginatus and D. labrax are also relevant to explain the dif-
ferences between the Balearic Islands and Galicia. E. margina-
tus is a sedentary species with a small home range (Pastor et
al., 2009), and hence, population density is largely dependent
on local fishing, which allows E. marginatus to reach high den-
sities within small MPAs in the Mediterranean Sea (Sala et
al., 2012; Coll et al., 2013; Hackradt et al., 2014, 2020; this
study). It should be noted, however, that E. marginatus moves
to deeper rocks as they grow older (Alvarez-Berastegui et al.,
2018), which might limit biomass built-up in the shallow no-
take areas studied. Conversely, D. labrax is a highly mobile
species (Pita and Freire, 2011), and high fishing mortality be-
yond the limits of MPAs likely limits the built-up of D. labrax
biomass even in no-take areas.
Thus, the overall evidence suggests that the absence of an
impact of fishing on the trophic structure of nektobenthic fish
assemblages, both in the Mediterranean Sea and the temper-
ate north-east Atlantic Ocean, is probably real and not an arte-
fact of the methods used here. Individual species may certainly
change their isotopic niches in response to fishing (e.g. Car-
dona et al., 2020; Moranta et al., 2020), but no real niche
diversification happens, and the Layman metrics remain un-
changed. This means that the shifts in size structure and the
biomass built-up of carnivorous fish currently observed at
MPAs in the Mediterranean Sea and the adjoining temperate
north-east Atlantic Ocean are high enough to trigger diet shifts
in individual species but not to modify the trophic structure of
the assemblage. Perhaps the species studied here have partic-
ularly narrow fundamental niches compared to other species
that can forage at two different trophic levels and alos shift
easily from benthic to pelagic prey (e.g Eloranta et al., 2015),
but the incomplete recovery of the carnivore assemblage at the
studied MPAs is another likely reason for the weak response
reported here.
Larger predators have a disproportionate impact on food
web structure due to their higher consumption rates and their
preference for larger consumers (DeLong et al., 2015). Fish-
ing has highly reduced the biomass of carnivorous fish at a re-
gional level both in the Mediterranean Sea and the north-east
temperate Atlantic Ocean (Christensen et al., 2003; Piroddi
et al., 2015), and several high trophic level carnivores, such
as seals and coastal sharks, are very scarce or regionally ex-
Downloaded
from
https://academic.oup.com/icesjms/advance-article/doi/10.1093/icesjms/fsac229/6962286
by
guest
on
12
February
2023
Food web structure in marine protected areas 13
tinct in the western Mediterranean Sea (Sala, 2004; Coll et al.,
2012; Moro et al., 2019; Nuez et al., 2021). Thus, total fish-
ing prohibition and protection of the adjoining rocky habitats
would certainly increase the biomass of carnivorous fish at the
MPAs studied here, but it is unlikely that this would restore
the original diversity of highly mobile, high trophic level car-
nivores at a local scale if they are scarce at a regional scale
(D’Agata et al., 2016; Roff et al., 2016; McClanahan et al.,
2019).
In conclusion, properly enforced MPAs in the Mediter-
ranean Sea and the temperate north-east Atlantic Ocean may
allow for rebuilding the populations of nektobenthic carnivo-
rous fish and restoring their size structure, but they are un-
likely to restore the trophic structure to that of pre-fished
ecosystems. This would be possible only if the original diver-
sity of carnivores was restored regionally, which is probably
unrealistic there and in many other regions, given the extent of
fishing and climate change impacts on the global ocean (Che-
ung et al., 2012; D’Agata et al., 2016; Roff et al., 2016; Mc-
Clanahan et al., 2019). Accordingly, restoration goals in re-
gions where highly mobile predators have been decimated or
are regionally extinct should be reframed in terms of an objec-
tive that is less unrealistic than the pre-fishing condition while
still recovering aspects of the historical trophic structure. The
situation might be different in areas where much of the orig-
inal diversity of highly mobile, high trophic level carnivores
still remains and populations are actually increasing as a re-
sult of legal protection, such as the north-east Pacific Ocean
(Carretta et al., 2020).
Acknowledgments
We appreciate the help provided by the staff of Parque Na-
cional Marítimo-Terrestre de las Islas Atlánticas de Galicia
and Parque Nacional Marítimo-Terreste del Archipiélago de
Cabrera. Conxita Avila, Diego Rita, and Oriol Sacristán as-
sisted in field work.
Supplementary data
Supplementary material is available at the ICESJMS online
version of the manuscript.
Conflict of interest statement
Authors disclose no conflict of interest.
Author contributions statement
LC, OR, AB, AA, and JM conceived the ideas and designed the
methodology; LC, OR, JM, AG, and FS collected the data; LC,
FS, and AB conducted the laboratory analysis; LC, OR, and
JM analysed the data; and LC, OR, and JM led the writing of
the manuscript. All authors contributed critically to the drafts
and gave final approval for publication.
Funding
This work was supported by the Organismo Autónomo de
Parques Nacionales, through grant number 1588/2015.
Data availability statement
The data underlying this article are available in the Dryad Dig-
ital Repository (doi: 10.5061/dryad.k98sf7m9j).
References
Abrantes, K. G., Barnet, A., and Bouillon, S. 2014. Stable isotope-based
community metrics as a tool to identify patterns in food web struc-
ture in east African estuaries. Functional Ecology, 28: 270–282.
Ackerson, R. J., McKee, M. J., Schmitt, C. J., and Brumbaugh, W. G.
2014. Implementation of a non-lethal biopsy punch monitoring pro-
gram for mercury in smallmouth bass, Micropterus dolomieu La-
cepède, from the eleven point river, Missouri. Bulletin of Environ-
mental Contamination and Toxicology, 92: 125–131.
Alós, J., March, D., Palmer, M., Grau, A., and Morales-Nin, B. 2011.
Spatial and temporal patterns in Serranus cabrilla habitat use in the
NW Mediterranean revealed by acoustic telemetry. Marine Ecology
Progress Series, 427: 173–186.
Alvarez-Berastegui, D., Coll, J., Rueda, L., Stobart, B., Morey, G.,
Navarro, O., Aparicio-González, A. et al. 2018. Multiscale seascape
habitat of necto-benthic littoral species, application to the study of
the dusky grouper habitat shift throughout ontogeny. Marine Envi-
ronmental Research, 142: 21–31.
Bas, M., Briz, I., Godino, I., Álvarez, M., Vales, D. G., Crespo, E. A., and
Cardona, L. 2019. Back to the future? Late Holocene marine food
web structure in a warm climatic phase as a predictor of trophody-
namics in a warmer south western Atlantic Ocean. Global Change
Biology, 25: 404–419.
Baskett, M. L., and Barnett, L.A.K. 2015. The ecological and evolu-
tionary consequences of marine reserves. Annual Review of Ecology,
Evolution, and Systematics, 46: 49–73.
Bell, J. D., Craik, G. J. S., Pollard, D. A., and Russell, B. C. 1985. Esti-
mating length frequency distributions of large reef fish underwater.
Coral Reefs, 4: 41–44.
Belo, A. F., Pereira, T. J., Quintella, B. R., Castro, N., Costa, J. L., and
de Almeida, P. R. 2016. Movements of Diplodus sargus (Sparidae)
within a Portuguese coastal marine protected area: are they really
protected? Marine Environmental Research, 114: 80–94.
Boeklen, W. J., Yarnes, C. T., Cook, B. A., and James, A. C. 2011. On the
use of stable isotopes in trophic ecology. Annual Review of Ecology,
Evolution, and Systematics, 42: 411–440.
Bolstrad, W. M., and Curran, J. M. 2016. Introduction to Bayesian
Statistics. Wiley, New Jersey, NJ. 624pp.
Bond, M. E., Valentin-Albanese, J., Babcock, E. A., Heithaus, M. R.,
Grubbs, R. D., Cerrato, R., Peterson, B. J. et al. 2019. Top predators
induce habitat shifts in prey within marine protected areas. Oecolo-
gia, 190: 375–385.
Cardona, L., Lloret-Lloret, E., Moles, J., and Avila, C. 2021. Latitudi-
nal changes in the trophic structure of Benthic coastal food webs
along the Antarctic Peninsula. Marine Environmental Research,
167: 105290.
Cardona, L., Reñones, O., Gouragine, A., Saporiti, F., Aguilar, A.,
and Moranta, J. 2020. Fishing alters resource partitioning between
colour morphs in a temperate coastal fish. Marine Ecology Progress
Series, 648: 179–190.
Carretta, J. V., Forney, K. A., Oleson, E. M., Weller, D. W.,
Lang, A. R., Baker, J., Muto, M. M. et al. 2020. U.S. Pa-
cific Marine Mammal Stock Assessments: 2019, U.S. Department
of Commerce, NOAA Technical Memorandum NMFS-SWFSC-
629. https://swfsc-publications.fisheries.noaa.gov/publications/CR/
2021/2021Carretta2.pdf (last accessed 1 December 2022).
Cheng, B. S., Alteri, A. H., Torchin, E. M., and Ruiz, G. M. 2019. Can
marine reserves restore lost ecosystem functioning? A global synthe-
sis. Ecology, 100: e02617.
Cheung, W. W. L., Sarmiento, J. L., Dunne, J., Frölicher, T. L., Lam,
V.W.Y, Palomares, M. L. D., Watson, R. et al. 2012. Shrinking
of fishes exacerbates impacts of global ocean changes on marine
ecosystems. Nature Climate Change, 3: 254.
Downloaded
from
https://academic.oup.com/icesjms/advance-article/doi/10.1093/icesjms/fsac229/6962286
by
guest
on
12
February
2023
14 L. Cardona et al.
Christensen, V., Gue, S., Heymans, J. J., Walters, C. J., Watson, R, Zeller,
D., and Pauly, D. 2003. Hundred-year decline of North Atlantic
predatory fishes. Fish and Fisheries, 4: 1–24.
Coll, J., Garcia-Rubies, A., Morey, G., Reñones, O., Álvarez-Berastegui,
D., Navarro, O., and Grau, A. M. 2013. Using no-take marine re-
serves as a tool for evaluating rocky-reef fish resources in the western
Mediterranean). ICES Journal of Marine Science, 70: 578–590.
Coll, J., Reñones, O., Moranta, J., Álvarez-Berastegui, D., and Cardona,
L. 2020. Els peixos del fons durs infralitorals de l’arxipèlag de Cabr-
era. Efectes dels 25 anys de Parc Nacional. In Arxipèlag de Cabrera:
Història Natural, 30, pp. 243–276. Ed. by Grau A. M., Fronós J. J.,
Mateu G., Oliver P. A., and Terrasa B. Monografies de la Societat
d’Història Natural de les Balears, Palma, Spain. 738pp.
Coll, M., Piroddi, C., Albouy, C., Ben Rais Lasram, F., Cheung, W.W.L.,
Christensen, V., Karpouzi, V. S. et al. 2012. The Mediterranean Sea
under siege: spatial overlap between marine biodiversity, cumulative
threats and marine reserves. Global Ecology and Biogeography, 21:
465–480.
Coull, K. A., Jermyn, A. S., Newton, A. W., Henderson, G. I., and Hall,
W. B. 1989. Length/Weight Relationships for 88 Species of Fish En-
countered in the North Atlantic. Scottish Fisheries Research Report,
43. Department of Agriculture and Fisheries for Scotland, Aberdeen.
D’Agata, S., Mouillot, D., Wantiez, L., Friedlander, A. M., Kulbicki, M.,
and Vigliola, L. 2016. Marine reserves lag behind wilderness in the
conservation of key functional roles. Nature Communications, 7:
72000.
Dell, C., Montoya, J., and Hay, M. 2015. Effect of marine protected
areas (MPAs) on consumer diet: MPA fish feed higher in the food
chain. Marine Progress Series, 540: 227–234.
DeLong, J. P., Gilbert, B., Shurins, J. B., Savage, V. M., Barton, B. T.,
Clements, C. F., Dell, A. I. et al. 2015. The body size dependence of
trophic cascades. The American Naturalist, 185: 354–366.
Eger, A. M., and Baum, J. K. 2020. Trophic cascades and connectivity in
coastal benthic marine ecosystems: a meta-analysis of experimental
and observational research. Marine Ecology Progress Series, 656:
139–152.
Eloranta, A. P., Kahilainen, K. K., Amundsen, P.-A., Knudsen, R., Har-
rod, C., and Jones, R. I. 2015. Lake size and fish diversity determine
resource use and trophic position of a top predator in high-latitude
lakes. Ecology and Evolution, 5: 1664–1675.
Estes, J.A, Terborgh, J., Brashares, J., Power, M. E., Berger, J., Bond, W.
J., Carpenter, S. R. et al. 2011. Trophic downgrading of planet earth.
Science, 333: 301–306.
Figueiredo, M., Morato, T., Barreiros, J. P., Afonso, P., and Serrao-
Santos, R. 2005. Feeding ecology of the white seabream, Diplodus
sargus, and the ballan wrasse, Labrus bergylta, in the Azores. Fish-
eries Research, 75: 107–119.
Frank, K. T., Petrie, B., Choi, J. S., and Leggett, W. C. 2005. Trophic cas-
cades in a formerly cod-dominated ecosystem. Science, 308: 1621–
1623.
Fry, B., and Davis, J. 2015. Rescaling stable isotope data for standard-
ized evaluations of food webs and species niches. Marine Ecology
Progress Series, 528: 7–17.
Gil Fernández, C., Paulo, D., Serrao, E. A., and Engelen, A. H. 2016.
Limited differences in fish and benthic communities and possible
cascading effects inside and outside a protected marine area in Sagres
(SW Portugal). Marine Environmental Research, 114: 12–23.
Gill, A. B. 2003. The dynamics of prey choice in fish: the importance of
prey size and satiation. Journal of Fish Biology, 63: 105–116.
Hackradt, C. W., Garcıía-Charton, J. A., Harmelin-Vivien, M, Pérez-
Ruzafa, A., Le Diréach, L, Bayle-Sempere, J., Charbonnel, E. et al.
2014. Response of rocky reef top predators (Serranidae: epinepheli-
nae) in and around marine protected areas in the western Mediter-
ranean Sea. PLoS One, 9: e98206.
Halpern, B. S. 2003. The impact of marine reserves: do reserves work
and does reserve size matter? Ecological Applications, 13: 117–137.
Hamilton, S. L., Newsome, S. D., and Caselle, J. E. 2014. Dietary niche
expansion of a kelp forest predator recovering from intense com-
mercial exploitation. Ecology, 95: 164–172.
Hammerschlag, N., Schmitz, O. J., Flecker, A. S., Lafferty, K. D., Sih, A.,
Atwood, T. B., Gallagher, A. J. et al. 2019. Ecosystem function and
services of aquatic predators in the Anthropocene. Trends in Ecology
and Evolution, 34: 369–383.
Harmelin, J. G., and Harmelin-Vivien., M. 1999. A review on habi-
tat, diet and growth of the dusky grouper Epinephelus marginatus
(Lowe, 1834). Marine Life, 9: 11–20.
Heithaus, M. R., Wirsing, A. J., and Dill, L. M. 2012. The ecological
importance of intact top-predator populations: a synthesis of 15
years of research in a seagrass ecosystem. Marine and Freshwater
Research, 63: 1039–1050.
Hilborn, R., Stokes, K., Maguire, J.-J., Smith, T., Botsford, L. W.,
Mangel, M., Orensanz, J. et al. 2004. When can marine reserves
improve fisheries management? Ocean Coastal Management, 47:
197–205.
Jackson, A. L., Inger, R., Parnell, A. C., and Bearhop, S. 2011. Compar-
ing isotopic niche widths among and within communities: SIBER—
stable isotope Bayesian ellipses in R. Journal of Animal Ecology, 80:
595–602.
Lamb, R., and Johnson, D. 2010. Trophic restructuring of coral reef
fish communities in a large marine reserve. Marine Ecology Progress
Series, 408: 169–180.
Layman, C. A., Arrington, D. A., Montaña, C. G., and Post, D. M. 2007.
Can stable isotope ratios provide for community-wide measures of
trophic structure? Ecology, 88: 42–48.
Libralato, S., Coll, M., Tempesta, M., and Santojanni, A. 2010. Food-
web traits of protected and exploited areas of the Adriatic Sea. Bio-
logical Conservation, 143: 2182–2194.
López-Rasgado, F. J., Lluch-Cota, S. E., Balart, E. F., and Herzka, S. Z.
2016. Variation in isotopic trophic structure and fish diversity in
mangrove systems subject to different levels of habitat modification
in the Gulf of California, Mexico. Bulletin of Marine Science, 92:
399–422.
Marsh, J. M., Mueter, F. J., Iken, K., and Danielson, S. 2017. Onto-
genetic, spatial and temporal variation in trophic level and diet of
Chukchi Sea fishes. Deep Sea Research Part II, 135: 78–94.
Marshall, H. H., Inger, R., Jackson, A. L., McDonald, R. A., Thompson,
F. J., and Cant, M. A. 2019. Stable isotopes are quantitative indica-
tors of trophic niche. Ecology Letters, 22: 1990–1992.
Maynou, F., Morales-Nin, B., Cabanellas-Reboredo, M., Palmer, M.,
García, E., and Grau, A. M. 2013. Small-scale fisheries in the Balearic
Islands (W Mediterranean): a socio-economic approach. Fisheries
Research, 139: 11–17.
McCauley, D. J., Pinsky, M. L., Palumbi, S. R., Estes, J. A., Joyce, F.
H., and Warner, R. R. 2015. Marine defaunation: animal loss in the
global ocean. Science, 347: 1255641.
McClanahan, T. R., Schroeder, R. E.,Friedlander, Vigliola, L., Wantierz,
L., Caselle, J. E., Graham, N.A.J. et al. 2019. Global baselines and
benchmarks for fish biomass: comparing remote reefs and fisheries
closures. Marine Ecology Progress Series, 612: 167–192.
Morales-Nin, B., and Moranta, J. 1997. Life history and fishery of
the common dentex (Dentex dentex) in Mallorca (Balearic Islands,
western Mediterranean). Fisheries Research, 30: 67–76.
Morales-Nin, B., Moranta, J., García, C., Tugores, M. P., Grau, A. M.,
Riera, F., and Cerdà, M. 2005. The recreational fishery off Majorca
Island (western Mediterranean): some implications for coastal re-
source management. ICES Journal of Marine Science, 62: 727–739.
Moranta, J., Reñones, O., Gouraguine, A., Saporiti, F., and Cardona,
L., 2020. The effects of fishing on the ontogeny of trophic position
and body condition of a small-sized temperate marine fish. Marine
Environmental Research, 161: 105055.
Morey, G., Moranta, J., Massutí, E., Grau, A., Linde, M., Riera, F.,
and Morales-Nin, B. 2003. Weight–length relationships of littoral
to lower slope fishes from the western Mediterranean. Fisheries Re-
search, 62: 89–96.
Moro, S., Jona-Lasinio, G., Block, B., Micheli, F., De Leo, G., Ser-
ena, F., Bottaro, M. et al. 2019. Abundance and distribution of
the white shark in the Mediterranean Sea. Fish and Fisheries, 21:
338–349.
Downloaded
from
https://academic.oup.com/icesjms/advance-article/doi/10.1093/icesjms/fsac229/6962286
by
guest
on
12
February
2023
Food web structure in marine protected areas 15
Myers, R. A., Baum, J. K., Sheperd, T. D., Powers, S. P., and Peteron,
C. H. 2007. Cascading effects of the loss of apex predatory sharks
from a coastal ocean. Science, 315: 1846–1850.
Newsome, S. D., Martinez del Rio, C., Bearhop, S., and Phillips, D. L.
2007. A niche for isotope ecology. Frontiers in Ecology and the En-
vironment, 5: 429–436.
Nuez, I., Gazo, M., and Cardona, L. 2021. A closer look at the by-
catch of medium-sized and large sharks in the northern Catalan
coast (north-western Mediterranean Sea): evidence of an ongoing
decline? Aquatic Conservation: Marine and Freshwater Ecosystems,
31: 2369–238.
Ólafsdóttir, G. Á., Edvardsson, R., Timsic, S., Harrison, R., and Pat-
terson, W. P. 2021. A millennium of trophic stability in Atlantic cod
(Gadus morhua): transition to a lower and converging trophic niche
in modern times. Scientific Reports, 11: 1–11.
Olson, A. M., Trebilco, R., and Salomon, A. K. 2019. Expanded con-
sumer niche widths may signal an early response to spatial protec-
tion. PLoS One, 14: e0223748.
Olson, A., Frid, A., Santos, J., and Juanes, F. 2020. Trophic position
scales positively with body size within but not among four species
of rocky reef predators. Marine Ecology Progress Series, 640: 189–
200.
Ordines, F., Moranta, J., Palmer, M., Lerycke, A., Suau, A., Morales-
Nin, B., and Grau, A. 2005. Variations in a shallow rocky reef fish
community at different spatial scales in the western Mediterranean
Sea. Marine Ecology Progress Series, 304: 221–233.
Ouréns, R., Cambiè, G., and Freire, J. 2015. Characterizing the com-
plexity of the fleet dynamics for an effective fisheries management:
the case of the Cíes Islands (NW Spain). Scientia Marina, 79: 453–
464.
Palmer, M., Balle, S., March, D., Alós, J., and Linde, M. 2011. Size
estimation of circular home range from fish mark-release-(single)-
recapture data: case study of a small labrid targeted by ecreational
fishing. Marine Ecology Progress Series, 430: 87–97.
Pastor, J., Verdoit-Jarraya, M., Astruch, P., Dalias, N., Nelva Pasqual,
J.-S., Saragoni, G., and Lenfant, P. 2009. Acoustic telemetry survey
of the dusky grouper (Epinephelus marginatus) in the Marine Re-
serve of Cerbère-Banyuls: informations on the territoriality of this
emblematic species. Comptes Rendues Biologies, 332: 732–740.
Piroddi, C., Coll, M., Steenbeek, J., Macias Moy, D., and Christensen, V.
2015. Modelling the Mediterranean marine ecosystem as a whole:
assessing the challenge of complexity. Marine Ecology Progress Se-
ries, 533: 47–65.
Pita, P., and Freire, J. 2011. Movements of three large coastal preda-
tory fishes in the northeast Atlantic: a preliminary telemetry study.
Scientia Marina, 75: 759–770.
Pita, P., and Freire, J. 2016. Assessing the impact of spear fishing by
using competition records and underwater visual censuses. Scientia
Marina, 80: 27–28.
Pita, P., and Freire, J. 2019. Trophic ecology of an Atlantic kelp forest
fish assemblage (NW Spain) targeted by recreational fishers and im-
plications for coastal management. Journal of the Marine Biological
Association of the United Kingdom, 99: 19–29.
Pulliam, H. R. 1974. On the theory of optimal diets. The American
Naturalists, 108: 59–74.
Reñones, O., Piñeiro, C., Mas, X., and Goñi, R. 2007. Age and growth
of the dusky grouper Epinephelus marginatus (Lowe 1834) in an
exploited population of the western Mediterranean Sea. Journal of
Fish Biology, 71: 346–362.
Reñones, O., Polunin, N.V.C., and Goñi, R. 2002. Size related dietary
shifts of Epinephelus marginatus in a western Mediterranean littoral
ecosystem: an isotope and stomach content analysis. Journal of Fish
Biology, 61: 122–137.
Roff, G., Doropoulos, C., Rogers, A., Bozec, Y. M., Krueck, N. C., Au-
rellado, E., Priest, M. et al. 2016. The ecological role of sharks on
coral reefs. Trends in Ecology and Evolution, 31: 395–407.
Sala, E. 2004. The past and present topology and structure of Mediter-
ranean subtidal rocky-shore food webs. Ecosystems, 7: 333–340.
Sala, E., and Ballesteros, E. 1997. Partitioning of space and food re-
sources by three fish of the genus Diplodus (Sparidae) in a Mediter-
ranean rocky infralittoral ecosystem. Marine Ecology Progress Se-
ries, 15: 273–283.
Sala, E., Ballesteros, E., Dendrinos, P., Di Franco, A., Ferretti, F., Fo-
ley, D., Fraschetti, S. et al. 2012. The structure of Mediterranean
rocky reef ecosystems across environmental and human gradients,
and conservation implications. PLoS One 7: e32742.
Sandin, S. A., Smith, J. E., DeMartini, E. E., Dinsdale, E. A., Donner, S.
D., Friedlander, A. M., and Sala, E. 2008. Baselines and degradation
of coral reefs in the Northern Line Islands. PLoS One, 3: e1548.
Saporiti, F., Bearhop, S., Silva, L., Vales, D. G., Zenteno, L., Crespo, E.
A., Aguilar, A. et al. 2014. Longer and less overlapping food webs in
anthropogenically disturbed marine ecosystems: confirmations from
the ast. PLoS One, 9: e103132.
Saporiti, F., Bearhop, S., Vales, D. G., Silva, L., Zenteno, L., Tavares,
M., Crespo, E. A. et al. 2015. Latitudinal changes in the structure
of marine food webs in the southwestern Atlantic Ocean. Marine
Ecology Progress Series, 538: 23–34.
Schoener, T. W. 1971. Theory of feeding strategies. Annual Review of
Ecology and Systematics, 2: 369–404.
Skrzypek, G. 2013. Normalization procedures and reference material
selection in stable HCNOS isotope analyses: an overview. Analytical
and Bioanalytical Chemistry, 405: 2815–2823.
Spitz, J., Chouvelon, T., Cardinaud, M., Kostecki, C., and Lorance, P.
2013. Prey preferences of adult sea bass Dicentrarchus labrax in the
northeastern Atlantic: implications for bycatch of common dolphin
Delphinus delphis. ICES Journal of Marine Science, 70: 452–461.
Stephens, D. W., and Krebs, J. R. 1986. Foraging Theory. Princeton Uni-
versity Press, Princeton, NJ.
Stuthmann, L. E., and Castellanos-Galindo, G. A. 2020. Trophic posi-
tion and isotopic niche of mangrove fish assemblages at both sides
of the Isthmus of Panama. Bulletin of Marine Science, 96: 449–467.
Syväranta, J., Lensu, A., Marjomäki, T. J., Oksanen, S., and Jones, R.
I. 2013. An empirical evaluation of the utility of Convex Hull and
Standard Ellipse Areas for assessing population niche widths from
stable isotope data. PLoS One, 8: e56094.
Villegas-Ríos, D., Alonso-Fernández, A., Fabeiro, M., Bañón, R., and
Saborido-Rey, F. 2013a. Demographic variation between colour pat-
terns in a temperate protogynous hermaphrodite, the ballan wrasse
Labrus bergylta. PLoS One, 8: e71591.
Villegas-Ríos, D., Alós, J., March, D., Palmer, M., Mucientes, G., and
Saborido-Rey, F. 2013b. Home range and diel behavior of the ballan
wrasse, Labrus bergylta, determined by acoustic telemetry. Journal
of Sea Research, 80: 61–71.
Werner, E. E., and Hall, D. J. 1974. Optimal foraging and the size selec-
tion of prey by the bluegill sunfish (Lepomis macrochirus). Ecology,
55: 1042–1052.
Zar, J. H., 1996. Bioestatistical Analysis. Prentice Hall, New Jersey, NJ.
662pp.
Handling Editor: Mary Hunsicker
Downloaded
from
https://academic.oup.com/icesjms/advance-article/doi/10.1093/icesjms/fsac229/6962286
by
guest
on
12
February
2023

Weitere ähnliche Inhalte

Ähnlich wie Fishery impacts on trophic structure of carnivorous fish

Freshwater gastropod diversity in the selected lotic environment, Betong, Sar...
Freshwater gastropod diversity in the selected lotic environment, Betong, Sar...Freshwater gastropod diversity in the selected lotic environment, Betong, Sar...
Freshwater gastropod diversity in the selected lotic environment, Betong, Sar...AbdullaAlAsif1
 
Alex_Brown_MRes_thesis_compiled_21_Aug_2006
Alex_Brown_MRes_thesis_compiled_21_Aug_2006Alex_Brown_MRes_thesis_compiled_21_Aug_2006
Alex_Brown_MRes_thesis_compiled_21_Aug_2006Alex Brown
 
Species composition of benthic macroalgae in the coastal areas of Surigao Cit...
Species composition of benthic macroalgae in the coastal areas of Surigao Cit...Species composition of benthic macroalgae in the coastal areas of Surigao Cit...
Species composition of benthic macroalgae in the coastal areas of Surigao Cit...Innspub Net
 
Evaluation of the oyster farming potential of the Cintra bay (southern Morocco)
Evaluation of the oyster farming potential of the Cintra bay (southern Morocco)Evaluation of the oyster farming potential of the Cintra bay (southern Morocco)
Evaluation of the oyster farming potential of the Cintra bay (southern Morocco)Origins publication
 
Applications Of DNA Barcoding To Fish Landings Authentication And Diversity ...
Applications Of DNA Barcoding To Fish Landings  Authentication And Diversity ...Applications Of DNA Barcoding To Fish Landings  Authentication And Diversity ...
Applications Of DNA Barcoding To Fish Landings Authentication And Diversity ...Heather Strinden
 
Differential Impacts of 2016 Coral Bleaching on Coral Reef Benthic communitie...
Differential Impacts of 2016 Coral Bleaching on Coral Reef Benthic communitie...Differential Impacts of 2016 Coral Bleaching on Coral Reef Benthic communitie...
Differential Impacts of 2016 Coral Bleaching on Coral Reef Benthic communitie...anbiocore
 
Abundance Plankton and Analysis Stomach Content and Trophic Level in Makassar...
Abundance Plankton and Analysis Stomach Content and Trophic Level in Makassar...Abundance Plankton and Analysis Stomach Content and Trophic Level in Makassar...
Abundance Plankton and Analysis Stomach Content and Trophic Level in Makassar...Agriculture Journal IJOEAR
 
2011 nutrient enrichment caused by marine cage
2011 nutrient enrichment caused by marine cage2011 nutrient enrichment caused by marine cage
2011 nutrient enrichment caused by marine cageearambulm3
 
Flats Ecology Research Poster
Flats Ecology Research PosterFlats Ecology Research Poster
Flats Ecology Research PosterKate Maroni
 
Changing patch dynamics of Cape eelgrass Zostera capensis: impacts of loss on...
Changing patch dynamics of Cape eelgrass Zostera capensis: impacts of loss on...Changing patch dynamics of Cape eelgrass Zostera capensis: impacts of loss on...
Changing patch dynamics of Cape eelgrass Zostera capensis: impacts of loss on...Joseph Galaske
 
Effect of water parameters on temporal distribution and abundance of zooplank...
Effect of water parameters on temporal distribution and abundance of zooplank...Effect of water parameters on temporal distribution and abundance of zooplank...
Effect of water parameters on temporal distribution and abundance of zooplank...AbdullaAlAsif1
 
11.[8 17]length-weight relationships of some important estuarine fish species...
11.[8 17]length-weight relationships of some important estuarine fish species...11.[8 17]length-weight relationships of some important estuarine fish species...
11.[8 17]length-weight relationships of some important estuarine fish species...Alexander Decker
 
REVIEW ON VARIOUS RESEARCH PAPERS
REVIEW ON VARIOUS RESEARCH PAPERS REVIEW ON VARIOUS RESEARCH PAPERS
REVIEW ON VARIOUS RESEARCH PAPERS RNJAYSWAL
 
Congo basin peatlands_threats_and_conservation_pri
Congo basin peatlands_threats_and_conservation_priCongo basin peatlands_threats_and_conservation_pri
Congo basin peatlands_threats_and_conservation_priaujourlejour1
 
Camargo, maldonado et al 2008
Camargo, maldonado et al 2008Camargo, maldonado et al 2008
Camargo, maldonado et al 2008Carolina Camargo
 
Population dynamics of tinfoil barb, barbonymus schwanenfeldii (bleeker, 1853...
Population dynamics of tinfoil barb, barbonymus schwanenfeldii (bleeker, 1853...Population dynamics of tinfoil barb, barbonymus schwanenfeldii (bleeker, 1853...
Population dynamics of tinfoil barb, barbonymus schwanenfeldii (bleeker, 1853...Alexander Decker
 
Physico-chemical parameters and macrobenthic invertebrates of the intertidal ...
Physico-chemical parameters and macrobenthic invertebrates of the intertidal ...Physico-chemical parameters and macrobenthic invertebrates of the intertidal ...
Physico-chemical parameters and macrobenthic invertebrates of the intertidal ...Angelo Mark Walag
 
MyctophidFeedingEcology
MyctophidFeedingEcologyMyctophidFeedingEcology
MyctophidFeedingEcologyWalter Conley
 

Ähnlich wie Fishery impacts on trophic structure of carnivorous fish (20)

Freshwater gastropod diversity in the selected lotic environment, Betong, Sar...
Freshwater gastropod diversity in the selected lotic environment, Betong, Sar...Freshwater gastropod diversity in the selected lotic environment, Betong, Sar...
Freshwater gastropod diversity in the selected lotic environment, Betong, Sar...
 
Alex_Brown_MRes_thesis_compiled_21_Aug_2006
Alex_Brown_MRes_thesis_compiled_21_Aug_2006Alex_Brown_MRes_thesis_compiled_21_Aug_2006
Alex_Brown_MRes_thesis_compiled_21_Aug_2006
 
Species composition of benthic macroalgae in the coastal areas of Surigao Cit...
Species composition of benthic macroalgae in the coastal areas of Surigao Cit...Species composition of benthic macroalgae in the coastal areas of Surigao Cit...
Species composition of benthic macroalgae in the coastal areas of Surigao Cit...
 
Evaluation of the oyster farming potential of the Cintra bay (southern Morocco)
Evaluation of the oyster farming potential of the Cintra bay (southern Morocco)Evaluation of the oyster farming potential of the Cintra bay (southern Morocco)
Evaluation of the oyster farming potential of the Cintra bay (southern Morocco)
 
Applications Of DNA Barcoding To Fish Landings Authentication And Diversity ...
Applications Of DNA Barcoding To Fish Landings  Authentication And Diversity ...Applications Of DNA Barcoding To Fish Landings  Authentication And Diversity ...
Applications Of DNA Barcoding To Fish Landings Authentication And Diversity ...
 
Differential Impacts of 2016 Coral Bleaching on Coral Reef Benthic communitie...
Differential Impacts of 2016 Coral Bleaching on Coral Reef Benthic communitie...Differential Impacts of 2016 Coral Bleaching on Coral Reef Benthic communitie...
Differential Impacts of 2016 Coral Bleaching on Coral Reef Benthic communitie...
 
Abundance Plankton and Analysis Stomach Content and Trophic Level in Makassar...
Abundance Plankton and Analysis Stomach Content and Trophic Level in Makassar...Abundance Plankton and Analysis Stomach Content and Trophic Level in Makassar...
Abundance Plankton and Analysis Stomach Content and Trophic Level in Makassar...
 
2011 nutrient enrichment caused by marine cage
2011 nutrient enrichment caused by marine cage2011 nutrient enrichment caused by marine cage
2011 nutrient enrichment caused by marine cage
 
Mpeza publication
Mpeza publicationMpeza publication
Mpeza publication
 
Flats Ecology Research Poster
Flats Ecology Research PosterFlats Ecology Research Poster
Flats Ecology Research Poster
 
Changing patch dynamics of Cape eelgrass Zostera capensis: impacts of loss on...
Changing patch dynamics of Cape eelgrass Zostera capensis: impacts of loss on...Changing patch dynamics of Cape eelgrass Zostera capensis: impacts of loss on...
Changing patch dynamics of Cape eelgrass Zostera capensis: impacts of loss on...
 
Effect of water parameters on temporal distribution and abundance of zooplank...
Effect of water parameters on temporal distribution and abundance of zooplank...Effect of water parameters on temporal distribution and abundance of zooplank...
Effect of water parameters on temporal distribution and abundance of zooplank...
 
11.[8 17]length-weight relationships of some important estuarine fish species...
11.[8 17]length-weight relationships of some important estuarine fish species...11.[8 17]length-weight relationships of some important estuarine fish species...
11.[8 17]length-weight relationships of some important estuarine fish species...
 
REVIEW ON VARIOUS RESEARCH PAPERS
REVIEW ON VARIOUS RESEARCH PAPERS REVIEW ON VARIOUS RESEARCH PAPERS
REVIEW ON VARIOUS RESEARCH PAPERS
 
Congo basin peatlands_threats_and_conservation_pri
Congo basin peatlands_threats_and_conservation_priCongo basin peatlands_threats_and_conservation_pri
Congo basin peatlands_threats_and_conservation_pri
 
Camargo, maldonado et al 2008
Camargo, maldonado et al 2008Camargo, maldonado et al 2008
Camargo, maldonado et al 2008
 
Ecomorfologia
EcomorfologiaEcomorfologia
Ecomorfologia
 
Population dynamics of tinfoil barb, barbonymus schwanenfeldii (bleeker, 1853...
Population dynamics of tinfoil barb, barbonymus schwanenfeldii (bleeker, 1853...Population dynamics of tinfoil barb, barbonymus schwanenfeldii (bleeker, 1853...
Population dynamics of tinfoil barb, barbonymus schwanenfeldii (bleeker, 1853...
 
Physico-chemical parameters and macrobenthic invertebrates of the intertidal ...
Physico-chemical parameters and macrobenthic invertebrates of the intertidal ...Physico-chemical parameters and macrobenthic invertebrates of the intertidal ...
Physico-chemical parameters and macrobenthic invertebrates of the intertidal ...
 
MyctophidFeedingEcology
MyctophidFeedingEcologyMyctophidFeedingEcology
MyctophidFeedingEcology
 

Mehr von AproximacionAlFuturo

Chile Report - What Worries the World - enero 2024
Chile Report - What Worries the World - enero 2024Chile Report - What Worries the World - enero 2024
Chile Report - What Worries the World - enero 2024AproximacionAlFuturo
 
N°25 Claves Ipsos - edicion de Enero de 2024
N°25 Claves Ipsos - edicion de Enero de 2024N°25 Claves Ipsos - edicion de Enero de 2024
N°25 Claves Ipsos - edicion de Enero de 2024AproximacionAlFuturo
 
Encuesta Chile Nos Habla Pensiones USS enero 2024.pdf
Encuesta Chile Nos Habla Pensiones USS enero 2024.pdfEncuesta Chile Nos Habla Pensiones USS enero 2024.pdf
Encuesta Chile Nos Habla Pensiones USS enero 2024.pdfAproximacionAlFuturo
 
Informe What Worries the World_Resumen global - Octubre 2023.pdf
Informe What Worries the World_Resumen global - Octubre 2023.pdfInforme What Worries the World_Resumen global - Octubre 2023.pdf
Informe What Worries the World_Resumen global - Octubre 2023.pdfAproximacionAlFuturo
 
Common Beans as a Source of Amino Acids and Cofactors for Collagen Biosynthesis
Common Beans as a Source of Amino Acids and Cofactors for Collagen Biosynthesis Common Beans as a Source of Amino Acids and Cofactors for Collagen Biosynthesis
Common Beans as a Source of Amino Acids and Cofactors for Collagen Biosynthesis AproximacionAlFuturo
 
Estudio “Monitor Global de Salud” de consultora Ipsos
Estudio “Monitor Global de Salud” de consultora IpsosEstudio “Monitor Global de Salud” de consultora Ipsos
Estudio “Monitor Global de Salud” de consultora IpsosAproximacionAlFuturo
 
Identifying the Determinants of the Increase in Native Forests in Southern Chile
Identifying the Determinants of the Increase in Native Forests in Southern ChileIdentifying the Determinants of the Increase in Native Forests in Southern Chile
Identifying the Determinants of the Increase in Native Forests in Southern ChileAproximacionAlFuturo
 
World Bank Report - Wired: Digital Connectivity for Inclusion and Growth
World Bank Report - Wired: Digital Connectivity for Inclusion and GrowthWorld Bank Report - Wired: Digital Connectivity for Inclusion and Growth
World Bank Report - Wired: Digital Connectivity for Inclusion and GrowthAproximacionAlFuturo
 
Encuesta "Chile Nos Habla" - Ley de Presupuesto 2024.pdf
Encuesta "Chile Nos Habla" - Ley de Presupuesto 2024.pdfEncuesta "Chile Nos Habla" - Ley de Presupuesto 2024.pdf
Encuesta "Chile Nos Habla" - Ley de Presupuesto 2024.pdfAproximacionAlFuturo
 
estudio de Digitalización de las Empresas en Chile - Entel Digital
estudio de Digitalización de las Empresas en Chile - Entel Digitalestudio de Digitalización de las Empresas en Chile - Entel Digital
estudio de Digitalización de las Empresas en Chile - Entel DigitalAproximacionAlFuturo
 
Encuesta "Chile Nos Habla" Seguridad
 Encuesta "Chile Nos Habla" Seguridad Encuesta "Chile Nos Habla" Seguridad
Encuesta "Chile Nos Habla" SeguridadAproximacionAlFuturo
 
Reportes Enadel 2022 sobre Comercio y Turismo en Region de OHiggins
Reportes Enadel 2022 sobre Comercio y Turismo en Region de OHigginsReportes Enadel 2022 sobre Comercio y Turismo en Region de OHiggins
Reportes Enadel 2022 sobre Comercio y Turismo en Region de OHigginsAproximacionAlFuturo
 
Conecta Innovacion Agro - Marchigue.pdf
Conecta Innovacion Agro - Marchigue.pdfConecta Innovacion Agro - Marchigue.pdf
Conecta Innovacion Agro - Marchigue.pdfAproximacionAlFuturo
 
Decreto del Ministerio del Interior y Seguridad Pública del 24 de junio de 2023
Decreto del Ministerio del Interior y Seguridad Pública del 24 de junio de 2023Decreto del Ministerio del Interior y Seguridad Pública del 24 de junio de 2023
Decreto del Ministerio del Interior y Seguridad Pública del 24 de junio de 2023AproximacionAlFuturo
 
Informe de la Comisión de Alto Nivel sobre Salud Mental y COVID-19 de la Orga...
Informe de la Comisión de Alto Nivel sobre Salud Mental y COVID-19 de la Orga...Informe de la Comisión de Alto Nivel sobre Salud Mental y COVID-19 de la Orga...
Informe de la Comisión de Alto Nivel sobre Salud Mental y COVID-19 de la Orga...AproximacionAlFuturo
 
Reporte ADP Personas y Trabajo 2023: una visión sobre el equipo humano global.
Reporte ADP Personas y Trabajo 2023: una visión sobre el equipo humano global.Reporte ADP Personas y Trabajo 2023: una visión sobre el equipo humano global.
Reporte ADP Personas y Trabajo 2023: una visión sobre el equipo humano global.AproximacionAlFuturo
 
Encuesta Chile Nos Habla - Sistema Pensiones - Politicas Públicas USS.pdf
Encuesta Chile Nos Habla - Sistema Pensiones - Politicas Públicas USS.pdfEncuesta Chile Nos Habla - Sistema Pensiones - Politicas Públicas USS.pdf
Encuesta Chile Nos Habla - Sistema Pensiones - Politicas Públicas USS.pdfAproximacionAlFuturo
 
Estudio-de-Brechas-Region-de-Nuble.pdf
Estudio-de-Brechas-Region-de-Nuble.pdfEstudio-de-Brechas-Region-de-Nuble.pdf
Estudio-de-Brechas-Region-de-Nuble.pdfAproximacionAlFuturo
 

Mehr von AproximacionAlFuturo (20)

Chile Report - What Worries the World - enero 2024
Chile Report - What Worries the World - enero 2024Chile Report - What Worries the World - enero 2024
Chile Report - What Worries the World - enero 2024
 
N°25 Claves Ipsos - edicion de Enero de 2024
N°25 Claves Ipsos - edicion de Enero de 2024N°25 Claves Ipsos - edicion de Enero de 2024
N°25 Claves Ipsos - edicion de Enero de 2024
 
Encuesta Chile Nos Habla Pensiones USS enero 2024.pdf
Encuesta Chile Nos Habla Pensiones USS enero 2024.pdfEncuesta Chile Nos Habla Pensiones USS enero 2024.pdf
Encuesta Chile Nos Habla Pensiones USS enero 2024.pdf
 
Informe What Worries the World_Resumen global - Octubre 2023.pdf
Informe What Worries the World_Resumen global - Octubre 2023.pdfInforme What Worries the World_Resumen global - Octubre 2023.pdf
Informe What Worries the World_Resumen global - Octubre 2023.pdf
 
Common Beans as a Source of Amino Acids and Cofactors for Collagen Biosynthesis
Common Beans as a Source of Amino Acids and Cofactors for Collagen Biosynthesis Common Beans as a Source of Amino Acids and Cofactors for Collagen Biosynthesis
Common Beans as a Source of Amino Acids and Cofactors for Collagen Biosynthesis
 
Estudio “Monitor Global de Salud” de consultora Ipsos
Estudio “Monitor Global de Salud” de consultora IpsosEstudio “Monitor Global de Salud” de consultora Ipsos
Estudio “Monitor Global de Salud” de consultora Ipsos
 
Identifying the Determinants of the Increase in Native Forests in Southern Chile
Identifying the Determinants of the Increase in Native Forests in Southern ChileIdentifying the Determinants of the Increase in Native Forests in Southern Chile
Identifying the Determinants of the Increase in Native Forests in Southern Chile
 
World Bank Report - Wired: Digital Connectivity for Inclusion and Growth
World Bank Report - Wired: Digital Connectivity for Inclusion and GrowthWorld Bank Report - Wired: Digital Connectivity for Inclusion and Growth
World Bank Report - Wired: Digital Connectivity for Inclusion and Growth
 
Encuesta "Chile Nos Habla" - Ley de Presupuesto 2024.pdf
Encuesta "Chile Nos Habla" - Ley de Presupuesto 2024.pdfEncuesta "Chile Nos Habla" - Ley de Presupuesto 2024.pdf
Encuesta "Chile Nos Habla" - Ley de Presupuesto 2024.pdf
 
estudio de Digitalización de las Empresas en Chile - Entel Digital
estudio de Digitalización de las Empresas en Chile - Entel Digitalestudio de Digitalización de las Empresas en Chile - Entel Digital
estudio de Digitalización de las Empresas en Chile - Entel Digital
 
Encuesta "Chile Nos Habla" Seguridad
 Encuesta "Chile Nos Habla" Seguridad Encuesta "Chile Nos Habla" Seguridad
Encuesta "Chile Nos Habla" Seguridad
 
Reportes Enadel 2022 sobre Comercio y Turismo en Region de OHiggins
Reportes Enadel 2022 sobre Comercio y Turismo en Region de OHigginsReportes Enadel 2022 sobre Comercio y Turismo en Region de OHiggins
Reportes Enadel 2022 sobre Comercio y Turismo en Region de OHiggins
 
Conecta Innovacion Agro - Marchigue.pdf
Conecta Innovacion Agro - Marchigue.pdfConecta Innovacion Agro - Marchigue.pdf
Conecta Innovacion Agro - Marchigue.pdf
 
Claves Ipsos Julio 2023
Claves Ipsos Julio 2023 Claves Ipsos Julio 2023
Claves Ipsos Julio 2023
 
Informe Claves Ipsos Junio 2023
Informe Claves Ipsos Junio 2023 Informe Claves Ipsos Junio 2023
Informe Claves Ipsos Junio 2023
 
Decreto del Ministerio del Interior y Seguridad Pública del 24 de junio de 2023
Decreto del Ministerio del Interior y Seguridad Pública del 24 de junio de 2023Decreto del Ministerio del Interior y Seguridad Pública del 24 de junio de 2023
Decreto del Ministerio del Interior y Seguridad Pública del 24 de junio de 2023
 
Informe de la Comisión de Alto Nivel sobre Salud Mental y COVID-19 de la Orga...
Informe de la Comisión de Alto Nivel sobre Salud Mental y COVID-19 de la Orga...Informe de la Comisión de Alto Nivel sobre Salud Mental y COVID-19 de la Orga...
Informe de la Comisión de Alto Nivel sobre Salud Mental y COVID-19 de la Orga...
 
Reporte ADP Personas y Trabajo 2023: una visión sobre el equipo humano global.
Reporte ADP Personas y Trabajo 2023: una visión sobre el equipo humano global.Reporte ADP Personas y Trabajo 2023: una visión sobre el equipo humano global.
Reporte ADP Personas y Trabajo 2023: una visión sobre el equipo humano global.
 
Encuesta Chile Nos Habla - Sistema Pensiones - Politicas Públicas USS.pdf
Encuesta Chile Nos Habla - Sistema Pensiones - Politicas Públicas USS.pdfEncuesta Chile Nos Habla - Sistema Pensiones - Politicas Públicas USS.pdf
Encuesta Chile Nos Habla - Sistema Pensiones - Politicas Públicas USS.pdf
 
Estudio-de-Brechas-Region-de-Nuble.pdf
Estudio-de-Brechas-Region-de-Nuble.pdfEstudio-de-Brechas-Region-de-Nuble.pdf
Estudio-de-Brechas-Region-de-Nuble.pdf
 

Kürzlich hochgeladen

Carero dropshipping via API with DroFx.pptx
Carero dropshipping via API with DroFx.pptxCarero dropshipping via API with DroFx.pptx
Carero dropshipping via API with DroFx.pptxolyaivanovalion
 
Week-01-2.ppt BBB human Computer interaction
Week-01-2.ppt BBB human Computer interactionWeek-01-2.ppt BBB human Computer interaction
Week-01-2.ppt BBB human Computer interactionfulawalesam
 
Market Analysis in the 5 Largest Economic Countries in Southeast Asia.pdf
Market Analysis in the 5 Largest Economic Countries in Southeast Asia.pdfMarket Analysis in the 5 Largest Economic Countries in Southeast Asia.pdf
Market Analysis in the 5 Largest Economic Countries in Southeast Asia.pdfRachmat Ramadhan H
 
BabyOno dropshipping via API with DroFx.pptx
BabyOno dropshipping via API with DroFx.pptxBabyOno dropshipping via API with DroFx.pptx
BabyOno dropshipping via API with DroFx.pptxolyaivanovalion
 
Smarteg dropshipping via API with DroFx.pptx
Smarteg dropshipping via API with DroFx.pptxSmarteg dropshipping via API with DroFx.pptx
Smarteg dropshipping via API with DroFx.pptxolyaivanovalion
 
Unveiling Insights: The Role of a Data Analyst
Unveiling Insights: The Role of a Data AnalystUnveiling Insights: The Role of a Data Analyst
Unveiling Insights: The Role of a Data AnalystSamantha Rae Coolbeth
 
04242024_CCC TUG_Joins and Relationships
04242024_CCC TUG_Joins and Relationships04242024_CCC TUG_Joins and Relationships
04242024_CCC TUG_Joins and Relationshipsccctableauusergroup
 
April 2024 - Crypto Market Report's Analysis
April 2024 - Crypto Market Report's AnalysisApril 2024 - Crypto Market Report's Analysis
April 2024 - Crypto Market Report's Analysismanisha194592
 
代办国外大学文凭《原版美国UCLA文凭证书》加州大学洛杉矶分校毕业证制作成绩单修改
代办国外大学文凭《原版美国UCLA文凭证书》加州大学洛杉矶分校毕业证制作成绩单修改代办国外大学文凭《原版美国UCLA文凭证书》加州大学洛杉矶分校毕业证制作成绩单修改
代办国外大学文凭《原版美国UCLA文凭证书》加州大学洛杉矶分校毕业证制作成绩单修改atducpo
 
Edukaciniai dropshipping via API with DroFx
Edukaciniai dropshipping via API with DroFxEdukaciniai dropshipping via API with DroFx
Edukaciniai dropshipping via API with DroFxolyaivanovalion
 
Data-Analysis for Chicago Crime Data 2023
Data-Analysis for Chicago Crime Data  2023Data-Analysis for Chicago Crime Data  2023
Data-Analysis for Chicago Crime Data 2023ymrp368
 
FESE Capital Markets Fact Sheet 2024 Q1.pdf
FESE Capital Markets Fact Sheet 2024 Q1.pdfFESE Capital Markets Fact Sheet 2024 Q1.pdf
FESE Capital Markets Fact Sheet 2024 Q1.pdfMarinCaroMartnezBerg
 
Invezz.com - Grow your wealth with trading signals
Invezz.com - Grow your wealth with trading signalsInvezz.com - Grow your wealth with trading signals
Invezz.com - Grow your wealth with trading signalsInvezz1
 
Industrialised data - the key to AI success.pdf
Industrialised data - the key to AI success.pdfIndustrialised data - the key to AI success.pdf
Industrialised data - the key to AI success.pdfLars Albertsson
 
VidaXL dropshipping via API with DroFx.pptx
VidaXL dropshipping via API with DroFx.pptxVidaXL dropshipping via API with DroFx.pptx
VidaXL dropshipping via API with DroFx.pptxolyaivanovalion
 
Midocean dropshipping via API with DroFx
Midocean dropshipping via API with DroFxMidocean dropshipping via API with DroFx
Midocean dropshipping via API with DroFxolyaivanovalion
 
Halmar dropshipping via API with DroFx
Halmar  dropshipping  via API with DroFxHalmar  dropshipping  via API with DroFx
Halmar dropshipping via API with DroFxolyaivanovalion
 
Low Rate Call Girls Bhilai Anika 8250192130 Independent Escort Service Bhilai
Low Rate Call Girls Bhilai Anika 8250192130 Independent Escort Service BhilaiLow Rate Call Girls Bhilai Anika 8250192130 Independent Escort Service Bhilai
Low Rate Call Girls Bhilai Anika 8250192130 Independent Escort Service BhilaiSuhani Kapoor
 
Mature dropshipping via API with DroFx.pptx
Mature dropshipping via API with DroFx.pptxMature dropshipping via API with DroFx.pptx
Mature dropshipping via API with DroFx.pptxolyaivanovalion
 

Kürzlich hochgeladen (20)

Carero dropshipping via API with DroFx.pptx
Carero dropshipping via API with DroFx.pptxCarero dropshipping via API with DroFx.pptx
Carero dropshipping via API with DroFx.pptx
 
Week-01-2.ppt BBB human Computer interaction
Week-01-2.ppt BBB human Computer interactionWeek-01-2.ppt BBB human Computer interaction
Week-01-2.ppt BBB human Computer interaction
 
Market Analysis in the 5 Largest Economic Countries in Southeast Asia.pdf
Market Analysis in the 5 Largest Economic Countries in Southeast Asia.pdfMarket Analysis in the 5 Largest Economic Countries in Southeast Asia.pdf
Market Analysis in the 5 Largest Economic Countries in Southeast Asia.pdf
 
BabyOno dropshipping via API with DroFx.pptx
BabyOno dropshipping via API with DroFx.pptxBabyOno dropshipping via API with DroFx.pptx
BabyOno dropshipping via API with DroFx.pptx
 
Smarteg dropshipping via API with DroFx.pptx
Smarteg dropshipping via API with DroFx.pptxSmarteg dropshipping via API with DroFx.pptx
Smarteg dropshipping via API with DroFx.pptx
 
Unveiling Insights: The Role of a Data Analyst
Unveiling Insights: The Role of a Data AnalystUnveiling Insights: The Role of a Data Analyst
Unveiling Insights: The Role of a Data Analyst
 
04242024_CCC TUG_Joins and Relationships
04242024_CCC TUG_Joins and Relationships04242024_CCC TUG_Joins and Relationships
04242024_CCC TUG_Joins and Relationships
 
April 2024 - Crypto Market Report's Analysis
April 2024 - Crypto Market Report's AnalysisApril 2024 - Crypto Market Report's Analysis
April 2024 - Crypto Market Report's Analysis
 
꧁❤ Aerocity Call Girls Service Aerocity Delhi ❤꧂ 9999965857 ☎️ Hard And Sexy ...
꧁❤ Aerocity Call Girls Service Aerocity Delhi ❤꧂ 9999965857 ☎️ Hard And Sexy ...꧁❤ Aerocity Call Girls Service Aerocity Delhi ❤꧂ 9999965857 ☎️ Hard And Sexy ...
꧁❤ Aerocity Call Girls Service Aerocity Delhi ❤꧂ 9999965857 ☎️ Hard And Sexy ...
 
代办国外大学文凭《原版美国UCLA文凭证书》加州大学洛杉矶分校毕业证制作成绩单修改
代办国外大学文凭《原版美国UCLA文凭证书》加州大学洛杉矶分校毕业证制作成绩单修改代办国外大学文凭《原版美国UCLA文凭证书》加州大学洛杉矶分校毕业证制作成绩单修改
代办国外大学文凭《原版美国UCLA文凭证书》加州大学洛杉矶分校毕业证制作成绩单修改
 
Edukaciniai dropshipping via API with DroFx
Edukaciniai dropshipping via API with DroFxEdukaciniai dropshipping via API with DroFx
Edukaciniai dropshipping via API with DroFx
 
Data-Analysis for Chicago Crime Data 2023
Data-Analysis for Chicago Crime Data  2023Data-Analysis for Chicago Crime Data  2023
Data-Analysis for Chicago Crime Data 2023
 
FESE Capital Markets Fact Sheet 2024 Q1.pdf
FESE Capital Markets Fact Sheet 2024 Q1.pdfFESE Capital Markets Fact Sheet 2024 Q1.pdf
FESE Capital Markets Fact Sheet 2024 Q1.pdf
 
Invezz.com - Grow your wealth with trading signals
Invezz.com - Grow your wealth with trading signalsInvezz.com - Grow your wealth with trading signals
Invezz.com - Grow your wealth with trading signals
 
Industrialised data - the key to AI success.pdf
Industrialised data - the key to AI success.pdfIndustrialised data - the key to AI success.pdf
Industrialised data - the key to AI success.pdf
 
VidaXL dropshipping via API with DroFx.pptx
VidaXL dropshipping via API with DroFx.pptxVidaXL dropshipping via API with DroFx.pptx
VidaXL dropshipping via API with DroFx.pptx
 
Midocean dropshipping via API with DroFx
Midocean dropshipping via API with DroFxMidocean dropshipping via API with DroFx
Midocean dropshipping via API with DroFx
 
Halmar dropshipping via API with DroFx
Halmar  dropshipping  via API with DroFxHalmar  dropshipping  via API with DroFx
Halmar dropshipping via API with DroFx
 
Low Rate Call Girls Bhilai Anika 8250192130 Independent Escort Service Bhilai
Low Rate Call Girls Bhilai Anika 8250192130 Independent Escort Service BhilaiLow Rate Call Girls Bhilai Anika 8250192130 Independent Escort Service Bhilai
Low Rate Call Girls Bhilai Anika 8250192130 Independent Escort Service Bhilai
 
Mature dropshipping via API with DroFx.pptx
Mature dropshipping via API with DroFx.pptxMature dropshipping via API with DroFx.pptx
Mature dropshipping via API with DroFx.pptx
 

Fishery impacts on trophic structure of carnivorous fish

  • 1. ICES Journal of Marine Science, 2022, 0, 1–15 DOI: 10.1093/icesjms/fsac229 Original Article Effects of fishing on the trophic structure of carnivorous fish assemblages from shallow rocky bottoms of the Mediterranean Sea and the temperate Atlantic Ocean Luis Cardona 1,* , Olga Reñones2 , Adam Gouraguine3 , Fabiana Saporiti1 , Asunción Borrell 1 , Alex Aguilar1 and Joan Moranta2 1 IRBio and Department of Evolutionary Biology, Ecology and Environmental Science, Faculty of Biology, University of Barcelona, Barcelona 08028, Spain 2 Instituto Español de Oceanografía (IEO, CSIC), Centre Oceanogràfic de Balears, Ecosystem Oceanography Group (GRECO), Palma 07015, Spain 3 School of Natural and Environmental Sciences, Newcastle University, Newcastle-Upon-Tyne NE1 7RU, UK *Corresponding author: tel:+34934031368; e-mail: luis.cardona@ub.edu. Here, we assess whether fishery exploitation affects the trophic structure of carnivorous fish. We censused fish and analysed the stable isotope ratios of C and N of species targeted by fishermen in areas open to fishing and marine protected areas (MPAs) in the Mediterranean Sea and the north-eastern Atlantic Ocean. Results demonstrated a major impact of fishing on the biomass and size structure of nektobenthic carnivorous fish. However, those changes did not modify the diversity of the trophic resources used by the assemblage, the pattern of resource partitioning between species, or the degree of trophic redundancy. These results add to recent evidence suggesting that MPAs implemented in fished seascapes may fail to restore the original structure of the food webs that once existed in pre-fished ecosystems because regional decimation and extinction of highly mobile predators prevent recovering the original diversity of predators at local scales, even in no-take areas. If so, more strict local fishing regulations are unlikely to restore the original diversity of high trophic level carnivores and restoration goals should be reframed in terms of an objective that is less unrealistic than restoring the pre-fished condition while still recovering aspects of the historical trophic structure. Keywords: fishing, food web structure, marine protected areas, predation, stable isotope analysis. Introduction Fishing has had a profound effect on the biomass of carni- vores in most marine ecosystems worldwide (McCauley et al., 2015). As a result, the functional role of carnivores in present-day fishery-driven ecosystems has been largely sup- pressed (Estes et al., 2011; Roff et al., 2016; Hammerschlag et al., 2019). Remaining predatory interactions are greatly re- duced compared to those occurring prior to industrial fishing (Cheng et al., 2019; Eger and Baum, 2020), and the structure of marine food webs has been profoundly altered (Frank et al., 2005; Myers et al., 2007; Heithaus et al., 2012), a change that often started well before the monitoring of fishing impact (Saporiti et al., 2014; Bas et al., 2019; Ólafsdóttir et al., 2021). Marine protected areas (MPAs) are the primary manage- ment tool of marine conservation and have been proposed to restore the original structure and functioning of marine ecosystems (Sandin et al., 2008; Lamb and Johnson, 2010; Cheng et al., 2019; Eger and Baum, 2020). The restoration of the size structure of fish populations is one of the ex- pected benefits of MPAs (Baskett and Barnett, 2015), because fish live longer, grow larger, and attain higher densities and biomass within well-managed MPAs (Halpern, 2003; Hilborn et al., 2004; Baskett and Barnett, 2015). This can in turn result in increased mortality rates for prey, compared to areas open to fishing (Cheng et al., 2019; Eger and Baum, 2020), and may elicit risk avoidance responses, thus modifying the habitat use patterns of herbivores and mesopredators (Bond et al., 2019; Hammerschlag et al., 2019). Those changes may trigger trophic cascades, and assessing their strength has been the focus of most of the previous research on the so-called “reserve effect” (Sala et al., 2012; Cheng et al., 2019; Eger and Baum, 2020). Gape size and maximum prey body size escalate with body size in carnivorous fish (Gill, 2003), which results in major ontogenetic dietary changes in many species (e.g. Reñones et al., 2002; Olson et al., 2019; Moranta et al., 2020; Olson et al., 2020). As body size and gape size of carnivorous fish are expected to increase in MPAs, their diets are expected to change accordingly, which can result in increased vulnerabil- ity of large prey species previously unexploited by predators in areas open to fishing (Hamilton et al., 2014; Olson et al., 2020). If so, a more diverse size structure at marine reserves will result in broader trophic niches for individual carnivore species (Hamilton et al., 2014). Furthermore, prey selectivity by carnivores is highly dependent on prey availability and car- nivore satiation (Schoener, 1971; Pulliam, 1974; Werner and Hall, 1974; Stephens and Krebs, 1986; Gill, 2003) and hence, the diets of carnivores inhabiting marine reserves may differ largely from those observed on conspecifics of the same size in- habiting fishery-driven ecosystems (e.g. Dell et al., 2015; Car- dona et al., 2020; Moranta et al., 2020; Olson et al., 2020). All these processes may result in a broader diversity of trophic resources used by the whole community in MPAs (Olson et al., 2019) and changes in the topology of the food web (e.g. Li- Received: August 9, 2022. Revised: November 21, 2022. Accepted: November 28, 2022 C The Author(s) 2022. Published by Oxford University Press on behalf of International Council for the Exploration of the Sea. This is an Open Access article distributed under the terms of the Creative Commons Attribution License (https://creativecommons.org/licenses/by/4.0/), which permits unrestricted reuse, distribution, and reproduction in any medium, provided the original work is properly cited. Downloaded from https://academic.oup.com/icesjms/advance-article/doi/10.1093/icesjms/fsac229/6962286 by guest on 12 February 2023
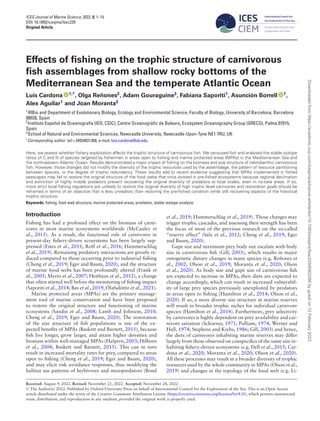
  • 2. 2 L. Cardona et al. Figure 1. Map of the study sites in the Mediterranean Sea and the north-eastern Atlantic (central panel). Balearic Islands (right panels): two areas open to fishing off western Mallorca (OFA; CE: Cala en Basset, DR: Dragonera) and two MPAs at Cabrera National Park (MPA; CR: Coll Roig, ES: Estels). Galicia (left panel): two areas open to fishing (OFA; PC: Punta Corbeira, IE: Illas Estelas) and two MPAs at Atlantic Islands National Park (MPA; FM: Furna de Monteagudo, CB: Cabo dos Bicos). bralato et al., 2010; Fry and Davis, 2015). Nevertheless, some authors claim that MPAs implemented in fished seascapes can- not fully restore the diversity of trophic interactions from the pre-fished ecosystems because only a fraction of the predator diversity is restored (D’Agata et al., 2016; Roff et al., 2016; McClanahan et al., 2019). The stable isotope ratios in animal tissues integrate over variable time spans those in the diet of the consumer (New- some et al., 2007; Boeklen et al., 2011; Marshall et al., 2019), and hence, stable isotope analysis offers a convenient ap- proach to characterizing the trophic niche of species. The sta- ble isotope ratio of nitrogen (δ15 N) is a good proxy for the trophic position of the consumer, while the stable isotope ratio of carbon (δ13 C) informs about the primary sources of C sup- porting it (Newsome et al., 2007; Boeklen et al., 2011; Mar- shall et al., 2019). When represented in the δ13 C–δ15 N space, or isospace, the bivariated stable isotope ratio of each indi- vidual species defines an area analogous to the trophic niche, the so-called isotopic niche. Methods have been developed to calculate the area of the isotopic niche and the overlap be- tween species (Jackson et al., 2011; Syväranta et al., 2013), to describe the diversity of resources used by the whole com- munity and the degree of trophic redundancy among species (Layman et al., 2007), and to compare the topology of dif- ferent communities within the isospace after accounting for differences in isotopic baselines (Fry and Davis, 2015). Here, we conducted underwater visual census to assess the changes caused by fishing on the biomass and structure of car- nivorous fish inhabiting shallow temperate rocky bottoms in the Mediterranean Sea and the adjoining Atlantic Ocean and used the stable isotope ratios of C and N to investigate if re- source use partitioning between carnivorous fish is sensitive to those changes. Material and methods Site description and experimental design Sampling was conducted in the Balearic Islands (western Mediterranean Sea), under permit SEN 265/16, issued by the Govern de les Illes Balears, and in Galicia (north-eastern At- lantic Ocean), under permit no. 310/RS 608071, issued by the Xunta de Galicia. Both permits allowed the capture and sacri- fice of fish. In the Balearic Islands, the sampling was restricted to rocky substrates between 5 and 15 m depth in two MPAs lo- cated within the Cabrera National Park and at two sites open to commercial and recreational fishing (thereafter OFA, Open Fishing Area) located off western Mallorca (Figure 1). The Cabrera National Park is a protected area where recreational fishing (both angling and spearfishing) has been prohibited since 1991 and where commercial fishing is completely for- bidden in a number of no-take reserves, including the two sites surveyed here in areas shallower than 20 m. Commercial fish- ing in areas deeper than 20 m is regulated by effort and gear. By contrast, both commercial and recreational fishing are al- lowed in the two study sites located off western Mallorca. Pre- vious research had reported major differences in the structure of the rocky-reef fish assemblages from Cabrera National Park and the sites off western Mallorca, and the latter were classi- fied as fully exploited or overexploited (Coll et al., 2013 and 2020). In Galicia, the sampling was restricted to subtidal rocky substrates between 3 and 6 m depth at high tide. The sam- pling was carried out at two MPA off Cíes Islands, a small archipelago included in the National Park of the Atlantic Is- lands of Galicia and at two OFA sites open to commercial and recreational fishing located at the mouth of the adjoin- ing Ria de Vigo (Figure 1). Recreational fishing, both angling Downloaded from https://academic.oup.com/icesjms/advance-article/doi/10.1093/icesjms/fsac229/6962286 by guest on 12 February 2023
  • 3. Food web structure in marine protected areas 3 Table 1. Fish censused and sampled at the eight study sites in the Balearic Islands and Galicia. Species NUVC TLUVC NSIA TLSIA TG Balearic Islands Coris julis 299 5–17.5 32 6.9–12.5 CM Dentex dentex 1 17.5 - - RAP Diplodus annularis 46 7.5–17.5 - - CM Diplodus puntazzo 8 27.5–37.5 - - CM Diplodus sargus 73 12.5–37.5 21 15.7–33.2 CM Diplodus vulgaris 183 7.5–27.5 21 15.6–25.3 CM Epinephelus marginatus (juveniles) 19 12.5–42.5 24 16.8–46.1 RAP Epinephelus marginatus (adults) 1 47.5 9 57.2–85.6 RAP Labrus merula 6 22.5–42.5 - - CM Labrus viridis 2 37.5–42.5 - - RAP Mullus surmuletus 5 7.5–32.5 - - CM Sciaena umbra 4 37.5–42.5 - - CM Seriola spp. 2 42.5 - - RAP Serranus cabrilla 4 12.5–22.5 27 11.7–18.2 CM Serranus scriba 84 7.5–22.5 32 12.4–17.6 CM Shpyraena spp. 49 42.5–47.5 - - RAP Spondyliosoma cantharus 51 12.5–27.5 21 10.9–21.5 CM Symphodus mediterraneus 14 7.5–12.5 - - CM Symphodus melanocercus 1 7.5 - - CM Symphodus ocellatus 28 5–12.5 - - CM Symphodus roissalli 3 7.5–12.5 - - CM Symphodus rostratus 3 7.5–12.5 - - CM Symphodus tinca 90 5–27.5 21 11–24.2 CM Thalassoma pavo 90 5–17.5 - - CM Galicia - - Centrolabrus exoletus 3 12.5 23 3.8–10.4 CM Coris julis 1 22.5 - - CM Dicentrarchus labrax 0 - 20 32.7–42.2 RAP Diplodus sargus 19 12.5–37.5 22 19.7–36.3 CM Diplodus vulgaris 253 5.0–27.5 22 11.9–28.1 CM Gobisculus flavescens - - 23 5.5–6.0 CM Labrus bergylta (plain morph) 157 7.5–52.5 32 15.8–37.0 CM Labrus bergylta (spotted morph) 23 7.5–52.5 32 16.4–41.7 CM Symphodus melops 299 5–27.5 32 10.8–20.6 CM Species, number of individuals recorded during a visual census (NUVC) and their length range (TLUVC), number of individuals sampled for stable isotope analysis (NSIA) and their length range (TLSIA), and the trophic guild (TG). CM: mesophagous carnivores. RAP: roving/ambush predatory). UVC: underwater visual census; SIA: stable isotope analysis. Table 2. Environmental characteristics (± standard error) at the four study sites in the Balearic Islands (Marine Protected Areas—MPA—in Cabrera, CR: Coll Roig and ES: Estels; Open Fishing Areas—OFA—in Mallorca, CE: Cala en Basset and DR: Dragonera) and Galicia (Marine Protected Areas—MPA—in Cíes Islands, FM: Furna de Monteagudo and CB: Cabo dos Bicos; Open Fishing Areas—OFA—in Ria de Vigo, PC: Punta Corbeira and IE: Illas Estelas). MPA OFA Balearic Islands CR ES CE DR Depth (m) 13.5 ± 0.9 14.4 ± 1.2 9.8 ± 0.8 11.3 ± 0.5 Roughness 2.4 ± 0.3 2.6 ± 0.2 2.2 ± 0.4 3.0 ± 0.2 Boulder (%) 58.6 ± 13.9 77.3 ± 8.1 55.5 ± 13.2 80.3 ± 13.0 Wave Exposure Low High Low High Galicia FM CB PC IE Depth (m) 4.4 ± 1.4 4.4 ± 0.2 4.5 ± 0.8 3.6 ± 0.9 Roughness 2.1 ± 0.8 3.1 ± 0.3 1.8 ± 0.3 1.9 ± 0.3 Boulder (%) 43.5 ± 12.9 92.5 ± 15.0 56.3 ± 9.7 63.0 ± 12.7 Wave Exposure Low High Low High and spearfishing, has been forbidden in areas shallower than 10 m in the two MPA sites at the Cíes Islands since 2002, but small-scale artisanal fishing is allowed (Ouréns et al., 2015). Underwater visual censuses At each site, fish underwater visual censuses were carried out along 50 × 5 m transects (Table 1). Along all transects, the fish were counted, and their total length was estimated and Downloaded from https://academic.oup.com/icesjms/advance-article/doi/10.1093/icesjms/fsac229/6962286 by guest on 12 February 2023
  • 4. 4 L. Cardona et al. Table 3. Summary statistics of ANOVA to assess the variability of environmental characteristics (depth, roughness, and percentage of boulders) at the four study sites in the Balearic Islands and Galicia. Depth Roughness Boulder (%) df MS F p MS F p MS F p Balearic Islands Protection 1 45.7 14.5 0.065 0.02 0.02 0.903 0.02 0.12 0.763 Site (protection) 2 3.3 0.4 0.364 0.83 2.45 0.129 0.09 1.60 0.242 Residuals 12 3.0 0.34 0.09 Galicia Protection 1 0.56 0.73 0.482 2.64 2.60 0.248 0.15 0.29 0.642 Site (protection) 2 0.77 0.90 0.432 1.01 5.27 0.002 0.51 15.97 0.001 Residuals 12 0.85 0.19 0.03 Site is a random effect nested within protection. The boulders coverage was transformed as arcsine (x). Numbers in bold denote statistically significant effects. assigned to the nearest 5 cm category. Extensive training using artificial fish (Bell et al., 1985) was carried out prior to field work, achieving accuracy in size estimates of 4 cm for 20– 40 cm fish and 10 cm for larger fish. Following the surveys, fish lengths were transformed to biomass using the length– weight relationships reported by Coull et al. (1989), Morales- Nin and Moranta (1997), Morey et al. (2003), and Reñones et al. (2007). Since the aim of the study was to compare the density of carnivorous fish between and within localities, the surveys included Carangidae, Dasyatidae, Labridae, Mull- idae, Scienidae, Serranidae, Sparidae, and Sphyraenidae in the Balearic Islands (Table 1), while Labridae, Moronidae, and Sparidae were included in Galicia. The surveys were carried out between 24 June and 8 July 2016 in the Balearic Islands and 27 June and 2 July 2017 in Galicia. To calculate the average depth of the transect, depth was recorded at 0, 10, 20, 30, 40, and 50 m along the transect once fish were counted. A roughness index (Ordines et al., 2005) and the coverage of different substrate types (homogeneous rock, gravel, boulders, and sand) were estimated visually along the transect to characterize the habitat. Sampling collection Following visual censuses, selected nektobenthic carnivorous fish species were captured at each site using hook and line, spears, hand nets, and baited traps. The species selected were numerically abundant or made a major contribution to total biomass (Table 1), and their home ranges are small enough to guarantee they remain within the limits of the MPAs stud- ied (Pastor et al., 2009; Palmer et al., 2011; Villegas-Rios et al., 2013b; Belo et al., 2016), except for Dicentrarchus labrax (Pita and Freire, 2011). It should be noted that Labrus bergylta has two morphs that differ in many biological traits (Villegas Ríos et al., 2013a) and hence were analysed independently. All the specimens, except adult Epinephelus marginatus, were sacrificed and taken to the laboratory, were total length (TL hereafter) was recorded (Table 1) and dorsolateral white mus- cle was sampled and stored frozen (−20◦ C) for subsequent analysis. Adult E. marginatus (TL 45 cm) were not sacri- ficed because of their old age and regional scarcity (Reñones et al., 2007). They were captured alive in baited traps, mea- sured (total length) on board, and a sample of dorsal mus- cle was collected with a 6 mm biopsy punch (Ackerson et al., 2014) prior to being released. No adults of E. marginatus were observed or captured at any of the OFA sites in the Balearic Islands. Samples of the four most abundant species of macro- phytes (Balearic Islands: Carpodesmia barchycarpa, Dicty- ota dichotoma, Halopteris scoparia, and Posidonia ocean- ica; Galicia: Codium tomentosum, Dictyota dichotoma, Sac- chorhiza polyschides, and Ulva lactuca) were collected at each site after fish sampling to assess differences in the isotope base- line within each region. Stable isotope analysis Samples were thawed at room temperature and dried in a lab- oratory oven at 55◦ C for 24 h. Once dry, samples were ground to a fine powder with a mortar and pestle, dried again for 24 h at 55◦ C, and rinsed with a 2:1 chloroform: methanol solution to remove lipids. The chloroform: methanol solu- tion was changed until it was transparent. Samples were dried again for 24 h at 55◦ C. Once processed, 0.3 mg of the sam- ple were weighed into 3.3 × 5 mm tin cups. All the tin cups were combusted at 900◦ C and analysed in a continuous flow isotope ratio mass spectrometer (Flash 1112 IRMS Delta C Series EA, Thermo Finnigan; www.thermofisher.com) at the Centres Científics i Tecnològics de la Universitat de Barcelona (www.ccit.ub.edu) in Barcelona, Spain. The abundance of stable isotopes is expressed using the δ notation, where the relative variations of stable isotope ratios are expressed as per mil (‰) deviations from prede- fined reference scales [atmospheric nitrogen for δ15 N and Vi- enna Pee Dee Belemnite (V-PDB) calcium carbonate for δ13 C]. However, due to limited supplies, isotopic reference materials, which included known isotopic compositions relative to inter- national measurement standards, were analysed instead. For nitrogen, isotopic reference materials of known 15 N/14 N ra- tios were used to a precision of 0.2 ‰, and these were namely: (NH4)2SO4 (IAEA N1, δ15 N = +0.4 ‰, and IAEA N2, δ15 N = +20.3 ‰), L-glutamic acid (IAEA USGS40, δ15 N = −4.6 ‰), and KNO3 (IAEA NO3, δ15 N = +4.7 ‰). For carbon, iso- topic reference materials of known 13 C/13 C ratios were used to a precision of 0.3 ‰, and these were namely: polyethylene (IAEA CH7, δ13 C = −31.8‰), sucrose (IAEA CH6, δ13 C = −10.4‰), L-glutamic acid (USGS 40, δ13 C = −26.2‰), and caffeine (IAEA 600, δ13 C = −27.7‰). These isotopic reference materials were used to recalibrate the system once every 12 samples and were analysed in or- der to compensate for any measurement drift over time. The raw data were recalculated, taking into account a linear re- gression previously calculated for isotopic reference materials (Skrzypek, 2013). Downloaded from https://academic.oup.com/icesjms/advance-article/doi/10.1093/icesjms/fsac229/6962286 by guest on 12 February 2023
  • 5. Food web structure in marine protected areas 5 Figure 2. Descriptors of the fish communities inhabiting the shallow rocky bottom sites in the areas open to fishing (OPA; grey) and MPAs (green) were studied in the Balearic Islands (top panels) and Galicia (bottom panels). The horizontal bar inside the box is the mean; the limits of the box are the upper and lower quartiles; and dots denote outliers. Table 4. Summary statistics of the ANOVA to assess the effect of protection from fishing management (OFA versus MPA) in the two study areas for the fish community descriptors. Species richness Abundance Biomass df MS F p MS F p MS F p Balearic Islands Protection 1 42.25 33.8 0.003 3164 6.88 0.120 1.32 41.44 0.023 Site (protection) 2 1.25 0.43 0.660 460 1.71 0.223 0.03 1.29 0.309 Residuals 12 2.92 270 0.02 Galicia Protection 1 1.56 0.68 0.497 2256 0.72 0.486 0.52 30.50 0.031 Site (protection) 2 2.31 1.08 0.374 3136 0.95 0.414 0.01 0.32 0.733 Residuals 12 2.15 3303 0.32 Site is a random effect nested within protection. Biomass was transformed as log (x). Numbers in bold denote statistically significant effects. Downloaded from https://academic.oup.com/icesjms/advance-article/doi/10.1093/icesjms/fsac229/6962286 by guest on 12 February 2023
  • 6. 6 L. Cardona et al. Figure 3. Size structure of the fish communities inhabiting the shallow rocky bottom sites in the areas open to fishing (OFA; grey) and MPA (green) was studied in the Balearic Islands (top panels) and Galicia (bottom panels). Table 5. Summary statistics of an ANOVA run to assess differences in the δ15 N and δ13 C values of primary producers between MPA and OFA in the Balearic Islands and Galicia. δ15 N δ13 C df MS F p df MS F p Balearic Islands Site 3 2.3 9.9 0.001 3 14.1 12.8 0.001 Species 3 9.7 42.2 0.001 3 293.5 265.2 0.001 Interaction 9 0.8 3.6 0.001 9 2.2 2.0 0.050 Residuals 64 0.2 64 1.11 Galicia Site 3 10.8 32.4 0.001 3 1.5 0.5 0.7 Species 3 1.1 3.3 0.030 3 132.1 44.1 0.001 Interaction 9 0.6 1.8 0.080 9 5.2 1.7 0.100 Residuals 64 0.3 64 3.0 Bold types denote statistically significant effects. Data analysis The habitat characteristics (depth, roughness, and boulder coverage) of the four sampling sites within each region were compared by means of an ANOVA. Management was a fixed factor, and site was a random effect nested within manage- ment. All data were checked for normality and homogeneity of variance and transformed to log (x) when these assump- tions were not met. The boulder coverage data were presented Downloaded from https://academic.oup.com/icesjms/advance-article/doi/10.1093/icesjms/fsac229/6962286 by guest on 12 February 2023
  • 7. Food web structure in marine protected areas 7 Figure 4. Graphical representation of the General Lineal Model (GLM) and GAM (only for C. julis) analyses for the isotopic composition of fish species in the Balearic Islands. When significant differences are detected between protection levels without significant size related trends, a box plot is represented (the boundary of the box indicates the 25th and 75th percentiles, thin and thick lines within the box mark the median and mean, respectively, and whiskers (error bars) above and below the box indicate the 90th and 10th percentiles). When no significant differences in the protection level were detected but the size related changes were significant, the line of the regression is included in the graph. When no significant differences were obtained for any of the terms included in the model, only the isotopic values were represented (grey and green circles). OFA: areas open to fishing. MPA: marine protected areas. as percentages, which require arcsine transformation to pro- duce normally distributed data with homogeneous variances (Zar, 1996). Fish community descriptors (species richness, abundance, and biomass) were calculated for nektobenthic carnivorous fish at each site. The same ANOVA model described above was used to test if fish assemblages from MPA and OFA sites in the same regions differed in species richness, abundance, and biomass. Descriptors’ data were log-transformed (log x) when necessary to meet the assumptions of the analysis. ANOVA was also used to test if the δ13 C and δ15 N macrophyte values varied between sites in the same region. The existence of statistically significant differences in the stable isotope ratio values of macrophytes from the sites in the same region (see results) revealed shifts in the isotopic base- line that prevented the direct comparison of the stable isotope ratios of fish. Following Fry and Davis (2015), we rescaled fish δ13 C and δ15 N values into a Z-score, which is a measure of how many standard deviations below or above the popula- tion mean a raw score is. Furthermore, the Fry–Davis method gives rescaled individual distances to the community mean in ‰ units and not in standard deviation units. This approach al- lows comparing the isotopic spaces of the study sites in each region without the influence of the isotopic baseline, using the rescaled individual distances (13 C and 15 N, hereafter). General Linear Models (GLM) or General Additive Models (GAM) with a gaussian distribution and identity link function were used to assess the variability of 13 C and 15 N values in the fish population. Because no differences were detected between sites in the fish community descriptors (see results), the model included only management (a categorical variable), fish total length (a continuous variable), and the interaction between both. When the interaction term was not significant, it was excluded from the model, and the models were run in- cluding only the two main explanatory variables. Model fit was evaluated by inspecting the residuals graphs for poten- tial violations of the model assumptions, particularly normal- ity, homogeneity, and independence (Zar, 1996). The percent- age of variability explained by the lineal models R2 = 100 × (null deviance—residual deviance/null deviance) was calcu- lated. GLM and GAM were performed with the programme R using the mgcv package (http://www.r-project.org/). Rescaled individual distances were also used to compare the trophic structure of the assemblage using SIBER (Stable Isotope Bayesian Ellipses in R; Jackson et al., 2011). This is a Bayesian version of Layman metrics (Layman et al., 2007), Downloaded from https://academic.oup.com/icesjms/advance-article/doi/10.1093/icesjms/fsac229/6962286 by guest on 12 February 2023
  • 8. 8 L. Cardona et al. Table 6. Summary statistics of the GLM and GAM (only for C. julis in the Balearic Islands) to test the effect of protection from fishing and the total length of the rescaled stable isotope ratios of the fish species considered. Intercept Protection Fish length Balearic Islands p Coefficient (SE) p Coefficient (SE) p Var/Dev explained (%) C. julis 13 C 0.11 − 0.38 (0.19) 0.17 s (1.84 edf) 0.01 27.8 15 N 0.001 0.06 (0.10) 0.56 s (2.40 edf) 0.001 76.3 S. tinca 13 C 0.88 − 0.12 (0.48) 0.81 − 0.02 (0.06) 0.70 1.1 15 N 0.04 − 0.77 (0.39) 0.07 0.05 (0.05) 0.31 22.5 D. sargus 13 C 0.12 − 0.73 (0.42) 0.10 0.06 (0.04) 0.20 16.7 15 N 0.23 − 1.20 (0.48) 0.02 0.01 (0.05) 0.83 27.4 D. vulgaris 13 C 0.02 0.10 (0.39) 0.79 − 0.13 (0.06) 0.05 20.3 15 N 0.01 − 0.09 (0.26) 0.72 − 0.09 (0.04) 0.05 20.7 S. cantharus 13 C 0.95 0.03 (0.50) 0.94 0.02 (0.09) 0.85 0.2 15 N 0.47 − 0.32 (0.69) 0.65 − 0.05 (0.13) 0.68 1.7 E. marginatus 13 C 0.58 − 0.45 (0.38) 0.38 0.03 (0.01) 0.04 24.6 15 N 0.21 − 0.67 (0.30) 0.03 0.06 (0.01) 0.001 70.35 S. cabrilla 13 C 0.44 0.29 (0.39) 0.39 − 0.17 (0.10) 0.10 10.7 15 N 0.001 0.09 (0.18) 0.63 0.23 (0.06) 0.001 50.1 S. scriba 13 C 0.21 − 0.18 (0.17) 0.28 0.10 (0.05) 0.06 14.3 15 N 0.001 0.06 (0.16) 0.70 0.18 (0.05) 0.001 30.6 Galicia C. exoletus 13 C 0.001 − 0.70 (0.31) 0.04 0.31 (0.06) 0.001 60.3 15 N 0.001 0.57 (0.18) 0.004 0.23 (0.03) 0.001 74.1 L. bergylta (plain) 13 C 0.006 0.43 (0.24) 0.08 0.04 (0.02) 0.04 22.9 15 N 0.18 0.89 (0.22) 0.001 − 0.01 (0.02) 0.81 35.2 L. bergylta (spotted) 13 C 0.25 0.12 (0.20) 0.57 0.02 (0.01) 0.12 9.8 15 N 0.18 − 0.10 (0.29) 0.72 0.005 (0.02) 0.79 0.6 S. melops 13 C 0.59 − 5.80 (1.60) 0.001 0.004 (0.08) 0.86 47.1 15 N 0.03 0.08 (0.31) 0.79 0.04 (0.04) 0.45 3.1 D. sargus 13 C 0.68 0.76 (0.65) 0.26 0.06 (0.07) 0.40 22.5 15 N 0.05 − 0.45(0.52) 0.40 − 0.06 (0.06) 0.32 20.1 D. vulgaris 13 C 0.08 0.72 (0.44) 0.12 0.08 (0.05) 0.10 39.9 15 N 0.31 − 0.51 (0.20) 0.02 0.02 (0.02) 0.31 25.2 G. flavescens 13 C 0.001 − 0.32 (0.13) 0.02 23.5 15 N 0.001 − 0.39 (0.13) 0.006 30.8 D. labrax 13 C 0.03 − 1.69 (0.07) 0.002 − 0.14 (0.09) 0.17 44.2 15 N 0.001 − 0.10 (0.32) 0.76 − 0.20 (0.06) 0.008 50.5 Bold type denotes statistically significant effects. SE: standard error; Var: variance (GLM models); Dev: deviance (GAM models); p: significant differences in bold. The protection × fish length interaction term was statistically significant only for S. melops (coefficient = 0.33; standard error = 0.11; p = 0.005). which informs of the diversity of resources used by the assem- blage and resource use partitioning by the assemblage. The N range (NR) provides information on the trophic length of the community; the C range (CR) is the width of the food web and gives us an idea of the diversity of C sources fueling the food web; the total area of the convex hull (TA); and the mean distance to the centroid (CD) provide measures of the average degree of trophic diversity within a food web, the mean dis- tance to the nearest neighbour (MNND) provides a measure of the overall density of species packing, and the standard de- viation of the nearest distance (SDNND) gives a measure of the evenness of spatial redundancy. SIBER calculates the 95, 75, and 50% credible intervals for the metrics of each pop- ulation. The codes for running SIBER analyses can be found at https://cran.r-project.org/web/packages/SIBER/vignettes/In troduction-to-SIBER.html. Similar numbers of individuals of each species were collected at each OFA and MPA area, to get a balanced design. Adult E. marginatus are the only exception, as they were missing from OFA sites. The total sample size per species is reported at Table 1. Because no differences were detected between sites in the fish community descriptors (see results), we pooled the fish samples from two OFA and two MPA sites from each region to calculate the Layman metrics. Later, we calculated the 95% CI on the difference between the means of OFA and MPA sites from the same region and concluded that statistically signifi- cant differences did not exist if the 95% CI of the difference included zero (Bolstrad and Curran, 2016). Results Habitat characteristics and fish assemblages The seascape of the four study sites in the Balearic Islands was characterized by the existence of patches of the seagrass P. oceanica scattered between brown macroalgae-covered boul- ders, and no differences were observed in the mean values of habitat characteristics between the four study sites (Tables 2 and 3). Similarly, macroalgae-covered boulders were also the prevalent habitat at the four Galicia sites (Table 2), but there were site-scale differences in roughness and boulder cover (Table 3), because Cabo dos Bicos, an MPA site, has signifi- cantly higher values of both habitat descriptors. The species richness and biomass of nektobenthic carnivorous fish were higher at MPA than at OFA areas in the Balearic Islands, with- out significant differences in abundance or any significant ef- fect of site (Figure 2 and Table 4). In Galicia, biomass was the only descriptor of the fish com- munity that differed between both levels of protection, with Downloaded from https://academic.oup.com/icesjms/advance-article/doi/10.1093/icesjms/fsac229/6962286 by guest on 12 February 2023
  • 9. Food web structure in marine protected areas 9 Figure 5. Graphical representation of the GLM analysis for the isotopic composition of fish species in Galicia. When significant differences are detected between protection levels without significant size related trends, a box plot is represented (the boundary of the box indicates the 25th and 75th percentiles, thin and thick lines within the box mark the median and mean, respectively, and whiskers (error bars) above and below the box indicate the 90th and 10th percentiles). When no significant differences in the protection level were detected but the size related changes were significant, the line of the regression is included in the graph. When no significant differences were obtained for any of the terms included in the model, only the isotopic values were represented (grey and green circles). OFA: areas open to fishing. MPA: marine protected areas. highly significant values of biomass at the MPA than at OFA and without any significant effect of site (Figure 2 and Table 4). Individuals ranging between 7.5 and 17.5 cm prevailed nu- merically in both MPA and OFA sites in the Balearic Islands (Figure 3). However, individuals from the intermediate size classes (17.5 cm) made the largest contribution to biomass in OFA, whereas individuals 27.5 cm made the largest contri- bution to biomass in MPA (Figure 3). The size structure of the fish community in the OFA and MPA sites of Galicia was more similar, although individuals in the larger size classes (42.5 and 52.5 cm) were scarcer at some of the OFA sites. Stable isotope ratios and the topology of the fish assemblage in the isospace Macrophytes from different sites in the same region differed in their stable isotope ratios (Supplementary Figure SM1 and Table 5), thus revealing differences in the isotope base- line and the need for rescaling the stable isotope ratios of fish before comparing them across protection levels (see materials and methods). Half the species in the Balearic Islands and most of the species in Galicia shifted their positions in the 13 C–15 N isospace from site to site (Supplementary Figures SM2 and SM3). However, data analysis (GLM or GAM) revealed no effect of the protection from fishing on the 13 C values of any fish species from the Balearic Islands, a statistically sig- nificant effect of the protection on the 15 N values of only two species from the Balearic Islands (Figure 4 and Table 6), and a significant effect of the protection from fishing on the stable isotope ratios of most fish species from Galicia (Figure 5 and Table 6). The same analysis revealed a diversity of rela- tionships between the stable isotope ratios and fish body size in both regions. In the Balearic Islands, Diplodus sargus and Epinephelus marginatus were the only two species whose 15 N values were affected by protection from fishing, as both were sig- nificantly higher in the OFA than in the MPA sites (Figure 4 and Table 6). Fishing had no effect on their 13 C values, and no relationship existed between body size and stable isotope ratios in D. sargus, although both 13 C and 15 N increased with body size in E. marginatus. The stable isotope ratios of Symphodus tinca and Spondyliosoma cantharus were not in- fluenced by protection or body size and those of the remain- ing five species changed with body size but not with protec- tion from fishing. Both the 13 C and 15 N values of C. julis Downloaded from https://academic.oup.com/icesjms/advance-article/doi/10.1093/icesjms/fsac229/6962286 by guest on 12 February 2023
  • 10. 10 L. Cardona et al. Figure 6. Layman metrics of the assemblages of nektobenthic carnivorous fish from OFA and MPA from the Balearic Islands and Galicia. CD: mean distance to the centroid, MNND: mean distance to the nearest neighbour; SDNND: standard deviation of the nearest distance. Squares denote the mean, and boxes the 50, 75, and 95% CIs. Table 7. Difference between the mean and 95% CI for each Layman metric for the assemblage of nektobenthic, carnivorous fish in areas open to fishing and MPAs in the Balearic Islands and Galicia. Balearic Islands Galicia Difference 95% CI Difference 95% CI N range − 1.6 −2.7/1.3 0.0 −1.2/2.8 C range − 0.9 −1.5/1.8 1.0 −0.1/3.6 Total area − 0.5 −2.9/5.1 − 1.3 −3.4/4.6 CD 0.0 −0.2/0.4 0.0 −0.2/0.6 MNND − 0.3 −0.5/0.6 0.0 −0.3/0.7 SDNND − 0.4 −0.6/0.5 0.3 −0.1/1.1 Differences are statistically significant if the 95% CI of the difference does not include 0. increased with size, although with a non-lineal relationship. The 13 C values of Serranus cabrilla and Serranus scriba did not show any significant relationship with body size, but their 15 N values increased significantly with body size, both in OFA and MPA. Finally, Diplodus vulgaris was the only species whose 13 C and 15 N values decreased with body size at both protection levels (Figure 4 and Table 6). In Galicia, both the 13 C and 15 N values of D. labrax, D. vulgaris, and Gobiusculus flavescens were significantly higher in the OFA than in the MPA sites; the 13 C of Centrolabrus exoletus was also higher in the OFA than in the MPA sites, but the opposite was true for 15 N (Figure 5 and Table 6). The 15 N of L. bergylta (plain) was also lower in the OFA than in the MPA sites. Furthermore, the stable isotope ratios of D. sargus and L. bergylta (spotted) were not influenced by pro- tection. Regarding the effect of body size on stable isotope ra- tios, both the 13 C and 15 N values of C. exoletus increased with body size, the 13 C of L. bergylta (plain) increased with size, the 15 N of D. labrax decreased with body size and the stale isotope ratios of D. sargus and L. bergylta (spotted) did not change with body size. Finally, Symphodus melops was the only species with a significant interaction between protec- tion level and size for the 13 C (p = 0.005), with a signifi- cant increasing trend with size only in the MPA (Figure 5 and Table 6). No statistically significant differences existed between any of the Layman metrics of OFA and MPA sites from the same region, including the total area of the convex hull (Figure 6 and Table 7). Furthermore, the overlap between the standard ellipses of OFA and MPA sites from the same region was al- ways 90% (Figure 7 and Table 8). These results indicate no differences in the diversity of trophic resources used by the assemblage, the resource partitioning between species, or the degree of trophic redundancy. Discussion The results reported here demonstrate a significant impact of fishing on the biomass of nektobenthic carnivorous fish from shallow rocky bottoms in the Balearic Islands and Galicia. Downloaded from https://academic.oup.com/icesjms/advance-article/doi/10.1093/icesjms/fsac229/6962286 by guest on 12 February 2023
  • 11. Food web structure in marine protected areas 11 Figure 7. Convex hulls (top) and standard ellipses (bottom) in the isospace of the assemblages of nektobenthic carnivorous fish from areas open to fishing (grey symbols) and MPAs (green symbols) in the Balearic Islands and Galicia. Note that the range of values on the both axes is different for the Balearic Islands and Galicia. Table 8. Overlap between the standard ellipses of the assemblages of nektobenthic, carnivorous fish in areas open to fishing and MPAs in the Balearic Islands and Galicia. Balearic Islands Galicia Area (‰2 ) Overlap (%) Area (‰2 ) Overlap (%) OFA 5.27 91.7 5.33 98.5 MPA 5.19 93.1 5.44 96.5 However, protection from fishing caused no significant change in the trophic structure of the fish assemblage in either of the two regions. The stability of the trophic structure of the fish assemblage in the Balearic Islands is particularly remarkable because E. marginatus dominates the fish biomass in MPAs, and individuals 45 cm TL have a unique trophic niche (Harmelin and Harmelin-Vivien, 1999; Reñones et al., 2002; this study), but the species is virtually absent from areas open to fishing (Coll et al., 2013, 2020; Hackradt et al. 2014; this study). Stable isotope ratios are certainly rather coarse proxies of diet, lack the taxonomic resolution of stomach contents anal- ysis, and may fail to capture diet shifts where isotopic gra- dients are weak (Newsome et al., 2007). Nevertheless, the Layman metrics have previously demonstrated their capac- ity to reveal differences in the food web structure of ecosys- tems at different geographic and temporal scales (Abrantes et al., 2014; Saporiti et al., 2014, 2015; López-Rasgado et al., 2016; Bas et al., 2019; Stuthman and Castellanos-Galindo, 2020; Cardona et al., 2021). Particularly relevant here is the absence of significant changes in the total area of the convex hull and the almost complete overlap of the standard ellipses of the whole communities, as they are universally considered to reveal changes in the diversity of trophic resources con- sumed (Hamilton et al., 2014; Marsh et al., 2017; Olson et al., 2019). Furthermore, the experimental design minimized potential confounding factors. First, fishing restrictions in the MPAs of the Balearic Islands and Galicia had been in force for 25 and 15 years, respectively, periods long enough to allow the built- up and stabilization of fish biomass (Coll et al., 2013). Second, no consistent differences existed in the habitat characteristics of the marine reserves and control sites, and hence, habitat heterogeneity is unlikely to be confounded with the effect of protection. Third, the species studied here are highly seden- tary, and their home ranges are small enough to guarantee they remain within the limits of the MPAs (Pastor et al., 2009; Alós et al., 2011; Palmer et al., 2011; Villegas-Rios et al., 2013b; Belo et al., 2016), except for D. labrax (Pita and Freire, 2011). As a consequence, the absence of differences between the trophic structure of the assemblage of nektobenthic carnivo- rous fish in MPAs and control areas is not an artefact resulting Downloaded from https://academic.oup.com/icesjms/advance-article/doi/10.1093/icesjms/fsac229/6962286 by guest on 12 February 2023
  • 12. 12 L. Cardona et al. from the constant reshuffling of individuals between adjoining areas. Fourth, not all the fish species in the community were sam- pled, but all the species making a major contribution to the abundance or biomass were collected for stable isotope anal- ysis, and the same species were sampled at every locality in the Balearic Islands and Galicia to ensure that differences in the trophic structure of the community, if any, were because of shifts in species diet and not because of changes in the species included in the analysis (Saporiti et al., 2015; Marsh et al., 2017; Olson et al., 2019). Actually, most of the species stud- ied are opportunistic carnivores consuming diverse prey (e.g. Sala and Ballesteros, 1997; Harmelin and Harmelin-Vivien, 1999; Reñones et al., 2002; Figueiredo et al., 2005; Spitz et al., 2013; Pita and Freire, 2019) and all them were targeted by commercial or recreational fishermen in the Balearic Is- lands (Morales-Nin et al., 2005; Maynou et al., 2013) and most of them in Galicia, except G. flavescens, C. exoletus, and S. melops (Ouréns et al., 2015; Pita and Freire, 2016). Thus, they were expected to shift their diets and stable iso- tope ratios in response to changes in the size structure and biomass of the assemblage (Cardona et al., 2020; Moranta et al., 2020). Such opportunistic behaviour and trophic plas- ticity are demonstrated by the broad variability observed in the 13 C and 15 N values of most species, which hindered any significant correlation between body size and stable iso- tope ratios in several species, both in the Balearic Islands and Galicia, and resulted in a significant effect of protection of the isotopic niche of two species in the Balearic Islands and several species in Galicia. Fifth, we also tried to sample individuals of the same species within a similar body size at each locality, but this was impos- sible for species strongly affected by fishing. The most extreme examples were E. marginatus in the Balearic Islands and D. sargus in Galicia, where individuals larger than 45cm TL and 26cm TL were virtually absent from the areas open to fishing in the Balearic Islands and Galicia, respectively. The size dis- tribution of several smaller species, such as S. melops in Gali- cia, was also biased towards larger individuals in MPAs. For this reason, body size was included in the models analysing the effect of protection on the stable isotope ratios of carniv- orous fish. Body size was indeed the major determinant of the 13 C or 15 N values of most species in the Balearic Islands and several species in Galicia, and hence, the shifts in the size structure of the assemblage reported here might have resulted in a diversification of the resources exploited by the assem- blage (Hamilton et al., 2014; Olson et al., 2020). However, our results do not confirm any change in the trophic structure of the assemblage. The biomass of the fish populations in the areas open to fishing in the Balearic Islands was dominated by individuals of intermediate body size. Protection from fishing dramatically altered the size structure of the population and resulted in in- verted biomass pyramids in the MPAs of the Balearic Islands. This was because of a much higher abundance of individuals 30 cm, mostly D. sargus and E. marginatus, but also indi- viduals of species virtually absent from areas open to fishing, such as Labrus viridis and Sciaena umbra, although in low numbers. Similarly, the biomass of the fish populations in ar- eas open to fishing in Galicia was dominated by individuals of intermediate body size, but the built-up of fish biomass in the MPAs resulted mostly from a larger abundance of individuals of intermediate body size. Certainly, the abundance of large D. sargus and L. bergylta increased in the MPAs of Galicia, but the number and identity of the species did not change as a result of protection from fishing, and the size structure of the fish community remained largely unchanged. Differences in the management of MPAs in the Balearic Is- lands and Galicia and in the biology of the top predators of each region explain the differences in the process leading to the built-up of fish biomass in marine protected areas in both regions. We studied true no-take areas in the Balearic Islands (Coll et al., 2020), whereas a small-scale artisanal fishery was allowed to operate in the MPAs of Galicia (Ouréns et al., 2015). Partial protection from fishing did not prevent a sig- nificant increase in the biomass of carnivorous fish there, but this was mostly due to a higher abundance of a mesopredador, L. bergylta (Pita and Freire, 2019; Cardona et al., 2020). On the contrary, the biomass of D. labrax, the top predator of the ecosystem (Pita and Freire, 2019; this study), remained low, contrary to the situation in no-take areas in Portugal (Gil Fernández et al., 2016). This highlights the impact of the small-scale artisanal fishery operating in the MPAs of Galicia (Ouréns et al., 2015), but differences in the behaviour of E. marginatus and D. labrax are also relevant to explain the dif- ferences between the Balearic Islands and Galicia. E. margina- tus is a sedentary species with a small home range (Pastor et al., 2009), and hence, population density is largely dependent on local fishing, which allows E. marginatus to reach high den- sities within small MPAs in the Mediterranean Sea (Sala et al., 2012; Coll et al., 2013; Hackradt et al., 2014, 2020; this study). It should be noted, however, that E. marginatus moves to deeper rocks as they grow older (Alvarez-Berastegui et al., 2018), which might limit biomass built-up in the shallow no- take areas studied. Conversely, D. labrax is a highly mobile species (Pita and Freire, 2011), and high fishing mortality be- yond the limits of MPAs likely limits the built-up of D. labrax biomass even in no-take areas. Thus, the overall evidence suggests that the absence of an impact of fishing on the trophic structure of nektobenthic fish assemblages, both in the Mediterranean Sea and the temper- ate north-east Atlantic Ocean, is probably real and not an arte- fact of the methods used here. Individual species may certainly change their isotopic niches in response to fishing (e.g. Car- dona et al., 2020; Moranta et al., 2020), but no real niche diversification happens, and the Layman metrics remain un- changed. This means that the shifts in size structure and the biomass built-up of carnivorous fish currently observed at MPAs in the Mediterranean Sea and the adjoining temperate north-east Atlantic Ocean are high enough to trigger diet shifts in individual species but not to modify the trophic structure of the assemblage. Perhaps the species studied here have partic- ularly narrow fundamental niches compared to other species that can forage at two different trophic levels and alos shift easily from benthic to pelagic prey (e.g Eloranta et al., 2015), but the incomplete recovery of the carnivore assemblage at the studied MPAs is another likely reason for the weak response reported here. Larger predators have a disproportionate impact on food web structure due to their higher consumption rates and their preference for larger consumers (DeLong et al., 2015). Fish- ing has highly reduced the biomass of carnivorous fish at a re- gional level both in the Mediterranean Sea and the north-east temperate Atlantic Ocean (Christensen et al., 2003; Piroddi et al., 2015), and several high trophic level carnivores, such as seals and coastal sharks, are very scarce or regionally ex- Downloaded from https://academic.oup.com/icesjms/advance-article/doi/10.1093/icesjms/fsac229/6962286 by guest on 12 February 2023
  • 13. Food web structure in marine protected areas 13 tinct in the western Mediterranean Sea (Sala, 2004; Coll et al., 2012; Moro et al., 2019; Nuez et al., 2021). Thus, total fish- ing prohibition and protection of the adjoining rocky habitats would certainly increase the biomass of carnivorous fish at the MPAs studied here, but it is unlikely that this would restore the original diversity of highly mobile, high trophic level car- nivores at a local scale if they are scarce at a regional scale (D’Agata et al., 2016; Roff et al., 2016; McClanahan et al., 2019). In conclusion, properly enforced MPAs in the Mediter- ranean Sea and the temperate north-east Atlantic Ocean may allow for rebuilding the populations of nektobenthic carnivo- rous fish and restoring their size structure, but they are un- likely to restore the trophic structure to that of pre-fished ecosystems. This would be possible only if the original diver- sity of carnivores was restored regionally, which is probably unrealistic there and in many other regions, given the extent of fishing and climate change impacts on the global ocean (Che- ung et al., 2012; D’Agata et al., 2016; Roff et al., 2016; Mc- Clanahan et al., 2019). Accordingly, restoration goals in re- gions where highly mobile predators have been decimated or are regionally extinct should be reframed in terms of an objec- tive that is less unrealistic than the pre-fishing condition while still recovering aspects of the historical trophic structure. The situation might be different in areas where much of the orig- inal diversity of highly mobile, high trophic level carnivores still remains and populations are actually increasing as a re- sult of legal protection, such as the north-east Pacific Ocean (Carretta et al., 2020). Acknowledgments We appreciate the help provided by the staff of Parque Na- cional Marítimo-Terrestre de las Islas Atlánticas de Galicia and Parque Nacional Marítimo-Terreste del Archipiélago de Cabrera. Conxita Avila, Diego Rita, and Oriol Sacristán as- sisted in field work. Supplementary data Supplementary material is available at the ICESJMS online version of the manuscript. Conflict of interest statement Authors disclose no conflict of interest. Author contributions statement LC, OR, AB, AA, and JM conceived the ideas and designed the methodology; LC, OR, JM, AG, and FS collected the data; LC, FS, and AB conducted the laboratory analysis; LC, OR, and JM analysed the data; and LC, OR, and JM led the writing of the manuscript. All authors contributed critically to the drafts and gave final approval for publication. Funding This work was supported by the Organismo Autónomo de Parques Nacionales, through grant number 1588/2015. Data availability statement The data underlying this article are available in the Dryad Dig- ital Repository (doi: 10.5061/dryad.k98sf7m9j). References Abrantes, K. G., Barnet, A., and Bouillon, S. 2014. Stable isotope-based community metrics as a tool to identify patterns in food web struc- ture in east African estuaries. Functional Ecology, 28: 270–282. Ackerson, R. J., McKee, M. J., Schmitt, C. J., and Brumbaugh, W. G. 2014. Implementation of a non-lethal biopsy punch monitoring pro- gram for mercury in smallmouth bass, Micropterus dolomieu La- cepède, from the eleven point river, Missouri. Bulletin of Environ- mental Contamination and Toxicology, 92: 125–131. Alós, J., March, D., Palmer, M., Grau, A., and Morales-Nin, B. 2011. Spatial and temporal patterns in Serranus cabrilla habitat use in the NW Mediterranean revealed by acoustic telemetry. Marine Ecology Progress Series, 427: 173–186. Alvarez-Berastegui, D., Coll, J., Rueda, L., Stobart, B., Morey, G., Navarro, O., Aparicio-González, A. et al. 2018. Multiscale seascape habitat of necto-benthic littoral species, application to the study of the dusky grouper habitat shift throughout ontogeny. Marine Envi- ronmental Research, 142: 21–31. Bas, M., Briz, I., Godino, I., Álvarez, M., Vales, D. G., Crespo, E. A., and Cardona, L. 2019. Back to the future? Late Holocene marine food web structure in a warm climatic phase as a predictor of trophody- namics in a warmer south western Atlantic Ocean. Global Change Biology, 25: 404–419. Baskett, M. L., and Barnett, L.A.K. 2015. The ecological and evolu- tionary consequences of marine reserves. Annual Review of Ecology, Evolution, and Systematics, 46: 49–73. Bell, J. D., Craik, G. J. S., Pollard, D. A., and Russell, B. C. 1985. Esti- mating length frequency distributions of large reef fish underwater. Coral Reefs, 4: 41–44. Belo, A. F., Pereira, T. J., Quintella, B. R., Castro, N., Costa, J. L., and de Almeida, P. R. 2016. Movements of Diplodus sargus (Sparidae) within a Portuguese coastal marine protected area: are they really protected? Marine Environmental Research, 114: 80–94. Boeklen, W. J., Yarnes, C. T., Cook, B. A., and James, A. C. 2011. On the use of stable isotopes in trophic ecology. Annual Review of Ecology, Evolution, and Systematics, 42: 411–440. Bolstrad, W. M., and Curran, J. M. 2016. Introduction to Bayesian Statistics. Wiley, New Jersey, NJ. 624pp. Bond, M. E., Valentin-Albanese, J., Babcock, E. A., Heithaus, M. R., Grubbs, R. D., Cerrato, R., Peterson, B. J. et al. 2019. Top predators induce habitat shifts in prey within marine protected areas. Oecolo- gia, 190: 375–385. Cardona, L., Lloret-Lloret, E., Moles, J., and Avila, C. 2021. Latitudi- nal changes in the trophic structure of Benthic coastal food webs along the Antarctic Peninsula. Marine Environmental Research, 167: 105290. Cardona, L., Reñones, O., Gouragine, A., Saporiti, F., Aguilar, A., and Moranta, J. 2020. Fishing alters resource partitioning between colour morphs in a temperate coastal fish. Marine Ecology Progress Series, 648: 179–190. Carretta, J. V., Forney, K. A., Oleson, E. M., Weller, D. W., Lang, A. R., Baker, J., Muto, M. M. et al. 2020. U.S. Pa- cific Marine Mammal Stock Assessments: 2019, U.S. Department of Commerce, NOAA Technical Memorandum NMFS-SWFSC- 629. https://swfsc-publications.fisheries.noaa.gov/publications/CR/ 2021/2021Carretta2.pdf (last accessed 1 December 2022). Cheng, B. S., Alteri, A. H., Torchin, E. M., and Ruiz, G. M. 2019. Can marine reserves restore lost ecosystem functioning? A global synthe- sis. Ecology, 100: e02617. Cheung, W. W. L., Sarmiento, J. L., Dunne, J., Frölicher, T. L., Lam, V.W.Y, Palomares, M. L. D., Watson, R. et al. 2012. Shrinking of fishes exacerbates impacts of global ocean changes on marine ecosystems. Nature Climate Change, 3: 254. Downloaded from https://academic.oup.com/icesjms/advance-article/doi/10.1093/icesjms/fsac229/6962286 by guest on 12 February 2023
  • 14. 14 L. Cardona et al. Christensen, V., Gue, S., Heymans, J. J., Walters, C. J., Watson, R, Zeller, D., and Pauly, D. 2003. Hundred-year decline of North Atlantic predatory fishes. Fish and Fisheries, 4: 1–24. Coll, J., Garcia-Rubies, A., Morey, G., Reñones, O., Álvarez-Berastegui, D., Navarro, O., and Grau, A. M. 2013. Using no-take marine re- serves as a tool for evaluating rocky-reef fish resources in the western Mediterranean). ICES Journal of Marine Science, 70: 578–590. Coll, J., Reñones, O., Moranta, J., Álvarez-Berastegui, D., and Cardona, L. 2020. Els peixos del fons durs infralitorals de l’arxipèlag de Cabr- era. Efectes dels 25 anys de Parc Nacional. In Arxipèlag de Cabrera: Història Natural, 30, pp. 243–276. Ed. by Grau A. M., Fronós J. J., Mateu G., Oliver P. A., and Terrasa B. Monografies de la Societat d’Història Natural de les Balears, Palma, Spain. 738pp. Coll, M., Piroddi, C., Albouy, C., Ben Rais Lasram, F., Cheung, W.W.L., Christensen, V., Karpouzi, V. S. et al. 2012. The Mediterranean Sea under siege: spatial overlap between marine biodiversity, cumulative threats and marine reserves. Global Ecology and Biogeography, 21: 465–480. Coull, K. A., Jermyn, A. S., Newton, A. W., Henderson, G. I., and Hall, W. B. 1989. Length/Weight Relationships for 88 Species of Fish En- countered in the North Atlantic. Scottish Fisheries Research Report, 43. Department of Agriculture and Fisheries for Scotland, Aberdeen. D’Agata, S., Mouillot, D., Wantiez, L., Friedlander, A. M., Kulbicki, M., and Vigliola, L. 2016. Marine reserves lag behind wilderness in the conservation of key functional roles. Nature Communications, 7: 72000. Dell, C., Montoya, J., and Hay, M. 2015. Effect of marine protected areas (MPAs) on consumer diet: MPA fish feed higher in the food chain. Marine Progress Series, 540: 227–234. DeLong, J. P., Gilbert, B., Shurins, J. B., Savage, V. M., Barton, B. T., Clements, C. F., Dell, A. I. et al. 2015. The body size dependence of trophic cascades. The American Naturalist, 185: 354–366. Eger, A. M., and Baum, J. K. 2020. Trophic cascades and connectivity in coastal benthic marine ecosystems: a meta-analysis of experimental and observational research. Marine Ecology Progress Series, 656: 139–152. Eloranta, A. P., Kahilainen, K. K., Amundsen, P.-A., Knudsen, R., Har- rod, C., and Jones, R. I. 2015. Lake size and fish diversity determine resource use and trophic position of a top predator in high-latitude lakes. Ecology and Evolution, 5: 1664–1675. Estes, J.A, Terborgh, J., Brashares, J., Power, M. E., Berger, J., Bond, W. J., Carpenter, S. R. et al. 2011. Trophic downgrading of planet earth. Science, 333: 301–306. Figueiredo, M., Morato, T., Barreiros, J. P., Afonso, P., and Serrao- Santos, R. 2005. Feeding ecology of the white seabream, Diplodus sargus, and the ballan wrasse, Labrus bergylta, in the Azores. Fish- eries Research, 75: 107–119. Frank, K. T., Petrie, B., Choi, J. S., and Leggett, W. C. 2005. Trophic cas- cades in a formerly cod-dominated ecosystem. Science, 308: 1621– 1623. Fry, B., and Davis, J. 2015. Rescaling stable isotope data for standard- ized evaluations of food webs and species niches. Marine Ecology Progress Series, 528: 7–17. Gil Fernández, C., Paulo, D., Serrao, E. A., and Engelen, A. H. 2016. Limited differences in fish and benthic communities and possible cascading effects inside and outside a protected marine area in Sagres (SW Portugal). Marine Environmental Research, 114: 12–23. Gill, A. B. 2003. The dynamics of prey choice in fish: the importance of prey size and satiation. Journal of Fish Biology, 63: 105–116. Hackradt, C. W., Garcıía-Charton, J. A., Harmelin-Vivien, M, Pérez- Ruzafa, A., Le Diréach, L, Bayle-Sempere, J., Charbonnel, E. et al. 2014. Response of rocky reef top predators (Serranidae: epinepheli- nae) in and around marine protected areas in the western Mediter- ranean Sea. PLoS One, 9: e98206. Halpern, B. S. 2003. The impact of marine reserves: do reserves work and does reserve size matter? Ecological Applications, 13: 117–137. Hamilton, S. L., Newsome, S. D., and Caselle, J. E. 2014. Dietary niche expansion of a kelp forest predator recovering from intense com- mercial exploitation. Ecology, 95: 164–172. Hammerschlag, N., Schmitz, O. J., Flecker, A. S., Lafferty, K. D., Sih, A., Atwood, T. B., Gallagher, A. J. et al. 2019. Ecosystem function and services of aquatic predators in the Anthropocene. Trends in Ecology and Evolution, 34: 369–383. Harmelin, J. G., and Harmelin-Vivien., M. 1999. A review on habi- tat, diet and growth of the dusky grouper Epinephelus marginatus (Lowe, 1834). Marine Life, 9: 11–20. Heithaus, M. R., Wirsing, A. J., and Dill, L. M. 2012. The ecological importance of intact top-predator populations: a synthesis of 15 years of research in a seagrass ecosystem. Marine and Freshwater Research, 63: 1039–1050. Hilborn, R., Stokes, K., Maguire, J.-J., Smith, T., Botsford, L. W., Mangel, M., Orensanz, J. et al. 2004. When can marine reserves improve fisheries management? Ocean Coastal Management, 47: 197–205. Jackson, A. L., Inger, R., Parnell, A. C., and Bearhop, S. 2011. Compar- ing isotopic niche widths among and within communities: SIBER— stable isotope Bayesian ellipses in R. Journal of Animal Ecology, 80: 595–602. Lamb, R., and Johnson, D. 2010. Trophic restructuring of coral reef fish communities in a large marine reserve. Marine Ecology Progress Series, 408: 169–180. Layman, C. A., Arrington, D. A., Montaña, C. G., and Post, D. M. 2007. Can stable isotope ratios provide for community-wide measures of trophic structure? Ecology, 88: 42–48. Libralato, S., Coll, M., Tempesta, M., and Santojanni, A. 2010. Food- web traits of protected and exploited areas of the Adriatic Sea. Bio- logical Conservation, 143: 2182–2194. López-Rasgado, F. J., Lluch-Cota, S. E., Balart, E. F., and Herzka, S. Z. 2016. Variation in isotopic trophic structure and fish diversity in mangrove systems subject to different levels of habitat modification in the Gulf of California, Mexico. Bulletin of Marine Science, 92: 399–422. Marsh, J. M., Mueter, F. J., Iken, K., and Danielson, S. 2017. Onto- genetic, spatial and temporal variation in trophic level and diet of Chukchi Sea fishes. Deep Sea Research Part II, 135: 78–94. Marshall, H. H., Inger, R., Jackson, A. L., McDonald, R. A., Thompson, F. J., and Cant, M. A. 2019. Stable isotopes are quantitative indica- tors of trophic niche. Ecology Letters, 22: 1990–1992. Maynou, F., Morales-Nin, B., Cabanellas-Reboredo, M., Palmer, M., García, E., and Grau, A. M. 2013. Small-scale fisheries in the Balearic Islands (W Mediterranean): a socio-economic approach. Fisheries Research, 139: 11–17. McCauley, D. J., Pinsky, M. L., Palumbi, S. R., Estes, J. A., Joyce, F. H., and Warner, R. R. 2015. Marine defaunation: animal loss in the global ocean. Science, 347: 1255641. McClanahan, T. R., Schroeder, R. E.,Friedlander, Vigliola, L., Wantierz, L., Caselle, J. E., Graham, N.A.J. et al. 2019. Global baselines and benchmarks for fish biomass: comparing remote reefs and fisheries closures. Marine Ecology Progress Series, 612: 167–192. Morales-Nin, B., and Moranta, J. 1997. Life history and fishery of the common dentex (Dentex dentex) in Mallorca (Balearic Islands, western Mediterranean). Fisheries Research, 30: 67–76. Morales-Nin, B., Moranta, J., García, C., Tugores, M. P., Grau, A. M., Riera, F., and Cerdà, M. 2005. The recreational fishery off Majorca Island (western Mediterranean): some implications for coastal re- source management. ICES Journal of Marine Science, 62: 727–739. Moranta, J., Reñones, O., Gouraguine, A., Saporiti, F., and Cardona, L., 2020. The effects of fishing on the ontogeny of trophic position and body condition of a small-sized temperate marine fish. Marine Environmental Research, 161: 105055. Morey, G., Moranta, J., Massutí, E., Grau, A., Linde, M., Riera, F., and Morales-Nin, B. 2003. Weight–length relationships of littoral to lower slope fishes from the western Mediterranean. Fisheries Re- search, 62: 89–96. Moro, S., Jona-Lasinio, G., Block, B., Micheli, F., De Leo, G., Ser- ena, F., Bottaro, M. et al. 2019. Abundance and distribution of the white shark in the Mediterranean Sea. Fish and Fisheries, 21: 338–349. Downloaded from https://academic.oup.com/icesjms/advance-article/doi/10.1093/icesjms/fsac229/6962286 by guest on 12 February 2023
  • 15. Food web structure in marine protected areas 15 Myers, R. A., Baum, J. K., Sheperd, T. D., Powers, S. P., and Peteron, C. H. 2007. Cascading effects of the loss of apex predatory sharks from a coastal ocean. Science, 315: 1846–1850. Newsome, S. D., Martinez del Rio, C., Bearhop, S., and Phillips, D. L. 2007. A niche for isotope ecology. Frontiers in Ecology and the En- vironment, 5: 429–436. Nuez, I., Gazo, M., and Cardona, L. 2021. A closer look at the by- catch of medium-sized and large sharks in the northern Catalan coast (north-western Mediterranean Sea): evidence of an ongoing decline? Aquatic Conservation: Marine and Freshwater Ecosystems, 31: 2369–238. Ólafsdóttir, G. Á., Edvardsson, R., Timsic, S., Harrison, R., and Pat- terson, W. P. 2021. A millennium of trophic stability in Atlantic cod (Gadus morhua): transition to a lower and converging trophic niche in modern times. Scientific Reports, 11: 1–11. Olson, A. M., Trebilco, R., and Salomon, A. K. 2019. Expanded con- sumer niche widths may signal an early response to spatial protec- tion. PLoS One, 14: e0223748. Olson, A., Frid, A., Santos, J., and Juanes, F. 2020. Trophic position scales positively with body size within but not among four species of rocky reef predators. Marine Ecology Progress Series, 640: 189– 200. Ordines, F., Moranta, J., Palmer, M., Lerycke, A., Suau, A., Morales- Nin, B., and Grau, A. 2005. Variations in a shallow rocky reef fish community at different spatial scales in the western Mediterranean Sea. Marine Ecology Progress Series, 304: 221–233. Ouréns, R., Cambiè, G., and Freire, J. 2015. Characterizing the com- plexity of the fleet dynamics for an effective fisheries management: the case of the Cíes Islands (NW Spain). Scientia Marina, 79: 453– 464. Palmer, M., Balle, S., March, D., Alós, J., and Linde, M. 2011. Size estimation of circular home range from fish mark-release-(single)- recapture data: case study of a small labrid targeted by ecreational fishing. Marine Ecology Progress Series, 430: 87–97. Pastor, J., Verdoit-Jarraya, M., Astruch, P., Dalias, N., Nelva Pasqual, J.-S., Saragoni, G., and Lenfant, P. 2009. Acoustic telemetry survey of the dusky grouper (Epinephelus marginatus) in the Marine Re- serve of Cerbère-Banyuls: informations on the territoriality of this emblematic species. Comptes Rendues Biologies, 332: 732–740. Piroddi, C., Coll, M., Steenbeek, J., Macias Moy, D., and Christensen, V. 2015. Modelling the Mediterranean marine ecosystem as a whole: assessing the challenge of complexity. Marine Ecology Progress Se- ries, 533: 47–65. Pita, P., and Freire, J. 2011. Movements of three large coastal preda- tory fishes in the northeast Atlantic: a preliminary telemetry study. Scientia Marina, 75: 759–770. Pita, P., and Freire, J. 2016. Assessing the impact of spear fishing by using competition records and underwater visual censuses. Scientia Marina, 80: 27–28. Pita, P., and Freire, J. 2019. Trophic ecology of an Atlantic kelp forest fish assemblage (NW Spain) targeted by recreational fishers and im- plications for coastal management. Journal of the Marine Biological Association of the United Kingdom, 99: 19–29. Pulliam, H. R. 1974. On the theory of optimal diets. The American Naturalists, 108: 59–74. Reñones, O., Piñeiro, C., Mas, X., and Goñi, R. 2007. Age and growth of the dusky grouper Epinephelus marginatus (Lowe 1834) in an exploited population of the western Mediterranean Sea. Journal of Fish Biology, 71: 346–362. Reñones, O., Polunin, N.V.C., and Goñi, R. 2002. Size related dietary shifts of Epinephelus marginatus in a western Mediterranean littoral ecosystem: an isotope and stomach content analysis. Journal of Fish Biology, 61: 122–137. Roff, G., Doropoulos, C., Rogers, A., Bozec, Y. M., Krueck, N. C., Au- rellado, E., Priest, M. et al. 2016. The ecological role of sharks on coral reefs. Trends in Ecology and Evolution, 31: 395–407. Sala, E. 2004. The past and present topology and structure of Mediter- ranean subtidal rocky-shore food webs. Ecosystems, 7: 333–340. Sala, E., and Ballesteros, E. 1997. Partitioning of space and food re- sources by three fish of the genus Diplodus (Sparidae) in a Mediter- ranean rocky infralittoral ecosystem. Marine Ecology Progress Se- ries, 15: 273–283. Sala, E., Ballesteros, E., Dendrinos, P., Di Franco, A., Ferretti, F., Fo- ley, D., Fraschetti, S. et al. 2012. The structure of Mediterranean rocky reef ecosystems across environmental and human gradients, and conservation implications. PLoS One 7: e32742. Sandin, S. A., Smith, J. E., DeMartini, E. E., Dinsdale, E. A., Donner, S. D., Friedlander, A. M., and Sala, E. 2008. Baselines and degradation of coral reefs in the Northern Line Islands. PLoS One, 3: e1548. Saporiti, F., Bearhop, S., Silva, L., Vales, D. G., Zenteno, L., Crespo, E. A., Aguilar, A. et al. 2014. Longer and less overlapping food webs in anthropogenically disturbed marine ecosystems: confirmations from the ast. PLoS One, 9: e103132. Saporiti, F., Bearhop, S., Vales, D. G., Silva, L., Zenteno, L., Tavares, M., Crespo, E. A. et al. 2015. Latitudinal changes in the structure of marine food webs in the southwestern Atlantic Ocean. Marine Ecology Progress Series, 538: 23–34. Schoener, T. W. 1971. Theory of feeding strategies. Annual Review of Ecology and Systematics, 2: 369–404. Skrzypek, G. 2013. Normalization procedures and reference material selection in stable HCNOS isotope analyses: an overview. Analytical and Bioanalytical Chemistry, 405: 2815–2823. Spitz, J., Chouvelon, T., Cardinaud, M., Kostecki, C., and Lorance, P. 2013. Prey preferences of adult sea bass Dicentrarchus labrax in the northeastern Atlantic: implications for bycatch of common dolphin Delphinus delphis. ICES Journal of Marine Science, 70: 452–461. Stephens, D. W., and Krebs, J. R. 1986. Foraging Theory. Princeton Uni- versity Press, Princeton, NJ. Stuthmann, L. E., and Castellanos-Galindo, G. A. 2020. Trophic posi- tion and isotopic niche of mangrove fish assemblages at both sides of the Isthmus of Panama. Bulletin of Marine Science, 96: 449–467. Syväranta, J., Lensu, A., Marjomäki, T. J., Oksanen, S., and Jones, R. I. 2013. An empirical evaluation of the utility of Convex Hull and Standard Ellipse Areas for assessing population niche widths from stable isotope data. PLoS One, 8: e56094. Villegas-Ríos, D., Alonso-Fernández, A., Fabeiro, M., Bañón, R., and Saborido-Rey, F. 2013a. Demographic variation between colour pat- terns in a temperate protogynous hermaphrodite, the ballan wrasse Labrus bergylta. PLoS One, 8: e71591. Villegas-Ríos, D., Alós, J., March, D., Palmer, M., Mucientes, G., and Saborido-Rey, F. 2013b. Home range and diel behavior of the ballan wrasse, Labrus bergylta, determined by acoustic telemetry. Journal of Sea Research, 80: 61–71. Werner, E. E., and Hall, D. J. 1974. Optimal foraging and the size selec- tion of prey by the bluegill sunfish (Lepomis macrochirus). Ecology, 55: 1042–1052. Zar, J. H., 1996. Bioestatistical Analysis. Prentice Hall, New Jersey, NJ. 662pp. Handling Editor: Mary Hunsicker Downloaded from https://academic.oup.com/icesjms/advance-article/doi/10.1093/icesjms/fsac229/6962286 by guest on 12 February 2023