1. Market Strategy
May 2010
Angel Portfolio Euro crisis behind us
Sector Weight % Stocks
The EU and IMF have agreed to set up an almost US$1tn line of credit for
Auto & 7.0 Maruti, Fag troubled EU nations, which should have a similar similar effect as the US Federal
Ancillaries Bearings, Reserve’s TARP package in restoring confidence in financial markets. This massive
JK Tyres step follows the US$147bn bailout package for Greece on 2nd May, 2010 to
Banking 28.0 SBI, Axis Bank, prevent it from defaulting on its public debt. In return, Greece had to agree to
ICICI Bank, reduce its fiscal deficit to 3% by 2014. Greece's fiscal deficit had risen to almost
HDFC Bank 14% in 2009 and public debt was as high as 115% (US$400bn), while domestic
FMCG 3.0 ITC savings were abysmal at about 5.5% - necessitating the bailout.
Hotels 3.0 Taj GVK
Greece's problems are symptomatic of its high median age of 42 and the
Infra & 18.0 L&T, Reliance Infra, resulting low savings rate of 5.5%. In our view, a country with a high median age
Cap Goods Madhucon Projects,
has two options to improve growth - if it is a net exporter of capital then on the
IVRCL Infra,
back of its strong currency it can run a higher fiscal deficit to support growth. The
Jyoti Structures
other option is to devalue its currency to increase exports as a driver for GDP
Media 2.0 Jagran Prakashan
growth.
Oil & Gas 14.0 Reliance Industries
Pharma 4.0 Dishman Pharma, In case of Greece, till it is part of the EU, currency devaluation is not an option. In
Lupin such a situation, even though it does not have its own strong currency, having a
Metals 2.0 Electrosteel Castings higher fiscal deficit on the strength of the Euro would have been a viable option,
Real Estate 3.0 Anant Raj Industries had it been acceptable to other EU nations. But in its current form, unlike the US
Software 12.0 Infosys, TCS, bailout packages last year, this bailout comes with substantial strings attached,
Tech Mahindra, requiring stringent belt-tightening like public sector wage cuts, sharp increase in
Mphasis tax rates, cut in pension payments and raising of retirement ages, which we
Telecom 4.0 Bharti Airtel believe would have a detrimental impact on domestic demand in the country.
Given its small size (less than 3% of EU GDP and 0.6% of global GDP), the
Top Picks burden on EU to support its fiscal imbalances appear manageable. Therefore, we
Company CMP TP believe eventually, domestic dissent notwithstanding, the stronger EU nations may
Bharti Airtel 287 360 end up relaxing the fiscal targets as well, in the larger interest of maintaining
financil and political stability. Portugal faces a similar situation, with its GDP less
ICICI Bank 876 1,166
than 2% of EU GDP and 0.4% of global GDP. As far as Spain and Italy are
Maruti Suzuki 1,275 1,694
concerned, in our view they have better fundamentals (savings rate of 22% and
Tech Mahindra 712 1,168 16% and current account deficit of 5% and 3% respectively) and, with confidence
SBI 2,226 2,631 getting restored in the financial markets, they are unlikely to actually draw down
Anant Raj 120 196 materially on the bailout funds.
Dishman Pharma 217 311
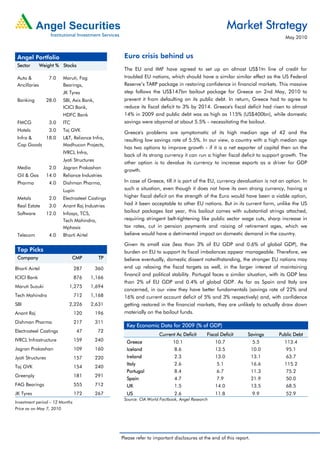
Key Economic Data for 2009 (% of GDP)
Electrosteel Castings 47 72
Current Ac Deficit Fiscal Deficit Savings Public Debt
IVRCL Infrastructure 159 240 Greece 10.1 10.7 5.5 113.4
Jagran Prakashan 109 160 Iceland 8.6 13.5 10.0 95.1
Jyoti Structures 157 220 Ireland 2.3 13.0 13.1 63.7
Italy 2.6 5.1 16.6 115.2
Taj GVK 154 240
Portugal 8.4 6.7 11.3 75.2
Greenply 181 291
Spain 4.7 7.9 21.9 50.0
FAG Bearings 555 712 UK 1.5 14.0 13.5 68.5
JK Tyres 172 267 US 2.6 11.8 9.9 52.9
Source: CIA World Factbook, Angel Research
Investment period – 12 Months
Price as on May 7, 2010
Please refer to important disclosures at the end of this report.
2. Market Strategy
Result season - growth headed towards historical levels
A common thread binding the fourth quarter results declared so far is that most
sectors are seeing indications of growth rates recovering to historical levels. Tier 1
IT companies are guiding for 15%+ topline growth, the banking sector is seeing a
revival in credit growth towards 20% levels, high order book to sales in
infrastructure and cap goods is pointing towards pick-up in execution growth,
justifying our overweight view. On the other hand, margins are already correcting
to normalized levels in FMCG and cement, justifying our underweight stance.
Overall, we expect GDP growth to increase to an estimated 8.5- 9% over
FY2011-12E, driving a healthy 21% CAGR in Sensex Earnings. Assigning 17x to
FY2012E Sensex EPS, we arrive at a Sensex target of 21,000 by March 2011.
Model Portfolio: Banking and Infrastructure key top-down calls;
interesting bottom-up calls in several sectors
Infrastructure: Valuations are attractive following the significant under-
performance on execution concerns. However, we expect execution growth to
accelerate to 17%+ yoy on capital availability, political will and strong order
pipeline. Midcaps like IVRCL Infra and Madhucon look especially attractive
due to potential upside from subsidiary valuations.
Banking: Core earnings are expected to accelerate due to increasing credit
and fee Income and declining NPAs. Moreover, in a rising interest rate
environment, banks like SBI and HDFC Bank with strong CASA are relatively
better placed.
Pharma: We have given higher weightage to non-Sensex Pharma companies
such as Lupin and Dishman Pharma due to company-specific positive business
prospects.
Auto: In this quarter, we have introduced some interesting stories in the
Mid-cap Auto Ancillary space, viz. FAG Bearings and JK Tyres.
IT: Similarly, we have introduced two of the smaller Tier 1 players viz. Mphasis
(superior growth outlook) and Tech Mahindra (cheap valuations of 10.6x
FY2012E EPS vs. 20x-22x for top players).
In the ensuing pages we have discussed 15 of our Top Picks that are expected to
significantly outperform the Sensex. We have chosen the stocks from across sectors
including large, mid and small caps such as SBI, Tech Mahindra, Electrosteel
Casting, Greenply, etc.
May 2010 2
3. Market Strategy
Large Cap Picks
Bharti Airtel (CMP: Rs.287/ TP: Rs.360/ Upside: 25%)
Bharti continues to maintain its leadership status in customer and revenue market
share helped by strong subscriber addition (33.7mn in FY2010) and high ARPU of
Rs253 (Industry average of Rs164).
The competition (price war) is unlikely to intensify further as the cost of operation
for new players are high and unsustainable. We believe Bharti with high
EBIDTA/minute of Rs 0.16 is relatively placed better than its peers.
Valuations for Zain are perceived as expensive but would still be value accretive on
account of financial leverage from the Leveraged Buy Out structuring of the deal.
Bharti is currently trading at 11.5x FY12E EPS, a significant discount to its historical
average of 26x and Sensex P/E of 14.5 and hence we maintain a Buy on the stock.
Y/E Sales OPM PAT EPS ROE P/E P/BV EV/EBITDA EV/Sales
March (Rs cr) (%) (Rs cr) (Rs) (%) (x) (x) (x) (x)
FY2011E 42,773 35.3 8,350 22.0 18.6 13.0 2.3 7.3 2.6
FY2012E 47,328 35.6 9,449 24.9 17.9 11.5 2.0 6.4 2.3
ICICI Bank (CMP: Rs.876/ TP: Rs.1,166/ Upside: 33%)
The bank is well-positioned to gain market share on the back of substantial branch
expansion (210 branches added during last 12 months, about 875 more in next
12-18 months) as well as strong Capital Adequacy at 19.4% (Tier-I at 14.2%).
Net Interest Margins of the bank are expected to improve on the back of increase
in CASA ratio to 40% (29% in FY2009).
With an improving economic environment, NPA losses are expected to start
declining. The Bank has also done lower restructuring of loans than PSU Banks
(10% of net worth vs. 40%+ for most PSU Banks).
The stock is trading at an attractive FY2012E P/BV of 1.7x and hence we
recommend a Buy on the stock.
Y/E Op Inc. NIM PAT EPS ABV ROA ROE P/E P/ABV
March (Rs cr) (%) (Rs cr) (Rs) (Rs) (%) (%) (x) (x)
FY2011E 18,207 2.5 5,000 44.8 483.1 1.1 11.5 19.5 1.8
FY2012E 22,269 2.5 6,765 60.7 518.1 1.3 15.0 14.4 1.7
May 2010 3
4. Market Strategy
Maruti Suzuki (CMP: Rs.1,275/ TP: Rs.1,694/ Upside: 33%)
Given India's low car penetration (12 per 1,000 vs. 21 per 1,000 in China) and
with PPP-based Per Capita estimated to approach the empirically-observed
inflection point for car demand of US$5,000 over the next 4-5 years, we expect
13% CAGR in domestic volumes over FY2010-12E.
Maruti has a sizeable competitive advantage over foreign entrants due to its
widespread distribution network (2,767 service and 681 sales outlets).
Moreover, with Suzuki Japan making Maruti a manufacturing hub for small cars,
to cater to increasing global demand caused by rising fuel prices and stricter
emission standards, we estimate 18% CAGR in export volumes over FY2010-12E.
We believe attractive valuations of 12x FY2012E EPS due to recent
underperformance provide an entry point for investors looking to play the India
consumer story.
Y/E Sales OPM PAT EPS ROE P/E P/BV EV/EBITDA EV/Sales
March (Rs cr) (%) (Rs cr) (Rs) (%) (x) (x) (x) (x)
FY2011E 33,593 11.3 2,695 93.3 19.2 13.6 2.5 7.7 0.8
FY2012E 39,238 11.3 3,060 105.9 17.8 12.0 2.1 6.3 0.6
Tech Mahindra (CMP: Rs.712/ TP: Rs.1,168/ Upside: 64%)
Restructuring deal with BT ensures compensatory volumes; Muted pricing terms
may enhance with an improvement in the client's financial health.
Sustained volume traction from non-BT clients (CQGR of 16.1% over 1QFY2006-
3QFY2010) continues to provide revenue growth momentum, margin
improvement, geographical diversification and reduced client concentration to the
company, covering the decline in the top account.
Positive news flow from Satyam in the form of client retention, new deal wins and
favorable settlement with Upaid provides comfort on the future business prospects.
The stock is trading at a substantial 60% discount (after deducting value of Satyam
Stake) to Infosys on a 1-year forward P/E vs. a 5-year average discount of 20%
and an FY2012E EV/Sales of 1.8x (vs. Peer average 3.5x) and hence we maintain
a Buy on the stock.
Y/E Sales OPM PAT EPS ROE P/E P/BV EV/EBITDA EV/Sales*
March (Rs cr) (%) (Rs cr) (Rs) (%) (x) (x) (x) (x)
FY2011E 4,989 24.0 763 58.3 24.9 12.2 2.6 8.6 2.1
FY2012E 5,704 23.0 876 67.0 22.0 10.6 2.0 7.9 1.8
Note: *Valuations after adjusting Satyam
State Bank of India (CMP: Rs.2,226/ TP: Rs.2,631/ Upside: 18%)
A key competitive advantage for SBI is its consistent increase in market share of
savings deposits (increased from 20.5% in FY2007 to 23.5% by December 2009),
leveraging its huge trust factor through faster branch expansion (9.5% CAGR v/s
2-5% for most PSBs).
May 2010 4
5. Market Strategy
It also has one of the highest Fee income amongst PSU banks (1.2% of assets vs.
about 0.8-0.9% for peers in 9MFY2010), owing to its strong corporate and
government business relationships.
The Bank is expected to comfortably absorb asset quality pressures and we see this
as a short-term concern which has been over-discounted.
Moreover, it is trading at an attractive P/BV of 1.3x FY2012E (excluding the non-
banking subsidiaries) vs. its 5-year average of 1.6x and hence we recommend a
Buy on the stock.
Y/E Op Inc. NIM PAT EPS ABV ROA ROE P/E P/ABV
March (Rs cr) (%) (Rs cr) (Rs) (Rs) (%) (%) (x) (x)
FY2011E 45,173 2.7 11,171 176.0 1,163.2 0.9 16.9 12.6 1.9
FY2012E 53,966 2.7 15,389 242.4 1,353.5 1.1 20.3 9.2 1.6
Mid Cap Picks
Anant Raj Industries (CMP: Rs.120/ TP: Rs.196/ Upside: 60%)
Almost all of ARIL's land bank (872 acres) is exclusively located in the NCR within
50km of Delhi, with approximately 525 acres in Delhi. This land bank has been
acquired at an historical average cost of Rs300/sq ft.
We expect ARIL's two super premium Residential projects of Hauz Khas and
Bhagwandas, located in the heart of Delhi, to drive its near-term operational
visibility and help register Rs600cr Profit over the next three years. Further, ARIL
has 70% pre-lease commitments at its Manesar IT Park, coupled with five hotels
getting operational by FY2011E which will improve rental visibility.
ARIL is trading at a 48% discount to its NAV. The stock is trading at 6.8x FY2012E
EPS and 0.8x FY2012E P/BV and hence we recommend Buy on stock.
Y/E Sales OPM PAT EPS ROE P/E P/BV EV/EBITDA EV/Sales
March (Rs cr) (%) (Rs cr) (Rs) (%) (x) (x) (x) (x)
FY2011E 657 67.3 372 11.8 9.7 10.1 1.0 6.4 4.2
FY2012E 1,143 73.9 555 17.6 12.9 6.8 0.8 4.4 2.8
Dishman Pharma (CMP: Rs.217/ TP: Rs.311/ Upside: 43%)
Dishman has incurred organic capex of Rs300cr in the last three years towards
expansion of existing facilities at its Bavla unit and building the China and HPAPI
facilities.
Post all these facilities coming on-stream FY2011E onwards, Dishman would
strengthen its ties with the Global Innovators leading to stable Revenue flow over
the long run.
Further, Revenues from the Abbott-Solvay contract, which constituted 16% of
FY2009 Sales, have also started normalising from 3QFY2010 onwards with
up-tick in Eprosartan volumes.
Dishman is currently trading at attractive valuations of 9.0x FY2012E earnings and
hence we recommend Buy on the stock.
May 2010 5
6. Market Strategy
Y/E Sales OPM PAT EPS ROE P/E P/BV EV/EBITDA EV/Sales
March (Rs cr) (%) (Rs cr) (Rs) (%) (x) (x) (x) (x)
FY2011E 1,236 24.7 160 19.7 17.6 11.0 1.8 8.0 2.0
FY2012E 1,478 25.3 194 23.9 18.3 9.0 1.5 6.5 1.6
ElectroSteel Castings (CMP: Rs.47/ TP: Rs.72/ Upside: 53%)
Electrosteel Castings (ECL) is venturing into steel-making through its subsidiary
Electrosteel Integrated (EIL), which is setting up a 2.2mn tonne steel plant expected
to be commissioned by FY2012E. Further, ECL plans to list EIL to raise ~Rs300cr,
which is likely to unlock value for ECL.
ECL's backward integration initiatives through allocation of coking coal mines are
expected to result in expansion of EBITDA Margin by 1,304bp over FY2009-12E.
The company is also awaiting final environmental clearance for its iron ore mine,
which will further lower costs, but has not been factored in our estimates.
We recommend a Buy on the stock, valuing the Core business at 8x FY2012E
FDEPS and its investments in the Steel business at 1x Book Value.
Y/E Sales OPM PAT EPS ROE P/E P/BV EV/EBITDA EV/Sales
March (Rs cr) (%) (Rs cr) (Rs) (%) (x) (x) (x) (x)
FY2011E 1,706 26.2 211 5.6 12.8 8.4 0.8 5.7 1.5
FY2012E 1,818 28.0 249 6.6 13.6 7.1 0.7 5.0 1.4
IVRCL Infrastructure (CMP: Rs.159/ TP: Rs.240/ Upside: 51%)
IVRCL has a robust Order book of Rs21,500cr mainly on account of pick up and
early financial closures in road segment. This would lend revenue visibility and
execution ramp up inspite of the current Andhra Pradesh crisis.
Moreover, IVRAH has raised money by monetising land (Rs63cr) and NCD's
(Rs150cr). This would help funding the recently won BOT road projects.
The stock has underperformed its peers mainly on account of higher AP exposure
resulting in concerns over execution. However, we believe that higher than
expected order inflow from other segments (read road) would mitigate this short
term concern.
IVRCL is trading at an attractive valuations (Adj. P/E of 7.7x FY2012E), hence we
maintain a Buy on the stock.
Y/E Sales OPM PAT EPS ROE P/E P/BV EV/EBITDA EV/Sales
March (Rs cr) (%) (Rs cr) (Rs) (%) (x) (x) (x) (x)
FY2011E 7,570 9.4 323 11.6 13.9 13.7 1.8 9.4 0.9
FY2012E 8,741 9.5 357 12.9 13.3 12.3 1.5 8.9 0.8
May 2010 6
7. Market Strategy
Jagran Prakashan (CMP: Rs.109/ TP: Rs.160/ Upside: 47%)
Post the economic recovery, Jagran Prakashan is likely to post up-tick in its
advertising revenues (17% CAGR during FY2010-12E) owing to its strong foothold
in the Hindi belt, increased focus on local advertising, rising colour inventory and
an expected ad-rate hike of 8-10% in the coming months.
Benign Newsprint cost (modeled in 8-10% hike) coupled with cost rationalization
measures, Rupee appreciation and lower losses in new initiatives (OOH and Event
Management to achieve break-even in FY2011E) are likely to boost operating
margins (modeled in 90bp rise during FY2010-12E).
Jagran maintained its 75%+ dividend payout even in a tough year like FY2009
where most of its peers slipped.
At the CMP, Jagran is available at 13.6x FY2012E Earnings (~0.75x PEG) which is
highly attractive given is 18% Earnings CAGR, high return ratios and strong
leadership position.
Y/E Sales OPM PAT EPS ROE P/E P/BV EV/EBITDA EV/Sales
March (Rs cr) (%) (Rs cr) (Rs) (%) (x) (x) (x) (x)
FY2011E 1,092 29.7 201 6.7 33.6 16.2 5.0 10.4 3.1
FY2012E 1,267 30.2 240 8.0 38.4 13.6 4.5 8.8 2.7
Jyoti Structures (CMP: Rs.157/ TP: Rs.220/ Upside: 40%)
Jyoti Structures (JSL) being one of the top three players in the transmission EPC
space in India would continue to ride high on back of massive investments lined up
in the power sector of the country.
JSL has a healthy order book of Rs4,030cr (1.9x FY2010E revenues), which
provides good revenue visibility and cushions it from short-term order fluctuations.
Besides, unlike peers, the large domestic presence (with exports constituting
around 5% of order backlog) which has price variation clause, helps to insulate
margins from input price fluctuations and volatile currency movements.
Currently, the stock is trading at attractive valuations of 11x and 9.3x its FY2011E
and FY2012E EPS respectively. We recommend a Buy on the stock.
Y/E Sales OPM PAT EPS ROE P/E P/BV EV/EBITDA EV/Sales
March (Rs cr) (%) (Rs cr) (Rs) (%) (x) (x) (x) (x)
FY2011E 2,508 10.9 116 14.2 20.9 11.0 2.1 5.9 0.6
FY2012E 2,908 10.8 139 16.9 20.7 9.3 1.8 5.2 0.6
May 2010 7
8. Market Strategy
Small Cap Picks
FAG Bearings (CMP: Rs.555/ TP: Rs.712/ Upside: 28%)
With increasing mechanisation, demand for bearings is expected to exceed overall
IIP growth in India. Consequently, the Industrial Segment (which accounts for
almost 50% of the Indian Bearings market) offers immense growth opportunity for
the Bearings industry.
Moreover, the Bearings Segment has a direct correlation with Auto Sector growth,
which is expected to grow at around 10% per annum over the next 2-3 years.
The stock is currently trading below its average historical valuations, at 9.3x
CY2011E EPS and 1.4x CY2011E BV (vs. average of 2x 1-year forward BV).
Further, we believe FAG Bearings scores well over its peers and we believe that it is
a good long-term investment pick, in view of its strong financials.
Y/E Sales OPM PAT EPS ROE P/E P/BV EV/EBITDA EV/Sales
Dec (Rs cr) (%) (Rs cr) (Rs) (%) (x) (x) (x) (x)
CY2010E 1,148 15.0 85 51.3 17.1 10.8 1.6 4.9 0.7
CY2011E 1,012 15.4 99 59.4 17.0 9.3 1.4 4.1 0.6
Greenply Industries (CMP: Rs.181/ TP: Rs.291/ Upside: 60%)
GIL is foraying into the lucrative, high-growth MDF market, with the largest MDF
plant in India (1,80,000m3/yr capacity), while continuing its strong expansion in
laminates (88% capacity expansion), that is estimated to drive 25% CAGR in sales
over FY2010-12E.
GIL has leading plywood and laminates brands, supported by ad-spend as high as
3.3% of total sales (around 10% of laminates sales). The company also has the
largest distribution network of over 15,000 dealers in this industry. These
advantages underpin the strong RoE profile of the company's brand-driven
business model (20% over FY2010-12E).
The stock is trading at an attractive P/E of 5.0x FY2012E (as against its historical
range of 3.3-9.3x 1-year forward EPS) and hence we recommend a Buy on the
stock.
Y/E Sales OPM PAT EPS ROE P/E P/BV EV/EBITDA EV/Sales
March (Rs cr) (%) (Rs cr) (Rs) (%) (x) (x) (x) (x)
FY2011E 1,044 14.0 63 21.7 17.3 8.3 1.3 5.8 0.8
FY2012E 1,292 15.0 110 36.4 23.3 5.0 1.0 4.3 0.6
May 2010 8
9. Market Strategy
JK Tyre & Industries (CMP: Rs.172/ TP: Rs.267/ Upside: 55%)
Given the shortage of radial tyres in the Trucks & Buses Segment, the company is
set to fully utilise its enhanced capacity, and that too at higher realisations (80% of
India's total truck/bus radial tyre production), driving strong earnings growth and
improving RoEs.
Further, the Tornel acquisition has already turned profitable in 2QFY10, aided by
the restructuring exercise implemented by the company.
The stock is available at attractive valuations of 3.2x FY2012E EPS and hence we
recommend a Buy.
Y/E Sales OPM PAT EPS ROE P/E P/BV EV/EBITDA EV/Sales
March (Rs cr) (%) (Rs cr) (Rs) (%) (x) (x) (x) (x)
FY2011E 5,447 11.0 186 45.5 17.3 3.8 0.6 3.1 0.3
FY2012E 6,049 11.2 219 53.5 17.1 3.2 0.5 2.3 0.2
TajGVK Hotels (CMP: Rs.154/ TP: Rs.240/ Upside: 56%)
Robust growth in Foreign Tourist Arrivals (15.1% growth during December 2009-
March 2010 vs. -12.7%in the corresponding period last year) and increased
domestic tourist activity is enabling hoteliers to overcome the tough phase
witnessed in the recent past.
Signs of improving demand are visible with occupancy rates staying above ~70%
since 3QFY2010 and Average Room Rates rising in 4QFY2010.
Considering the revival in demand happening in business destinations like
Hyderabad and Chennai, where TAJGVK has presence, we expect the company to
be a significant beneficiary in coming quarters.
Moreover, in comparison with its peers, the stock trades at an attractive valuation
of Rs1cr FY2012E EV/Room and 12.7x its FY2012E EPS. Hence we recommend a
Buy on the stock.
Y/E Sales OPM PAT EPS ROE P/E P/BV EV/EBITDA EV/Sales
March (Rs cr) (%) (Rs cr) (Rs) (%) (x) (x) (x) (x)
FY2011E 298 40.6 56 9.0 17.7 17.2 2.8 9.2 3.7
FY2012E 342 42.8 76 12.2 20.3 12.7 2.4 7.2 3.1
May 2010 9
15. Market Strategy
Disclaimer
This document is solely for the personal information of the recipient, and must not be singularly
used as the basis of any investment decision. Nothing in this document should be construed as
investment or financial advice. Each recipient of this document should make such investigations as
they deem necessary to arrive at an independent evaluation of an investment in the securities of
the companies referred to in this document (including the merits and risks involved), and should
consult their own advisors to determine the merits and risks of such an investment.
Angel Securities Limited, its affiliates, directors, its proprietary trading and investment businesses
may, from time to time, make investment decisions that are inconsistent with or contradictory to
the recommendations expressed herein. The views contained in this document are those of the
analyst, and the company may or may not subscribe to all the views expressed within.
Reports based on technical and derivative analysis center on studying charts of a stock's price
movement, outstanding positions and trading volume, as opposed to focusing on a company's
fundamentals and, as such, may not match with a report on a company's fundamentals.
The information in this document has been printed on the basis of publicly available information,
internal data and other reliable sources believed to be true, and is for general guidance only.
Angel Securities Limited has not independently verified all the information contained within this
document. Accordingly, we cannot testify, nor make any representation or warranty, express or
implied, to the accuracy, contents or data contained within this document. While Angel Securities
Limited endeavours to update on a reasonable basis the information discussed in this material,
there may be regulatory, compliance, or other reasons that prevent us from doing so.
This document is being supplied to you solely for your information, and its contents, information or
data may not be reproduced, redistributed or passed on, directly or indirectly.
Angel Securities Limited and its affiliates may seek to provide or have engaged in providing
corporate finance, investment banking or other advisory services in a merger or specific
transaction to the companies referred to in this report, as on the date of this report or in the past.
Neither Angel Securities Limited, nor its directors, employees or affiliates shall be liable for any
loss or damage that may arise from or in connection with the use of this information.
Note: Please refer to the important `Stock Holding Disclosure' report on the Angel
website (Research Section).
Ratings (Returns): Buy (> 15%) Accumulate (5% to 15%) Neutral (-5 to 5%) Reduce (-5% to -15%) Sell (< -15%)
May 2010 15
16. Address: Acme Plaza, ‘A’ Wing, 3rd Floor, M.V. Road, Opp. Sangam Cinema, Andheri (E), Mumbai - 400 059.
Tel : (022) 3952 4568 / 4040 3800
Research Team
Fundamental:
Sarabjit Kour Nangra VP-Research, Pharmaceutical sarabjit@angeltrade.com
Vaibhav Agrawal VP-Research, Banking vaibhav.agrawal@angeltrade.com
Vaishali Jajoo Automobile vaishali.jajoo@angeltrade.com
Shailesh Kanani Infrastructure, Real Estate shailesh.kanani@angeltrade.com
Anand Shah FMCG , Media anand.shah@angeltrade.com
Deepak Pareek Oil & Gas deepak.pareek@angeltrade.com
Puneet Bambha Capital Goods, Engineering puneet.bambha@angeltrade.com
Sushant Dalmia Pharmaceutical sushant.dalmia@angeltrade.com
Rupesh Sankhe Cement, Power rupeshd.sankhe@angeltrade.com
Param Desai Real Estate, Logistics, Shipping paramv.desai@angeltrade.com
Sageraj Bariya Fertiliser, Mid-cap sageraj.bariya@angeltrade.com
Viraj Nadkarni Retail, Hotels, Mid-cap virajm.nadkarni@angeltrade.com
Paresh Jain Metals & Mining pareshn.jain@angeltrade.com
Amit Rane Banking amitn.rane@angeltrade.com
Rahul Jain IT, Telecom rahul.j@angeltrade.com
Jai Sharda Mid-cap jai.sharda@angeltrade.com
Sharan Lillaney Mid-cap sharanb.lillaney@angeltrade.com
Amit Vora Research Associate (Oil & Gas) amit.vora@angeltrade.com
V Srinivasan Research Associate (Cement, Power) v.srinivasan@angeltrade.com
Aniruddha Mate Research Associate (Infra, Real Estate) aniruddha.mate@angeltrade.com
Mihir Salot Research Associate (Logistics, Shipping) mihirr.salot@angeltrade.com
Chitrangda Kapur Research Associate (FMCG, Media) chitrangdar.kapur@angeltrade.com
Vibha Salvi Research Associate (IT, Telecom) vibhas.salvi@angeltrade.com
Pooja Jain Research Associate (Metals & Mining) pooja.j@angeltrade.com
Technicals:
Shardul Kulkarni Sr. Technical Analyst shardul.kulkarni@angeltrade.com
Mileen Vasudeo Technical Analyst vasudeo.kamalakant@angeltrade.com
Derivatives:
Siddarth Bhamre Head - Derivatives siddarth.bhamre@angeltrade.com
Jaya Agarwal Derivative Analyst jaya.agarwal@angeltrade.com
Sandeep Patil Jr. Derivative Analyst patil.sandeep@angeltrade.com
Institutional Sales Team:
Mayuresh Joshi VP - Institutional Sales mayuresh.joshi@angeltrade.com
Abhimanyu Sofat AVP - Institutional Sales abhimanyu.sofat@angeltrade.com
Nitesh Jalan Sr. Manager niteshk.jalan@angeltrade.com
Pranav Modi Sr. Manager pranavs.modi@angeltrade.com
Sandeep Jangir Sr. Manager sandeepp.jangir@angeltrade.com
Ganesh Iyer Sr. Manager ganeshb.Iyer@angeltrade.com
Jay Harsora Sr. Dealer jayr.harsora@angeltrade.com
Meenakshi Chavan Dealer meenakshis.chavan@angeltrade.com
Gaurang Tisani Dealer gaurangp.tisani@angeltrade.com
Production Team:
Bharathi Shetty Research Editor bharathi.shetty@angeltrade.com
Dharmil Adhyaru Assistant Research Editor dharmil.adhyaru@angeltrade.com
Bharat Patil Production bharat.patil@angeltrade.com
Dilip Patel Production dilipm.patel@angeltrade.com
For Private Circulation Only.