Empfohlen

Empfohlen
Weitere ähnliche Inhalte
Was ist angesagt?
Was ist angesagt? (19)
Ähnlich wie TRB Poster Presentation
Ähnlich wie TRB Poster Presentation (20)
Kürzlich hochgeladen
Kürzlich hochgeladen (20)
TRB Poster Presentation
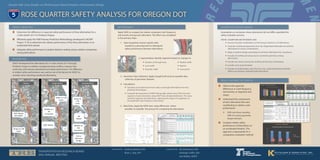
- 1. Apply ISATe to compare the relative computed crash frequency and severity among each alternative. The effort was completed in five primary steps: ROSE QUARTER SAFETY ANALYSIS FOR OREGON DOT ˆˆ Determine the difference in expected safety performance of three alternatives for a 2-mile stretch of I-5 in Portland, Oregon. ˆˆ Efficiently apply the HSM Freeway Prediction Methodology developed in NCHRP Project 17-45 to determine the relative performance of the three alternatives in an accelerated time period. ˆˆ Integrate safety performance in project decision-making using a relative comparison among alternatives. TRANSPORTATION RESEARCH BOARD 2016 ANNUAL MEETING Andrew Butsick, KAI Brian L. Ray, KAI Presented by: ˆˆ Observe the expected differences in crash frequency and severity on segments and ramps. ˆˆ Understand the components of each alternative that were contributing to relative crash performance. ff ISATe tool shows resulting CMFs for various geometric design elements. ˆˆ Compare relative safety performance of alternatives on an accelerated timeline. This approach is appropriate for a comparative evaluation method. ODOT developed three alternatives for a 2-mile section of I-5 through Portland, Oregon to address merging/weaving conflicts, improve lane continuity, and improve operational and safety performance. The difference in relative safety performance was used as one of the factors for ODOT to consider when selecting a preferred alternative. ASSUMPTIONS AND EFFICIENCIESASSUMPTIONS AND EFFICIENCIES BACKGROUNDBACKGROUND METHODOLOGYMETHODOLOGYPROJECT OBJECTIVESPROJECT OBJECTIVES RESULTS ALLOWED THE TEAM TO:RESULTS ALLOWED THE TEAM TO: SPECIFIC ASSUMPTIONS AND EFFICIENCIES USED: ff Assume shoulder rumblestrips on the freeway mainline in all alternatives. ff Using the northbound geometry from the Single Braid Alternative for all three alternatives to reduce computations. ff Apply consistent design assumptions to all three alternatives for consistency. ff Exclude all northbound ramps due to consistent geometry among alternatives. ff Exclude two ramps serving the southbound direction at Broadway. ff Exclude cross-ramp terminals. ff Exclude no-build analysis since the focus was understanding the potential differences between potential Build alternatives. 1. Data Acquisition: Extract specific data needed at a planning-level to distinguish safety performance between alternatives. 2. Segmentation: Identify segments based on changes in: ff Number of through lanes ff Lane width ff Shoulder width ff Median width ff Barriers ff Gore points 3. Geometric Data Collection: Apply Google Earth tools to expedite data collection of geometric features. 4. Calculations: ff Calculate curve information from radius and length information from the planning-level designs. ff Compute the proportion of AADT during high-volume hours (Phv) for each segment of each alternative using AADT hour-of-data distribution. The value varied by segment and alternative, capturing the impact of congestion on the predicted crash frequency and severity. 5. Data Entry: Apply the ISATe tool, using efficiencies where possible, to expedite the process for comparing the alternatives. Jim Bonneson, KAI Ashleigh Griffin, KAI Jon Makler, ODOT Supported by: Session 446: Case Studies on Performance-Based Analysis of Geometric Design Assumptions or exclusions where alternatives did not differ expedited the safety evaluation process.