Dammed or damned: the role of hydropower in the water and energy nexus

Andrea Castelletti
Andrea CastellettiAssociate Professor um Politecnico di Milano
Andrea Castelletti
Dipartimento di Elettronica, Informazione, e Bioingegneria, Politecnico di Milano, Milano, Italy
Institute of Environmental Engineering ETH-Z, Zurich
Dammed or damned: the role of hydropower in
the water and energy nexus
E4D	
  Winter	
  School	
  2005	
  
3-­‐23	
  January	
  2015	
  	
  
Son La Dam
Vietnam, 2012
Outline
•  What is water-energy nexus?
•  Hydropower and the nexus
•  An added challenge: global change
•  What can we do: the soft path approach
•  Case study
•  Conclusions
Outline
•  What is water-energy nexus?
•  Hydropower and the nexus
•  An added challenge: global change
•  What can we do: the soft path approach
•  Case study
•  Conclusions
The water and energy (watergy) nexus


water needs
energy
Water production, processing,
distribution, and end-use require
energy
•  Extraction
•  Treatment (drinking/waste)
•  Distribution
•  Use
energy needs
water
Energy production
requires water
•  Hydropower
•  Thermo electric cooling
•  Mineral Extraction and refining
•  Fuel production (fossil, non-
fossil, and biofuel)
•  Emission control
Source: adapted from WWAP, 2014
Energy needs water
Source: IEA, 2012
•  Energy production consumes 15% of water withdrawals
More than 580 billion m3 withdrawn every year (the average
annual discharge of the River Gange), of which 66 billion is
consumed)
Energy needs water
Source: IEA, 2012
•  Energy production consumes 15% of water withdrawals
More than 580 billion m3 withdrawn every year (the average
annual discharge of the River Gange), of which 66 billion is
consumed)
•  Thermal power plants (roughly 80% of global electricity
production) is responsible for:
•  43% of total water withdrawals in Europe,
•  50% in the US, and
•  more than 10% in China.
Energy needs water
Section II – Water for Energy
Figure 23. Flow Chart of Embedded Water in Energy
Extraction
Mining, drilling
(oil, natural gas)
Biomass
Wastewater
Collection,
treatment and
discharge or reuse
Resource
Raw Material
Refining
Coal, petrol,
natural gas,
uranium, biofuels
Renewable
Energy
Wind, solar,
hydroelectric, tidal
Water Source
(e.g., lakes, rivers,
aquifiers, sea)
Energy Recycling
Cogeneration,
desalination
Transport &
Transmission
Pipelines,
waterways
End Use
Industrial
Commercial
Residential
Public Utilities
Transportation
Energy
Generation
Discharge Water
Transportation Fuels, Natural Gas
Note: Water inputs and outputs may be in different water bodies.
1. Cooling Technologies
1.1 Once-Through (Open-Loop) Cooling
Once-through cooling uses an ample supply of water
(from an ocean, river, lake, cooling pond or canal) to
run through the system’s heat exchanger to condense
the low-pressure steam at the exhaust of the turbines
high-temperature events and competition for water
resources. This is particularly exacerbated by the fact
that electricity demand is disproportionately high in
water-scarce areas such as the Southwest. Moreover,
Source: adapted from Wilkinson, 2000
Energy needs water
country’s
mptive). In
wals are used
oberg, 2005).
fraction is
withdrawals
n 3.3.1).
implications
nd examine
s of primary
ve industries
quantities of
eams need to
That water
he water
uses. Water
mining,
environment.
and gas
water per
he water
nal fossil fuels
uels.
primary
35 (IEA,
gress of ‘clean’
he world’s
FIGURE
3.1 Water withdrawals and consumption vary for
fuel production
* The minimum is for primary recovery; the maximum is for
secondary recovery. ** The minimum is for in-situ production,
the maximum is for surface mining. *** Includes carbon dioxide
101
Sugar cane
ethanol
Corn
ethanol
Soybean
Rapeseed
Palm oil
Lignocellulosic
Refined oil
Coal-to-liquids
Gas-to-liquids
Refined oil
Refined oil
Shale
gas
Coal
Conventional
gas
Litres per toe
<1
Withdrawal
Consumption
102
103
104
105
106
107
biodiesel
biodiesel
biodiesel
ethanol****
(EOR)***
(oil sands)**
(conventional)*
‘Water use efficien
India’. ]
For power plants wi
cooling system used
required. The three
open-loop, closed-l
systems exist, but ar
once-through, cool
water, fresh and sali
all the water to the
evaporation (Figure
less water withdraw
use of cooling towe
much higher water
et al., 2011).
Dry cooling does no
use of fans that mov
in automobiles). Po
option is often the l
cooling is less effect
installations do ope
China, Morocco, So
because these system
have parasitic losses
estimated that cost
for air cooled conde
competitive in mos
2012).
The volatility of pric
fuels for thermal po* Includes trough, tower and Fresnel technologies using tower, dry
FIGURE
3.8 Water use for electricity generation by
cooling technology
Nuclear
Fossil steam
Gas CCGT
Nuclear
Fossil steam
Gas CCGT
Nuclear
Fossil steam (CCS)
Fossil steam
Coal IGCC (CCS)
Coal IGCC
Gas CCGT (CCS)
Gas CCGT
Gas CCGT
Geothermal**
Litres per MWh
Wind
Solar PV
CSP*
Other/noneDryCoolingtowerCooling
pond
Once-
through
10
1
<1 10
2
10
3
10
4
10
5
10
6
Withdrawal
Consumption
power plant, the less heat has to be dissipated, thus
less cooling is required (Delgado, 2012). Older power
Primary production Energy generation
Source: IEA, 2012
Water needs energy
•  Water related energy consumption is estimated to be about
2-3% of worldwide energy production
Water needs energy
•  California consumes approximately 20%of the state’s electricity,
and 30% of the state’s non-power plant natural gas
(source: California Energy Commission)
•  Running the hot water faucet for 5 minutes uses about the same
amount of energy as burning a 60-watt bulb for 14 hours
(source US-EPA)
•  Water related energy consumption is estimated to be about
2-3% of worldwide energy production
Water needs energy
Section I – Energy for Water
Figure 11. Water Flowchart (Highlighting Source)
Source
Lakes, reservoirs,
aquifers
Water
Treatment
Water
Distribution
Water Extraction
and Conveyance
Recycled Water
Distribution
Recycled Water
Treatment
End Use
Agriculture
Energy Production
Industrial
Commercial
Residential
Leaks
Wastewater
Treatment
Energy
Production
Biogas
Nitrous oxide
Net Loss
Discharge to
ocean
Net Loss
Evaporation
Transpiration
Wastewater
Collection
Leaks
Storm Water
Recycled Water
Leaks
Leaks
Discharge Water
Direct Use (Irrigation, energy production, industrial)
Raw
Water
Raw
Water
Potable
Water
Wastewater
Discharge Water
Biosolids
Biogas
Source: Adapted from Wilkinson, 2000
1. Water Conveyance
Research on the energy use of water conveyance systems, which are used to import water to these areas,
Source: adapted from Wilkinson, 2000
Water needs energy
such as reverse osmosis, require larger amounts
(1.5–3.5 kWh/m3
). Water for agriculture generally requires
little or no treatment, so energy requirements are mainly for
pumping (Section 6.4). Globally, the amount of energy used
for irrigation is directly related to the enormous quantities
of water required for irrigation and the irrigation methods
used.
(400%),
mestic use
be noted that
outh Africa;
Development;
e water’
GE). OECD
ricity
Livestock
2000 2050
World
Note: This diagram does not incorporate critical elements such as
the distance the water is transported or the level of efficiency, which
vary greatly from site to site.
Source: WBSCD (2009, fig. 5, p. 14, based on source cited therein).
FIGURE2.2 Amount of energy required to provide 1 m3
water safe for human consumption from
various water sources
STATUS, TRENDS AND CHALLENGES
Source: WBSCD, 2009
Amount of energy for 1 m3 of safe water
Water needs energy
64
(Lazarova et al., 2012).quality (and in the case of groundwater, its depth), and
Note: GWRS, groundwater replenishment system; WWTP, wastewater treatment plant.
Source: Lazarova et al. (2012, fig. 23.1, p. 316, adapted from sources cited therein). © IWA Publishing, reproduced with permission.
FIGURE
7.3 Typical energy footprint of the major steps in water cycle management with examples from different
treatment plants using specific technologies
5
4
3
2
1
0
2.5 kWh/m3
,
State Water
Project, CA
0.35 kWh/m3
,
Strass WWTP,
Austria
2.5
1.5
0.24 0.3 0.4
0.6
1.4
2.5 2.5
1.5
2.5
0.3
1.2
5.0
4.0
0.1 0.2 0.05
0.16
0.24 0.25 0.3
0.5
0.2
1.0
1.4 1.4
1.1
0.53 kWh/m3
,
GWRS, Orange
County, CA
2.9 kWh/m3
,
Desalination
Ashkelon,
Israel
Water
conveyance
Water
treatment
Water
distribution
Preliminary
treatment
Trickling
filters
Activated
sludge
Activated
sludge with
nitrification
Membrane
bioreactor
Water reuse Brackish
water
desalination
Seawater
desalination
Rainwater
harvesting
Energyconsumption(kWh/m3
)
THEMATIC FOCUSCHAPTER 7
Source: Lazarova et al. 2012
Typical energy footprint of the major steps in the water cycle
Implications and benefits of the nexus
•  Nexus implies that decisions made in one domain affect the
other and viceversa
Implications and benefits of the nexus
•  Nexus implies that decisions made in one domain affect the
other and viceversa
•  Policies that benefit one domain can pose significant risks
and detrimental effects to the other (e.g. biofuels) …
Implications and benefits of the nexus
•  Nexus implies that decisions made in one domain affect the
other and viceversa
•  Policies that benefit one domain can pose significant risks
and detrimental effects to the other (e.g. biofuels) …
•  … but can also generate co-benefit (e.g. energy attracts
greater political attention than water in many countries)
How serious is the water constraint?
VIETNAM/PHILIPPINES
In 2010 an El Nino
induced drought
caused electricity
shortages and rationing
for several months
How serious is the water constraint?
VIETNAM/PHILIPPINES
In 2010 an El Nino
induced drought
caused electricity
shortages and rationing
for several months
CHINA
In 2011 drought limited
generation along the
Yangtze river with
higher coal demand
and prices and
electricity rationing
How serious is the water constraint?
INDIA
In 2012 delayed monsoon
reduced hydropower and
raised energy demand for
irrigation causing 2 days
black out for 600 milion
people
VIETNAM/PHILIPPINES
In 2010 an El Nino
induced drought
caused electricity
shortages and rationing
for several months
CALIFORNIA
In 2012 and 2014 drought
caused significant
hydropower energy loss
due to reduced
snowpack and limited
precipitation
CHINA
In 2011 drought limited
generation along the
Yangtze river with
higher coal demand
and prices and
electricity rationing
US MID-WEST
In 2006 heat wave forced
substantial reduction of nuclear
energy production to control
temperature in the Missisipi river
To know more …
VOLUME 1
Report
Outline
•  What is water-energy nexus?
•  Hydropower and the nexus
•  An added challenge: global change
•  What can we do: the soft path approach
•  Case study
•  Conclusions
Hydropower and the nexus
Source: WWAP, 2014 and IEA, 2013
Trends in world electricity generation by energy source
0
4 000
8 000
12 000
16 000
20 000
24 000
1971 1975 1980 1985 1990 1995 2000 2005 2011
Fossil thermal Nuclear Hydro Other*
TWh
Oil 24.6%
Coal and peat
38.3%
Coal and peat
41.3%
Hydro 21.0% Hydro 15.8%
Nuclear 3.3%
Nuclear
11.7%
Natural gas
12.2%
Natural gas
21.9%
Oil 4.8%
Other* 0.6%
Geothermal
0.3%
Biofuels, waste
1.9%
Solar PV 0.3%
Wind 2.0%
and other sources
(a) 1971–2011
(b) 1973: 6 115 TWh total
(c) 2011: 22 126 TWh total
Note: Excludes pumped storage. *‘Other’includes geothermal, solar, wind, biofuels and waste, and heat. PV, solar photovoltaic.
INDICATOR
13
(a)
(b) 1973 (c) 2011
Trend in electricity generation by energy source
Role of dams and reservoirs
in out
time, spacetime, space
discharge
discharge
The first dam (2700 BC)
Sadd-el-Kafara, Egypt
2700-2600 BC
Source: http://www.hydriaproject.net, last visit 31.12.14
	
  
Dam development in the XIX and XX century
Source: B. Lehner- McGill University
Dam development in the XIX and XX century
Dams by purpose
Source: WWAP, with data from IEA (2013).
IEA (International Energy Agency). 2013. World Indicators. World energy statistics and balances database. Paris, OECD/IEA.
doi: 10.1787/data-00514-en (Accessed Dec 2013)
(a) Single purpose dams
(b) Multi purpose dams
Source: WWAP, with data from ICOLD (n.d.).
ICOLD (International Commission on Large Dams). n.d. General Synthesis. Paris, ICOLD.
http://www.icold-cigb.net/GB/World_register/general_synthesis.asp (Accessed Dec 2013)
INDICATOR
19
2000 2001 2002 2003 2004 2005 2006 2007 2011
World OECD Europe Africa Asia (excluding China)
China (PR of China and Hong Kong) India Russian Federation United States of America
2008 2009 2010
Use of dams by purpose
Hydropower 18.0%
Water supply
12.0%
Navigation and
fish farming 0.6%
Irrigation
50.0%
Other 5.0%
Recreation
5.0%
Flood control
10.0%
Irrigation
24.0%
Navigation and
fish farming 8.0%
Recreation
12.0%
Other 4.0%
Flood control
20.0%
Hydropower
16.0%
Water supply 17.0%
(a) (b)
Source: WWAP, 2014 and ICOLD, 2014
single purpose multi purpose
Dams by purpose and country
Source: Lehner, 2011
Capacity chart of hydropower
HYPERBOLE
Annual Conference, September 30 2014 8
Capacity Chart of Hydroelectric Power Station
ρ= ×hP Q gH
Source: Avelan, 2014
DISCHARGE
HYDRAULICHEAD
Capacity chart of hydropower
HYPERBOLE
Annual Conference, September 30 2014 8
Capacity Chart of Hydroelectric Power Station
ρ= ×hP Q gH
Source: Avelan, 2014
DISCHARGE
HYDRAULICHEAD
Capacity chart of hydropower
HYPERBOLE
Annual Conference, September 30 2014 8
Capacity Chart of Hydroelectric Power Station
ρ= ×hP Q gH
Source: Avelan, 2014
DISCHARGE
HYDRAULICHEAD
Largest hydropower plants (the first 25)
2
1
2
1
1
4
4
11
canada
U.S.
venezuela
paraguay
brazil
pakistan
russia
china
Hydropower impact
Is HP generating conflicts with other water uses and
ecosystem services?
As a non-consumptive water use HP is not removing water
from the system …
… but for evaporation or seepage
So, should we consider HP a clean, green and fair energy
production source?
Impacted sectors
People
Resettlement
HYDROPOWER
Environment
Water Quality
Sediment
balance
GHG emission Competing uses
•  Agriculture
•  Water supply
•  Energy (cooling)
•  Recreation
•  ….
Navigation
Inter-sector conflicts: the Colorado river
COLORADO RIVER, US-Mexico
Salt intrusion (violet)
Glen Canyon Dam
•  Hydropower production ( 6 large dams)
•  Agriculture (Imperial Valley)
•  Water supply
Inter-sector conflicts: the Colorado river
COLORADO RIVER, US-Mexico
Salt intrusion (violet)
Glen Canyon Dam
•  Hydropower production ( 6 large dams)
•  Agriculture (Imperial Valley)
•  Water supply
Inter-sector conflicts: the Red River basin, Vietnam
Hanoi
HoaBinh
TaBu
LaiChau
TamDuong
NamGiang
MuongTe
VuQuang
YenBai
BaoLacHaGiang
BacMe
VIETNAM
CHINA
LAOS
CAMBODIA
THAILAND
Da
Thao Lo
Integrated Management of Red-Thai Binh Rivers System (IMRR) funded by the Italian
Ministry of Foreign Affairs http://www.imrr.info/
Inter-sector conflicts: the Red River basin, Vietnam
Basin wide, anthropogenic changes over the last ~ 60 years
1960 1970 1980 1990 2000 2010 Future
LAND USE CHANGE RESERVOIR CONSTRUCTION SEDIMENT MINING
Inter-sector conflicts: the Red River basin, Vietnam
Focus on 3 stations
Red	
  River:	
  	
  
Son	
  Tay	
  
Ha	
  Noi	
  	
  
Duong	
  River:	
  	
  
Thuong	
  Cat	
  
Inter-sector conflicts: the Red River basin, Vietnam
Morphologic changes aggravate water scarcity & endanger vital
infrastructure
Inter-sector conflicts: the Red River basin, Vietnam
Irriga@on	
  
deficits	
  	
   Saltwater	
  
intrusion	
  
Before Now
Making things trickier: most rivers are transboundary …
Trans-national river basins collect 60% of the world freshwater.
… and power-asymmetric
Outline
•  What is water-energy nexus?
•  Hydropower and the nexus
•  An added challenge: global change
•  What can we do: the soft path approach
•  Case study
•  Conclusions
Earth is warming
source: IPCC, 2007
Climate is changing:
extremes will be more frequent
source: IPCC, 2007
Climate is changing and so does the water cycle:
natural availability is declining
Change in water natural availability, not considering production
technology, access to water, etc
2050 vs [1961-90]
source: Arnell, 2004
Evidences from the future
source: National GeographicRivers run dry (Colorado)
Forzieri et al. , HESS, 107(25), 2014.
Climate is changing and so does the water cycle:
wetter in the north, drier in the south
40% reduction in minimum stream flow by the 2080s in the Iberian Peninsula, Italy
and the Balkan Region
Society is changing as well:
+ people
source: UNEP, 2008
Society is changing as well:
+ people ++ energy demand
Global energy demand is expected to grow by more than one-third over the period to
2035, with China, India and the Middle Eastern countries accounting for about 60% of the
increase.
Society is changing as well:
+ people ++ energy demand ++ water demand
Change in water withdrawal and consumption by 2025:
more extraction less consumptive
source: UNESCO, 2001
Society is changing as well:
+ people ++ energy demand ++ water demand
Shift to alternate energy will require more water + load balancing
e.g.
•  1st generation biofuel consume 20 times as much water for mile traveled compare to
gasoline
•  All-electric vehicles will place added strains on utilities: 1 mile three time water than with
gasoline power (King and Webber, 2008)
source: IEA, 2014
OECD/IEA,2012
newly built nuclear power plants that use once-through cooling (for instance, some that
are constructed inland in China), which expands water withdrawals for nuclear generators
by a third. Consumption of water in the world’s power sector rises by almost 40%, boosted
by increased use of wet tower cooling in thermal capacity. Increasing shares of gas-fired
and renewable generation play a significant role in constraining additional water use in
many regions, as global electricity generation grows by some 0% over 2010-2035, much
more than water withdrawal or consumption by the sector.
Figure 17.7 ⊳ Global water use for energy production in the New Policies
Scenario by fuel and power generation type
0
100
200
300
400
500
600
700
800
2010 2020 2035
bcm
Withdrawal
0
20
40
60
80
100
120
140
2010 2020 2035
bcm
ConsumpƟon
Biofuels
Fossil fuels
Bioenergy
Nuclear
Oil
Gas
Coal
Fuels:
Power:
Energy-related water use rises as a direct consequence of steeply increasing global biofuels
supply, which triples in the New Policies Scenario on government policies that mandate
the use of biofuels. Water withdrawals for biofuels increase in line with global supply, from
25 bcm to 110 bcm over 2010-2035. owever, consumption increases from 12 bcm to
almost 50 bcm during that time, equalling the water consumption for power generation by
the end of the Outlook period. These higher water requirements for biofuels production
stem from the irrigation needs for feedstock crops for ethanol and biodiesel – primarily
Global water use for energy by fuel and power generation source
Society is changing as well:
+ people ++ energy demand ++ water demand
Load balancing from renewable energy production
Pumped storage is the largest-capacity form of grid energy storage
available in the world (99% of bulk storage capacity worldwide,
representing around 127,000 MW).
Energy efficiency varies in practice between 70% and 80%.
The EU has 38.3 GW net capacity (36.8% of world capacity) out of a total of 140 GW of
hydropower.
Japan has 25.5 GW net capacity (24.5% of world capacity).
Global change is shrinking the pie
global
change
Outline
•  What is water-energy nexus?
•  Hydropower and the nexus
•  An added challenge: global change
•  What can we do: the soft path approach
•  Case study
•  Conclusions
React/adapt to change: re-expand the pie
global
change
Accessible freshwater is limited
Salt Water
98%
Fresh Water
2%
Worldwide distribution:
98% salt water
2% fresh water
Surface waters (lake and rivers)
are just 0.01% of the total
freshwater
Groundwater
12%
Rivers & Lakes
0.01%
Ice
87%
What can we do? We should adapt, of course
ADAPTATION MEASURE: Adjustment in natural or human systems in
response to actual or expected climatic stimuli or their effects, which
moderates harm or exploits beneficial opportunities.
Source: European Climate Adaptation Platform - EC
source: googling“adaptation program” – images
Supply-side adaptation: investing in centralized, large-scale
physical infrastructures, and centralized water management
systems
source: WRI 2003
The 20th century approach
Water supply expansion is constrained (PEAK WATER)
P.H. Gleick & M. Palanniappan, PNAS, 107(25), 2010.
des of projections
s that planners consis-
y assumed continued,
ven accelerated, expo-
al growth in total water
nd (Fig. 3). Some pro-
ons were that water
rawals would have to
and even quadruple in
ng years, requiring ad-
nal dams and diver-
on previously un-
d water resources in
te or pristine areas
declared off-limits to
lopment. Proposals
been made to flood the
d Canyon, dam the
zon, and divert Siberi-
nd Alaskan rivers to
ern population centers.
stead, as Figs. 3 and 4
, total water withdraw-
egan to stabilize in the
s and 1980s, and
ruction activities be-
o slow as the unquan-
but real environmental and social
of dams began to be recognized. More
tly, the economic costs of the
ional hard path have also risen to
s that society now seems unwilling
able to bear. The most cited estimate
he cost of meeting future
A New Approach for Water
What is required is a “soft path,” one that
continues to rely on carefully planned and
managed centralized infrastructure but
complements it with small-scale decentral-
ized facilities. The soft path for water
strives to improve the pro-
ductivity of water use rather
than seek endless sources of
new supply. It delivers wa-
ter services and qualities
matched to users’ needs,
rather than just delivering
quantities of water. It ap-
plies economic tools such as
markets and pricing, but
with the goal of encouraging
efficient use, equitable dis-
tribution of the resource,
and sustainable system op-
eration over time. And it in-
cludes local communities in
decisions about water man-
agement, allocation, and use
(21–23). As Lovins noted for the
energy industry, the industrial
dynamics of this approach are
very different, the technical risks
are smaller, and the dollars
risked far fewer than those of the
hard path (24).
Rethinking water use
means reevaluating the objec-
tives of using water. Hard-path planners erro-
neously equate the idea of using less water, or
failing to use much more water, with a loss of
well-being. This is a fallacy. Soft-path planners
believe that people want to satisfy demands for
goods and services, such as food, fiber, and
Fig. 4. Construction of large reservoirs worldwide in the 20th century. Average
numbers of reservoirs with volume greater than 0.1 km3
built by decade,
through the late 1990s, are normalized to dams per year for different periods.
Note that there was a peak in construction activities in the middle of the 20th
century, tapering off toward the end of the century. The period 1991 to 1998
is not a complete decade; note also that the period 1901 to 1950 is half a
century. “Other regions” include Latin America, Africa, and Oceania (46).
source: Gleick, 2003
Soft is wiser: the “soft path”
Supply and demand integrated management: improving
overall productivity of water by making water management
more efficient rather than seeking new sources of supply
P.H. Gleick, Nature, 418, 373, 2002.
P.H. Gleick, Science, 302, 1524-1528, 2003.
by
•  EXPLORE THE TRADE-OFFs
•  Distributed and coordinated management
•  Better informed decisions (pervasive monitoring)
•  Smart economics (option contracts, ensurances)
•  Participatory decision-making
•  ….
Outline
•  What is water-energy nexus?
•  Hydropower and the nexus
•  An added challenge: global change
•  What can we do: the soft path approach
•  Case study
•  Conclusions
An example: Lake Como
Reservoirs
Lake Como 247 Mm3
Alpine hydropowers 545 Mm3
Catchment area
Lake Como 4500 km2
Stakeholders
Hydropower producers:
25% national hydropower production
Farmers:
5 districts for a total area of 1400 km2
Hydropower reservoir
Power plant
Como city
Penstock
River Adda
River Adda
Legend
Lario
Lario catchment
River
Irrigated area
0 10 20 30 40 505
Kilometers
DISTRILAKE enhancing water resources management
efficiency and sustainability via integration and coordination
Hydropower reservoir
Power plant
Como city
Penstock
River Adda
River Adda
Legend
Lario
Lario catchment
River
Irrigated area
0 10 20 30 40 505
Kilometers
Virtual and physical storages
SNOW	
  PACK	
  
HYDROPOWER	
  
RESERVOIRS	
  
LAKE	
  COMO	
  
GROUNDWATER	
  
GREEN	
  WATER	
  
DISTRILAKE alpine hydro – lake como
Hydropower reservoir
Power plant
Como city
Penstock
River Adda
River Adda
Legend
Lario
Lario catchment
River
Irrigated area
0 10 20 30 40 505
Kilometers
Virtual and physical storages
SNOW	
  PACK	
  
HYDROPOWER	
  
RESERVOIRS	
  
LAKE	
  COMO	
  
GROUNDWATER	
  
GREEN	
  WATER	
  
Anghileri, D. et al. Journal of Water Resources Planning and
Management, 139(5), 492–500, 2013
R2	
  
R1	
  
DISTRILAKE alpine hydro – lake como
Hydropower reservoir
Power plant
Como city
Penstock
River Adda
River Adda
Legend
Lario
Lario catchment
River
Irrigated area
0 10 20 30 40 505
Kilometers
R2	
  
R1	
  
J F M A M J J A S O N D
0
10
20
30
40
Flow[m
3
/s]
Inflow Release
J F M A M J J A S O N D
50
100
150
200
250
Flow[m
3
/s]
Time [days]
(a)
(b)
FIG. 2. Historical inflow (dashed) and release (solid) of the hydropower reservoir R1
(a) and lake Como (b) (14-days moving median over the period 1996-2005).
22
R1
J F M A M J J A S O N D
50
100
150
200
250
Demand[m
3
/s]
(a)
J F M A M J J A S O N D
0
500
1000
1500
2000
2500
Price[euro/MW]
(b)
J F M A M J J A S O N D
−20’000
−10’000
0
10’000
20’000
30’000
Revenue[euro/day]
(c)
Time [days]
FIG. 5. (a): Yearly pattern of water demand. (b): Yearly pattern of the energy price
(each colour band represents the energy price in the j-th most profitable hour). (c):
Di↵erence in daily hydropower revenue (14-days moving average over years 1996-2005)
between centralized policy C6 and uncoordinated UC.
energy price
J F M A M J J A S O N D
50
100
150
200
250
Demand[m
3
/s]
(a)
2000
2500
]
(b)
water demand
J F M A M J J A S O N D
0
10
20
30
40
Flow[m
3
/s]
Inflow Release
J F M A M J J A S O N D
50
100
150
200
250
Flow[m
3
/s]
Time [days]
(a)
(b)
FIG. 2. Historical inflow (dashed) and release (solid) of the hydropower reservoir R1
(a) and lake Como (b) (14-days moving median over the period 1996-2005).
Lake Como
DISTRILAKE alpine hydro – lake como
Anghileri, D. et al. Journal of Water Resources Planning and
Management, 139(5), 492–500, 2013
Lake
Como
Lake
Como
r
s1
s2
s3
u1
u2
u3
R2
R1
R2
R1
hydropower plant
irrigated area
H2
H1
H3
H2
H1
H3
q3
q2
q1
q3
q2
q1
s1
s2
s3
u2
u3
u1
m1
m2
m
3
(•)
m(•)(•)
(•)
UNCOORDINATED CENTRALIZED
(a) (b)
r
FIG. 3. The model scheme under uncoordinated (left) and centralized (right) man-
agement.
23
800 900 1000 1100 1200 1300 1400 1500 1600
460’000
470’000
480’000
490’000
Irrigation deficit [m
3
/s]
2
Hydropowerrevenue[euro/day]
H
ab
C6
C5
C4
C3
C2
C1
CO2 CO1 UCUC
UN-COORDINATED
Lake
Como
Lake
Como
r
s1
s2
s3
u1
u2
u3
R2
R1
R2
R1
hydropower plant
irrigated area
H2
H1
H3
H2
H1
H3
q3
q2
q1
q3
q2
q1
s1
s2
s3
u2
u3
u1
m1
m2
m
3
(•)
m(•)(•)
(•)
UNCOORDINATED CENTRALIZED
(a) (b)
r
FIG. 3. The model scheme under uncoordinated (left) and centralized (right) man-
agement.
23
800 900 1000 1100 1200 1300 1400 1500 1600
460’000
470’000
480’000
490’000
Irrigation deficit [m
3
/s]
2
Hydropowerrevenue[euro/day]
H
ab
C6
C5
C4
C3
C2
C1
CO2 CO1 UCUC
UN-COORDINATED
Lake
Como
r
s1
s2
s3
u1
u2
u3
R2
R1
R2
R1
hydropower plant
irrigated area
H2
H1
H3
H2
H1
H3
q3
q2
q1
q3
q2
s2
s3
u2
u3
m
3
m(•)
(•)
NATED CENTRALIZED
(b)
cheme under uncoordinated (left) and centralized (right) man-
CENTRALIZED (SOCIAL PLANNER)
Lake
Como
Lake
Como
r
s1
s2
s3
u1
u2
u3
R2
R1
R2
R1
hydropower plant
irrigated area
H2
H1
H3
H2
H1
H3
q3
q2
q1
q3
q2
q1
s1
s2
s3
u2
u3
u1
m1
m2
m
3
(•)
m(•)(•)
(•)
UNCOORDINATED CENTRALIZED
(a) (b)
r
FIG. 3. The model scheme under uncoordinated (left) and centralized (right) man-
agement.
23
800 900 1000 1100 1200 1300 1400 1500 1600
460’000
470’000
480’000
490’000
Irrigation deficit [m
3
/s]
2
Hydropowerrevenue[euro/day]
H
ab
C6
C5
C4
C3
C2
C1
CO2 CO1 UCC6
C5
C4
C3
C2
C1
UC
UN-COORDINATED
Lake
Como
r
s1
s2
s3
u1
u2
u3
R2
R1
R2
R1
hydropower plant
irrigated area
H2
H1
H3
H2
H1
H3
q3
q2
q1
q3
q2
s2
s3
u2
u3
m
3
m(•)
(•)
NATED CENTRALIZED
(b)
cheme under uncoordinated (left) and centralized (right) man-
CENTRALIZED (SOCIAL PLANNER)
?
Lake
Como
R2
R1
hydropower plant
irrigated area
H2
H1
H3
q3
q2
q1
s1
s2
s3
u2
u3
u1
m1
m2
m
3
(•)
(•)
(•)
COORDINATED
r
coordination
mechanism
FIG. 4. The model scheme under coordinated management.
24
800 900 1000 1100 1200 1300 1400 1500 1600
460’000
470’000
480’000
490’000
Irrigation deficit [m
3
/s]
2
Hydropowerrevenue[euro/day]
H
ab
C6
C5
C4
C3
C2
C1
CO2 CO1 UCC6
C5
C4
C3
C2
C1
UC
COORDINATED
Lake
Como
r
s1
s2
s3
u1
u2
u3
R2
R1
R2
R1
hydropower plant
irrigated area
H2
H1
H3
H2
H1
H3
q3
q2
q1
q3
q2
s2
s3
u2
u3
m
3
m(•)
(•)
NATED CENTRALIZED
(b)
cheme under uncoordinated (left) and centralized (right) man-
CENTRALIZED (SOCIAL PLANNER)
0 0.5 1 1.5 2 2.5 3 3.5
x 10
8
0
2
4
6
8
10
12
Lake reservoir [m3
]
Releasedecision(R1)[m
3
/s]
C6
UC
Constraint
FIG. 7. Hydropower release decision of reservoir R1 as a function of lake storage
under centralized policy C6 (red circles) and uncoordinated policy UC (blue points).
?
DISTRILAKE enhancing water resources management
efficiency and sustainability via integration and coordination
Hydropower reservoir
Power plant
Como city
Penstock
River Adda
River Adda
Legend
Lario
Lario catchment
River
Irrigated area
0 10 20 30 40 505
Kilometers
Virtual and physical storages
SNOW	
  PACK	
  
HYDROPOWER	
  
RESERVOIRS	
  
LAKE	
  COMO	
  
GROUNDWATER	
  
GREEN	
  WATER	
  
DISTRILAKE lake como - greenwater
Hydropower reservoir
Power plant
Como city
Penstock
River Adda
River Adda
Legend
Lario
Lario catchment
River
Irrigated area
0 10 20 30 40 505
Kilometers
Virtual and physical storages
SNOW	
  PACK	
  
HYDROPOWER	
  
RESERVOIRS	
  
LAKE	
  COMO	
  
GROUNDWATER	
  
GREEN	
  WATER	
  
Galelli. et al. Environmental Modelling and Software,
25, 209–222, 2010
Hydropower reservoir
Power plant
Como city
Penstock
River Adda
River Adda
Legend
Lario
Lario catchment
River
Irrigated area
0 10 20 30 40 505
Kilometers
J F M A M J J A S O N D
50
100
150
200
250
Demand[m
3
/s]
(a)
J F M A M J J A S O N D
0
500
1000
1500
2000
2500
Price[euro/MW]
(b)
J F M A M J J A S O N D
−20’000
−10’000
0
10’000
20’000
30’000
Revenue[euro/day]
(c)
Time [days]
water demand
J F M A M J J A S O N D
0
10
20
30
40
Flow[m
3
/s]
Inflow Release
J F M A M J J A S O N D
50
100
150
200
250
Flow[m
3
/s]
Time [days]
(a)
(b)
FIG. 2. Historical inflow (dashed) and release (solid) of the hydropower reservoir R1
(a) and lake Como (b) (14-days moving median over the period 1996-2005).
22
Lake Como
water demand = Σ water use
concessions
[ - Irrigation
- Industrial water supply
- Run-off river hydro ]
Is that the actual water demand?
DISTRILAKE lake como - greenwater
Galelli. et al. Environmental Modelling and Software,
25, 209–222, 2010
DISTRILAKE lake como - greenwater
green water resource
blue water resource
blue water resource
blue water flow
saturated
zone
unsaturated
zone
green water flow
rain
• BLUE WATER: surface and ground water
• GREEN WATER: water in the unsaturated root zone
Falkenmark, M. and Rockström, Journal of Water Resources
Planning and Management, 132(3), 129–132, 2006
Galelli. et al. Environmental Modelling and Software,
25, 209–222, 2010
Author's personal copy
0 200 400 600 800 1000 1200 1400
0
200
400
600
800
1000
1200
1400
J
i
(m
3
/s)
2
Jf
(m2
/g/a)
Naive OCP Frontier
Reduced OCP Frontier
Naive OCP Utopia point
Reduced OCP Utopia point
historical management
C
B
B’
C’
AU’U
U
U’
h
h
Fig. 7. Image of the Pareto-Frontiers of the Naive (dashed line) and Reduced (solid line) OCP obtained by simulating the Lake Como system over the period 1993–20
historical performance, while points U’ and U are the Utopia points of the Naive and Reduced OCP respectively. The meaning of the labelled points is explained
S. Galelli, R. Soncini-Sessa / Environmental Modelling & Software 25 (2010) 209–222
Hydropower reservoir
Power plant
Como city
Penstock
River Adda
River Adda
Legend
Lario
Lario catchment
River
Irrigated area
0 10 20 30 40 505
Kilometers
J F M A M J J A S O N D
50
100
150
200
250
Demand[m
3
/s]
(a)
J F M A M J J A S O N D
0
500
1000
1500
2000
2500
Price[euro/MW]
(b)
J F M A M J J A S O N D
−20’000
−10’000
0
10’000
20’000
30’000
Revenue[euro/day]
(c)
Time [days]
water demand
J F M A M J J A S O N D
0
10
20
30
40
Flow[m
3
/s]
Inflow Release
J F M A M J J A S O N D
50
100
150
200
250
Flow[m
3
/s]
Time [days]
(a)
(b)
FIG. 2. Historical inflow (dashed) and release (solid) of the hydropower reservoir R1
(a) and lake Como (b) (14-days moving median over the period 1996-2005).
22
Lake Como
Blue water
Blue & Green
water
irrigation deficit
floodedarea
DISTRILAKE lake como - greenwater
saving 75 Mm3 per year
= ¼ of lake Como
Galelli. et al. Environmental Modelling and Software,
25, 209–222, 2010
DISTRILAKE lake como - greenwater
Galelli. et al. Environmental Modelling and Software,
25, 209–222, 2010
Blue water
DISTRILAKE lake como - greenwater
Galelli. et al. Environmental Modelling and Software,
25, 209–222, 2010
Blue water
DISTRILAKE lake como - greenwater
Galelli. et al. Environmental Modelling and Software,
25, 209–222, 2010
Blue water
DISTRILAKE lake como - greenwater
Galelli. et al. Environmental Modelling and Software,
25, 209–222, 2010
Blue water
Blue & green water
DISTRILAKE lake como - greenwater
Galelli. et al. Environmental Modelling and Software,
25, 209–222, 2010
Blue water
Blue & green water
Hydropower reservoir
Power plant
Como city
Penstock
River Adda
River Adda
Legend
Lario
Lario catchment
River
Irrigated area
0 10 20 30 40 505
Kilometers
DISTRILAKE lake como - greenwater
Galelli. et al. Environmental Modelling and Software,
25, 209–222, 2010
Network upgrade to supply on demand
FlumeGateTM by RUBICON WATER
Hydropower reservoir
Power plant
Como city
Penstock
River Adda
River Adda
Legend
Lario
Lario catchment
River
Irrigated area
0 10 20 30 40 505
Kilometers
Downscaling
Catchment
model
Water system
model
Performance
indicators
Management
model
Regional
climate
scenario
Local
climate
scenario
Reservoir
inflow
scenario
Operation
policy
Impacts on
water
resources
Anghileri, D. et al. Hydrology and Earth System
Sciences, 15(6), 2025–2038, 2011
Uncertain futures and decision making
Scenario-based approach
possible future technological development and
socio-economic development of the antropic
forcings (IPCC 2007)
Scenario-based approach
from Le Treut et al., 2007 from www.wmo.int
Scenario-based approach
from www.wmo.int
from100 km to 25 km and higher resolution
Scenario-based approach
HBV model [Bergstrom, 1976]
from the atmosphere to local hydrological cycle
Scenario-based approach
Wilby & Dessai, Weather, 65(7), 180-185, 2010
500 1000 1500 2000 2500 3000 3500 4000 4500 5000
−5
−4.5
−4
−3.5
−3
−2.5
−2
x 10
5
Irrigation deficit (m
3
/s)
2
−Hydropowerrevenue(euro)
* Future optimal
management policies
The impact of CC on Lake Como
Adaptation is better than myopic
500 1000 1500 2000 2500 3000 3500 4000 4500 5000
−5
−4.5
−4
−3.5
−3
−2.5
−2
x 10
5
Irrigation deficit (m
3
/s)
2
−Hydropowerrevenue(euro)
* Future optimal
management policies
Future is non stationary
500 1000 1500 2000 2500 3000 3500 4000 4500 5000
−5
−4.5
−4
−3.5
−3
−2.5
−2
x 10
5
Irrigation deficit (m3
/s)2
−Hydropowerrevenue(euro)
2071-­‐2080	


2081-­‐2090	


2091-­‐2100	


Future is deeply uncertain
500 1000 1500 2000 2500 3000 3500 4000 4500 5000
−5
−4.5
−4
−3.5
−3
−2.5
−2
x 10
5
Irrigation deficit (m
3
/s)
2
−Hydropowerrevenue(euro)
HadRM3H
REMO
HIRHAM
RCAO
CHRM
PROMES
CLM
Uncertainty from different
RCM projections
Conclusions
•  Present day water and energy systems are tightly intertwined
•  Hydropower has a role in the nexus
•  Global change is challenging future hydropower operation
•  Soft adaptation measures should be first considered to better
exploit the potential of existing infrastructures
•  Designing and implementing those measures require a trully
mulidisciplinary approach
•  Sationarity is dead and the future uncertain: implications for
planning
That’s all
1 von 100

Recomendados

Big Spring Texas Direct Potable Reuse project von
Big Spring Texas Direct Potable Reuse projectBig Spring Texas Direct Potable Reuse project
Big Spring Texas Direct Potable Reuse projectTerrance (Terry) Keep
2.2K views27 Folien
Florida DEP Indirect Potable & Direct Potable Reuse presentation 10 sep12 von
Florida DEP Indirect Potable & Direct Potable Reuse presentation 10 sep12Florida DEP Indirect Potable & Direct Potable Reuse presentation 10 sep12
Florida DEP Indirect Potable & Direct Potable Reuse presentation 10 sep12Terrance (Terry) Keep
1.2K views55 Folien
Performance Optimization of an Integrated Solar Desalination System von
Performance Optimization of an Integrated Solar Desalination SystemPerformance Optimization of an Integrated Solar Desalination System
Performance Optimization of an Integrated Solar Desalination SystemIRJET Journal
25 views7 Folien
Ground water distillation by basin type solar still for different basin water... von
Ground water distillation by basin type solar still for different basin water...Ground water distillation by basin type solar still for different basin water...
Ground water distillation by basin type solar still for different basin water...IJERA Editor
234 views8 Folien
Ensuring a Safe, Sustainable Future Water Supply--Case Study von
Ensuring a Safe, Sustainable Future Water Supply--Case StudyEnsuring a Safe, Sustainable Future Water Supply--Case Study
Ensuring a Safe, Sustainable Future Water Supply--Case StudyTeresa Long
584 views7 Folien
Thermal modelling of solar still and different desalination von
Thermal modelling of solar still and different desalinationThermal modelling of solar still and different desalination
Thermal modelling of solar still and different desalinationShantam Warkad
59 views14 Folien

Más contenido relacionado

Was ist angesagt?

20120140505015 von
2012014050501520120140505015
20120140505015IAEME Publication
239 views16 Folien
IRJET- Desalination of Salt Water using Solar Energy von
IRJET- Desalination of Salt Water using Solar EnergyIRJET- Desalination of Salt Water using Solar Energy
IRJET- Desalination of Salt Water using Solar EnergyIRJET Journal
112 views4 Folien
Solar desalination-vertence von
Solar desalination-vertenceSolar desalination-vertence
Solar desalination-vertencevertencetechnology
92 views5 Folien
Caroline Plouff Top Ten Water Conservation Tips for Farmers von
Caroline Plouff  Top Ten Water Conservation Tips for FarmersCaroline Plouff  Top Ten Water Conservation Tips for Farmers
Caroline Plouff Top Ten Water Conservation Tips for FarmersCaroline Plouff
1.4K views11 Folien
Improving the feasibility of on site wastewater treatment systems in areas of... von
Improving the feasibility of on site wastewater treatment systems in areas of...Improving the feasibility of on site wastewater treatment systems in areas of...
Improving the feasibility of on site wastewater treatment systems in areas of...Arne Backlund
6 views10 Folien
Day 2 Innovative Programs von
Day 2  Innovative ProgramsDay 2  Innovative Programs
Day 2 Innovative ProgramsGreg Gearheart
606 views31 Folien

Was ist angesagt?(20)

IRJET- Desalination of Salt Water using Solar Energy von IRJET Journal
IRJET- Desalination of Salt Water using Solar EnergyIRJET- Desalination of Salt Water using Solar Energy
IRJET- Desalination of Salt Water using Solar Energy
IRJET Journal112 views
Caroline Plouff Top Ten Water Conservation Tips for Farmers von Caroline Plouff
Caroline Plouff  Top Ten Water Conservation Tips for FarmersCaroline Plouff  Top Ten Water Conservation Tips for Farmers
Caroline Plouff Top Ten Water Conservation Tips for Farmers
Caroline Plouff1.4K views
Improving the feasibility of on site wastewater treatment systems in areas of... von Arne Backlund
Improving the feasibility of on site wastewater treatment systems in areas of...Improving the feasibility of on site wastewater treatment systems in areas of...
Improving the feasibility of on site wastewater treatment systems in areas of...
Arne Backlund6 views
Water Management at Rainbow Drive: In Buildotech von biomeshubha
Water Management at Rainbow Drive: In BuildotechWater Management at Rainbow Drive: In Buildotech
Water Management at Rainbow Drive: In Buildotech
biomeshubha397 views
Desalination: Solution to Water Scarcity von Sahla Ibrahim
Desalination: Solution to Water ScarcityDesalination: Solution to Water Scarcity
Desalination: Solution to Water Scarcity
Sahla Ibrahim454 views
Design of a Partitioned Aquaculture System von Kayla Kernich
Design of a Partitioned Aquaculture SystemDesign of a Partitioned Aquaculture System
Design of a Partitioned Aquaculture System
Kayla Kernich1.2K views
Annual report 2016 waternet innovation von Alice Fermont
Annual report 2016 waternet innovationAnnual report 2016 waternet innovation
Annual report 2016 waternet innovation
Alice Fermont417 views
2 Ways Your Facility Can Overcome Water Scarcity von HDR
2 Ways Your Facility Can Overcome Water Scarcity2 Ways Your Facility Can Overcome Water Scarcity
2 Ways Your Facility Can Overcome Water Scarcity
HDR 792 views
Ankit labh, SODIS von Ankit Labh
Ankit labh, SODISAnkit labh, SODIS
Ankit labh, SODIS
Ankit Labh250 views

Destacado

Thinking about a Tsunami von
Thinking about a TsunamiThinking about a Tsunami
Thinking about a TsunamiSimon Jones
4K views45 Folien
Pressure buffering hydropower introduction, Bogorodsky Power Co. von
Pressure buffering hydropower introduction, Bogorodsky Power Co.Pressure buffering hydropower introduction, Bogorodsky Power Co.
Pressure buffering hydropower introduction, Bogorodsky Power Co.Andrew Bogorodsky
3.1K views22 Folien
IHA 2013 World Congress: IHA: Introduction to the Hydropower Sustainability A... von
IHA 2013 World Congress: IHA: Introduction to the Hydropower Sustainability A...IHA 2013 World Congress: IHA: Introduction to the Hydropower Sustainability A...
IHA 2013 World Congress: IHA: Introduction to the Hydropower Sustainability A...International Hydropower Association
2.6K views26 Folien
Solar & hydroelectric energy von
Solar & hydroelectric energySolar & hydroelectric energy
Solar & hydroelectric energy2tgd
479 views12 Folien
Atmospheric general circulation in an idealized dry GCM without eddy-eddy int... von
Atmospheric general circulation in an idealized dry GCM without eddy-eddy int...Atmospheric general circulation in an idealized dry GCM without eddy-eddy int...
Atmospheric general circulation in an idealized dry GCM without eddy-eddy int...Farid Ait-Chaalal, PhD
911 views35 Folien
Accident At Russias Biggest Hydroelectric Plant von
Accident At Russias Biggest Hydroelectric PlantAccident At Russias Biggest Hydroelectric Plant
Accident At Russias Biggest Hydroelectric PlantWinson Ng
620 views57 Folien

Destacado(20)

Thinking about a Tsunami von Simon Jones
Thinking about a TsunamiThinking about a Tsunami
Thinking about a Tsunami
Simon Jones4K views
Pressure buffering hydropower introduction, Bogorodsky Power Co. von Andrew Bogorodsky
Pressure buffering hydropower introduction, Bogorodsky Power Co.Pressure buffering hydropower introduction, Bogorodsky Power Co.
Pressure buffering hydropower introduction, Bogorodsky Power Co.
Andrew Bogorodsky3.1K views
Solar & hydroelectric energy von 2tgd
Solar & hydroelectric energySolar & hydroelectric energy
Solar & hydroelectric energy
2tgd479 views
Atmospheric general circulation in an idealized dry GCM without eddy-eddy int... von Farid Ait-Chaalal, PhD
Atmospheric general circulation in an idealized dry GCM without eddy-eddy int...Atmospheric general circulation in an idealized dry GCM without eddy-eddy int...
Atmospheric general circulation in an idealized dry GCM without eddy-eddy int...
Accident At Russias Biggest Hydroelectric Plant von Winson Ng
Accident At Russias Biggest Hydroelectric PlantAccident At Russias Biggest Hydroelectric Plant
Accident At Russias Biggest Hydroelectric Plant
Winson Ng620 views
Info Graphics Tsunami von Zef Fugaz
Info Graphics TsunamiInfo Graphics Tsunami
Info Graphics Tsunami
Zef Fugaz7K views
Irish Red Cross Tsunami Pictorial von irishredcross
Irish Red Cross Tsunami PictorialIrish Red Cross Tsunami Pictorial
Irish Red Cross Tsunami Pictorial
irishredcross3.5K views
Observations from Promoting Sustainable Hydropower Best Practices von CPWF Mekong
Observations from Promoting Sustainable Hydropower Best Practices Observations from Promoting Sustainable Hydropower Best Practices
Observations from Promoting Sustainable Hydropower Best Practices
CPWF Mekong3K views
Challenges and Good Practices in Resettlement Caused by Hydropower von CPWF Mekong
Challenges and Good Practices in Resettlement Caused by HydropowerChallenges and Good Practices in Resettlement Caused by Hydropower
Challenges and Good Practices in Resettlement Caused by Hydropower
CPWF Mekong3.3K views
The Study on Notification and Decision-Making Processes on the Hydropower in ... von CPWF Mekong
The Study on Notification and Decision-Making Processes on the Hydropower in ...The Study on Notification and Decision-Making Processes on the Hydropower in ...
The Study on Notification and Decision-Making Processes on the Hydropower in ...
CPWF Mekong2K views
Science Crime Busters Fingerprints Ppt von windyridge
Science Crime Busters Fingerprints PptScience Crime Busters Fingerprints Ppt
Science Crime Busters Fingerprints Ppt
windyridge1.4K views
Reach For The Stars Ppt von windyridge
Reach For The Stars PptReach For The Stars Ppt
Reach For The Stars Ppt
windyridge1.5K views
Combined impact of climate change and hydropower development on flows of the ... von tacochrane
Combined impact of climate change and hydropower development on flows of the ...Combined impact of climate change and hydropower development on flows of the ...
Combined impact of climate change and hydropower development on flows of the ...
tacochrane2.1K views

Similar a Dammed or damned: the role of hydropower in the water and energy nexus

Desalination for water supply von
Desalination for water supplyDesalination for water supply
Desalination for water supplyPriya Raj
15.7K views29 Folien
Sangam Shrestha von
Sangam ShresthaSangam Shrestha
Sangam ShresthaAPGYF2012
747 views29 Folien
Solar water purifier von
Solar water purifierSolar water purifier
Solar water purifierSarvi Gupta
319 views9 Folien
8115630 hydro-power von
8115630 hydro-power8115630 hydro-power
8115630 hydro-powerProbodh Mallick
423 views12 Folien
Katara Project presentation slides von
Katara Project presentation slidesKatara Project presentation slides
Katara Project presentation slidesZiggyGeorge
9 views16 Folien

Similar a Dammed or damned: the role of hydropower in the water and energy nexus(20)

Desalination for water supply von Priya Raj
Desalination for water supplyDesalination for water supply
Desalination for water supply
Priya Raj15.7K views
Sangam Shrestha von APGYF2012
Sangam ShresthaSangam Shrestha
Sangam Shrestha
APGYF2012747 views
Solar water purifier von Sarvi Gupta
Solar water purifierSolar water purifier
Solar water purifier
Sarvi Gupta319 views
Katara Project presentation slides von ZiggyGeorge
Katara Project presentation slidesKatara Project presentation slides
Katara Project presentation slides
ZiggyGeorge9 views
2 Governance-Reuse of Wastewater in Urban Local Bodies - 2 (1).pptx von COEPTech
2 Governance-Reuse of Wastewater in Urban Local Bodies - 2 (1).pptx2 Governance-Reuse of Wastewater in Urban Local Bodies - 2 (1).pptx
2 Governance-Reuse of Wastewater in Urban Local Bodies - 2 (1).pptx
COEPTech8 views
Treatment of surface water by autonomous solar powered von raedqtub
Treatment of surface water by autonomous solar poweredTreatment of surface water by autonomous solar powered
Treatment of surface water by autonomous solar powered
raedqtub2.3K views
Future of Wastewater von bwenzlau
Future of WastewaterFuture of Wastewater
Future of Wastewater
bwenzlau4.2K views
Water Reuse: Technologies for Industrial and Municipal Applications von njcnews777
Water Reuse: Technologies for Industrial and Municipal ApplicationsWater Reuse: Technologies for Industrial and Municipal Applications
Water Reuse: Technologies for Industrial and Municipal Applications
njcnews7772.4K views
Waterfootprintformininginsa 111205092849-phpapp02 von Moira Meyer
Waterfootprintformininginsa 111205092849-phpapp02Waterfootprintformininginsa 111205092849-phpapp02
Waterfootprintformininginsa 111205092849-phpapp02
Moira Meyer136 views
Feasibility of using photovoltaic solar energy for water treatment plants von IJECEIAES
Feasibility of using photovoltaic solar energy for water treatment plants Feasibility of using photovoltaic solar energy for water treatment plants
Feasibility of using photovoltaic solar energy for water treatment plants
IJECEIAES8 views
Paper Machine Whitewater Reuse von Kadant Inc.
Paper Machine Whitewater ReusePaper Machine Whitewater Reuse
Paper Machine Whitewater Reuse
Kadant Inc.1.4K views
Dr. David Dzombak - Need and Challenge of Alternative Water Sources for use i... von engineerou
Dr. David Dzombak - Need and Challenge of Alternative Water Sources for use i...Dr. David Dzombak - Need and Challenge of Alternative Water Sources for use i...
Dr. David Dzombak - Need and Challenge of Alternative Water Sources for use i...
engineerou547 views
Research: A new process to remove salt and organic compounds from frack waste... von Marcellus Drilling News
Research: A new process to remove salt and organic compounds from frack waste...Research: A new process to remove salt and organic compounds from frack waste...
Research: A new process to remove salt and organic compounds from frack waste...
L’impronta idrica della produzione di idrogeno elettrolitico su larga scala -... von Sardegna Ricerche
L’impronta idrica della produzione di idrogeno elettrolitico su larga scala -...L’impronta idrica della produzione di idrogeno elettrolitico su larga scala -...
L’impronta idrica della produzione di idrogeno elettrolitico su larga scala -...

Último

GDSC Mikroskil Members Onboarding 2023.pdf von
GDSC Mikroskil Members Onboarding 2023.pdfGDSC Mikroskil Members Onboarding 2023.pdf
GDSC Mikroskil Members Onboarding 2023.pdfgdscmikroskil
58 views62 Folien
DESIGN OF SPRINGS-UNIT4.pptx von
DESIGN OF SPRINGS-UNIT4.pptxDESIGN OF SPRINGS-UNIT4.pptx
DESIGN OF SPRINGS-UNIT4.pptxgopinathcreddy
19 views47 Folien
Update 42 models(Diode/General ) in SPICE PARK(DEC2023) von
Update 42 models(Diode/General ) in SPICE PARK(DEC2023)Update 42 models(Diode/General ) in SPICE PARK(DEC2023)
Update 42 models(Diode/General ) in SPICE PARK(DEC2023)Tsuyoshi Horigome
38 views16 Folien
sam_software_eng_cv.pdf von
sam_software_eng_cv.pdfsam_software_eng_cv.pdf
sam_software_eng_cv.pdfsammyigbinovia
8 views5 Folien
Design of machine elements-UNIT 3.pptx von
Design of machine elements-UNIT 3.pptxDesign of machine elements-UNIT 3.pptx
Design of machine elements-UNIT 3.pptxgopinathcreddy
33 views31 Folien
fakenews_DBDA_Mar23.pptx von
fakenews_DBDA_Mar23.pptxfakenews_DBDA_Mar23.pptx
fakenews_DBDA_Mar23.pptxdeepmitra8
16 views34 Folien

Último(20)

GDSC Mikroskil Members Onboarding 2023.pdf von gdscmikroskil
GDSC Mikroskil Members Onboarding 2023.pdfGDSC Mikroskil Members Onboarding 2023.pdf
GDSC Mikroskil Members Onboarding 2023.pdf
gdscmikroskil58 views
Update 42 models(Diode/General ) in SPICE PARK(DEC2023) von Tsuyoshi Horigome
Update 42 models(Diode/General ) in SPICE PARK(DEC2023)Update 42 models(Diode/General ) in SPICE PARK(DEC2023)
Update 42 models(Diode/General ) in SPICE PARK(DEC2023)
Design of machine elements-UNIT 3.pptx von gopinathcreddy
Design of machine elements-UNIT 3.pptxDesign of machine elements-UNIT 3.pptx
Design of machine elements-UNIT 3.pptx
gopinathcreddy33 views
fakenews_DBDA_Mar23.pptx von deepmitra8
fakenews_DBDA_Mar23.pptxfakenews_DBDA_Mar23.pptx
fakenews_DBDA_Mar23.pptx
deepmitra816 views
Design_Discover_Develop_Campaign.pptx von ShivanshSeth6
Design_Discover_Develop_Campaign.pptxDesign_Discover_Develop_Campaign.pptx
Design_Discover_Develop_Campaign.pptx
ShivanshSeth637 views
Ansari: Practical experiences with an LLM-based Islamic Assistant von M Waleed Kadous
Ansari: Practical experiences with an LLM-based Islamic AssistantAnsari: Practical experiences with an LLM-based Islamic Assistant
Ansari: Practical experiences with an LLM-based Islamic Assistant
M Waleed Kadous5 views
REACTJS.pdf von ArthyR3
REACTJS.pdfREACTJS.pdf
REACTJS.pdf
ArthyR334 views
ASSIGNMENTS ON FUZZY LOGIC IN TRAFFIC FLOW.pdf von AlhamduKure
ASSIGNMENTS ON FUZZY LOGIC IN TRAFFIC FLOW.pdfASSIGNMENTS ON FUZZY LOGIC IN TRAFFIC FLOW.pdf
ASSIGNMENTS ON FUZZY LOGIC IN TRAFFIC FLOW.pdf
AlhamduKure6 views
MongoDB.pdf von ArthyR3
MongoDB.pdfMongoDB.pdf
MongoDB.pdf
ArthyR345 views
BCIC - Manufacturing Conclave - Technology-Driven Manufacturing for Growth von Innomantra
BCIC - Manufacturing Conclave -  Technology-Driven Manufacturing for GrowthBCIC - Manufacturing Conclave -  Technology-Driven Manufacturing for Growth
BCIC - Manufacturing Conclave - Technology-Driven Manufacturing for Growth
Innomantra 6 views
_MAKRIADI-FOTEINI_diploma thesis.pptx von fotinimakriadi
_MAKRIADI-FOTEINI_diploma thesis.pptx_MAKRIADI-FOTEINI_diploma thesis.pptx
_MAKRIADI-FOTEINI_diploma thesis.pptx
fotinimakriadi8 views

Dammed or damned: the role of hydropower in the water and energy nexus

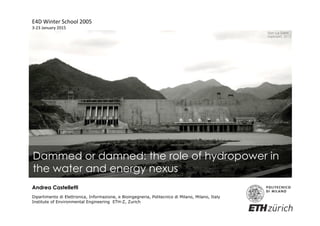
  • 1. Andrea Castelletti Dipartimento di Elettronica, Informazione, e Bioingegneria, Politecnico di Milano, Milano, Italy Institute of Environmental Engineering ETH-Z, Zurich Dammed or damned: the role of hydropower in the water and energy nexus E4D  Winter  School  2005   3-­‐23  January  2015     Son La Dam Vietnam, 2012
  • 2. Outline •  What is water-energy nexus? •  Hydropower and the nexus •  An added challenge: global change •  What can we do: the soft path approach •  Case study •  Conclusions
  • 3. Outline •  What is water-energy nexus? •  Hydropower and the nexus •  An added challenge: global change •  What can we do: the soft path approach •  Case study •  Conclusions
  • 4. The water and energy (watergy) nexus                                                                                                                                                                                                             water needs energy Water production, processing, distribution, and end-use require energy •  Extraction •  Treatment (drinking/waste) •  Distribution •  Use energy needs water Energy production requires water •  Hydropower •  Thermo electric cooling •  Mineral Extraction and refining •  Fuel production (fossil, non- fossil, and biofuel) •  Emission control Source: adapted from WWAP, 2014
  • 5. Energy needs water Source: IEA, 2012 •  Energy production consumes 15% of water withdrawals More than 580 billion m3 withdrawn every year (the average annual discharge of the River Gange), of which 66 billion is consumed)
  • 6. Energy needs water Source: IEA, 2012 •  Energy production consumes 15% of water withdrawals More than 580 billion m3 withdrawn every year (the average annual discharge of the River Gange), of which 66 billion is consumed) •  Thermal power plants (roughly 80% of global electricity production) is responsible for: •  43% of total water withdrawals in Europe, •  50% in the US, and •  more than 10% in China.
  • 7. Energy needs water Section II – Water for Energy Figure 23. Flow Chart of Embedded Water in Energy Extraction Mining, drilling (oil, natural gas) Biomass Wastewater Collection, treatment and discharge or reuse Resource Raw Material Refining Coal, petrol, natural gas, uranium, biofuels Renewable Energy Wind, solar, hydroelectric, tidal Water Source (e.g., lakes, rivers, aquifiers, sea) Energy Recycling Cogeneration, desalination Transport & Transmission Pipelines, waterways End Use Industrial Commercial Residential Public Utilities Transportation Energy Generation Discharge Water Transportation Fuels, Natural Gas Note: Water inputs and outputs may be in different water bodies. 1. Cooling Technologies 1.1 Once-Through (Open-Loop) Cooling Once-through cooling uses an ample supply of water (from an ocean, river, lake, cooling pond or canal) to run through the system’s heat exchanger to condense the low-pressure steam at the exhaust of the turbines high-temperature events and competition for water resources. This is particularly exacerbated by the fact that electricity demand is disproportionately high in water-scarce areas such as the Southwest. Moreover, Source: adapted from Wilkinson, 2000
  • 8. Energy needs water country’s mptive). In wals are used oberg, 2005). fraction is withdrawals n 3.3.1). implications nd examine s of primary ve industries quantities of eams need to That water he water uses. Water mining, environment. and gas water per he water nal fossil fuels uels. primary 35 (IEA, gress of ‘clean’ he world’s FIGURE 3.1 Water withdrawals and consumption vary for fuel production * The minimum is for primary recovery; the maximum is for secondary recovery. ** The minimum is for in-situ production, the maximum is for surface mining. *** Includes carbon dioxide 101 Sugar cane ethanol Corn ethanol Soybean Rapeseed Palm oil Lignocellulosic Refined oil Coal-to-liquids Gas-to-liquids Refined oil Refined oil Shale gas Coal Conventional gas Litres per toe <1 Withdrawal Consumption 102 103 104 105 106 107 biodiesel biodiesel biodiesel ethanol**** (EOR)*** (oil sands)** (conventional)* ‘Water use efficien India’. ] For power plants wi cooling system used required. The three open-loop, closed-l systems exist, but ar once-through, cool water, fresh and sali all the water to the evaporation (Figure less water withdraw use of cooling towe much higher water et al., 2011). Dry cooling does no use of fans that mov in automobiles). Po option is often the l cooling is less effect installations do ope China, Morocco, So because these system have parasitic losses estimated that cost for air cooled conde competitive in mos 2012). The volatility of pric fuels for thermal po* Includes trough, tower and Fresnel technologies using tower, dry FIGURE 3.8 Water use for electricity generation by cooling technology Nuclear Fossil steam Gas CCGT Nuclear Fossil steam Gas CCGT Nuclear Fossil steam (CCS) Fossil steam Coal IGCC (CCS) Coal IGCC Gas CCGT (CCS) Gas CCGT Gas CCGT Geothermal** Litres per MWh Wind Solar PV CSP* Other/noneDryCoolingtowerCooling pond Once- through 10 1 <1 10 2 10 3 10 4 10 5 10 6 Withdrawal Consumption power plant, the less heat has to be dissipated, thus less cooling is required (Delgado, 2012). Older power Primary production Energy generation Source: IEA, 2012
  • 9. Water needs energy •  Water related energy consumption is estimated to be about 2-3% of worldwide energy production
  • 10. Water needs energy •  California consumes approximately 20%of the state’s electricity, and 30% of the state’s non-power plant natural gas (source: California Energy Commission) •  Running the hot water faucet for 5 minutes uses about the same amount of energy as burning a 60-watt bulb for 14 hours (source US-EPA) •  Water related energy consumption is estimated to be about 2-3% of worldwide energy production
  • 11. Water needs energy Section I – Energy for Water Figure 11. Water Flowchart (Highlighting Source) Source Lakes, reservoirs, aquifers Water Treatment Water Distribution Water Extraction and Conveyance Recycled Water Distribution Recycled Water Treatment End Use Agriculture Energy Production Industrial Commercial Residential Leaks Wastewater Treatment Energy Production Biogas Nitrous oxide Net Loss Discharge to ocean Net Loss Evaporation Transpiration Wastewater Collection Leaks Storm Water Recycled Water Leaks Leaks Discharge Water Direct Use (Irrigation, energy production, industrial) Raw Water Raw Water Potable Water Wastewater Discharge Water Biosolids Biogas Source: Adapted from Wilkinson, 2000 1. Water Conveyance Research on the energy use of water conveyance systems, which are used to import water to these areas, Source: adapted from Wilkinson, 2000
  • 12. Water needs energy such as reverse osmosis, require larger amounts (1.5–3.5 kWh/m3 ). Water for agriculture generally requires little or no treatment, so energy requirements are mainly for pumping (Section 6.4). Globally, the amount of energy used for irrigation is directly related to the enormous quantities of water required for irrigation and the irrigation methods used. (400%), mestic use be noted that outh Africa; Development; e water’ GE). OECD ricity Livestock 2000 2050 World Note: This diagram does not incorporate critical elements such as the distance the water is transported or the level of efficiency, which vary greatly from site to site. Source: WBSCD (2009, fig. 5, p. 14, based on source cited therein). FIGURE2.2 Amount of energy required to provide 1 m3 water safe for human consumption from various water sources STATUS, TRENDS AND CHALLENGES Source: WBSCD, 2009 Amount of energy for 1 m3 of safe water
  • 13. Water needs energy 64 (Lazarova et al., 2012).quality (and in the case of groundwater, its depth), and Note: GWRS, groundwater replenishment system; WWTP, wastewater treatment plant. Source: Lazarova et al. (2012, fig. 23.1, p. 316, adapted from sources cited therein). © IWA Publishing, reproduced with permission. FIGURE 7.3 Typical energy footprint of the major steps in water cycle management with examples from different treatment plants using specific technologies 5 4 3 2 1 0 2.5 kWh/m3 , State Water Project, CA 0.35 kWh/m3 , Strass WWTP, Austria 2.5 1.5 0.24 0.3 0.4 0.6 1.4 2.5 2.5 1.5 2.5 0.3 1.2 5.0 4.0 0.1 0.2 0.05 0.16 0.24 0.25 0.3 0.5 0.2 1.0 1.4 1.4 1.1 0.53 kWh/m3 , GWRS, Orange County, CA 2.9 kWh/m3 , Desalination Ashkelon, Israel Water conveyance Water treatment Water distribution Preliminary treatment Trickling filters Activated sludge Activated sludge with nitrification Membrane bioreactor Water reuse Brackish water desalination Seawater desalination Rainwater harvesting Energyconsumption(kWh/m3 ) THEMATIC FOCUSCHAPTER 7 Source: Lazarova et al. 2012 Typical energy footprint of the major steps in the water cycle
  • 14. Implications and benefits of the nexus •  Nexus implies that decisions made in one domain affect the other and viceversa
  • 15. Implications and benefits of the nexus •  Nexus implies that decisions made in one domain affect the other and viceversa •  Policies that benefit one domain can pose significant risks and detrimental effects to the other (e.g. biofuels) …
  • 16. Implications and benefits of the nexus •  Nexus implies that decisions made in one domain affect the other and viceversa •  Policies that benefit one domain can pose significant risks and detrimental effects to the other (e.g. biofuels) … •  … but can also generate co-benefit (e.g. energy attracts greater political attention than water in many countries)
  • 17. How serious is the water constraint? VIETNAM/PHILIPPINES In 2010 an El Nino induced drought caused electricity shortages and rationing for several months
  • 18. How serious is the water constraint? VIETNAM/PHILIPPINES In 2010 an El Nino induced drought caused electricity shortages and rationing for several months CHINA In 2011 drought limited generation along the Yangtze river with higher coal demand and prices and electricity rationing
  • 19. How serious is the water constraint? INDIA In 2012 delayed monsoon reduced hydropower and raised energy demand for irrigation causing 2 days black out for 600 milion people VIETNAM/PHILIPPINES In 2010 an El Nino induced drought caused electricity shortages and rationing for several months CHINA In 2011 drought limited generation along the Yangtze river with higher coal demand and prices and electricity rationing
  • 20. How serious is the water constraint? INDIA In 2012 delayed monsoon reduced hydropower and raised energy demand for irrigation causing 2 days black out for 600 milion people VIETNAM/PHILIPPINES In 2010 an El Nino induced drought caused electricity shortages and rationing for several months CALIFORNIA In 2012 and 2014 drought caused significant hydropower energy loss due to reduced snowpack and limited precipitation CHINA In 2011 drought limited generation along the Yangtze river with higher coal demand and prices and electricity rationing
  • 21. How serious is the water constraint? INDIA In 2012 delayed monsoon reduced hydropower and raised energy demand for irrigation causing 2 days black out for 600 milion people VIETNAM/PHILIPPINES In 2010 an El Nino induced drought caused electricity shortages and rationing for several months CALIFORNIA In 2012 and 2014 drought caused significant hydropower energy loss due to reduced snowpack and limited precipitation CHINA In 2011 drought limited generation along the Yangtze river with higher coal demand and prices and electricity rationing US MID-WEST In 2006 heat wave forced substantial reduction of nuclear energy production to control temperature in the Missisipi river
  • 22. To know more … VOLUME 1 Report
  • 23. Outline •  What is water-energy nexus? •  Hydropower and the nexus •  An added challenge: global change •  What can we do: the soft path approach •  Case study •  Conclusions
  • 24. Hydropower and the nexus Source: WWAP, 2014 and IEA, 2013 Trends in world electricity generation by energy source 0 4 000 8 000 12 000 16 000 20 000 24 000 1971 1975 1980 1985 1990 1995 2000 2005 2011 Fossil thermal Nuclear Hydro Other* TWh Oil 24.6% Coal and peat 38.3% Coal and peat 41.3% Hydro 21.0% Hydro 15.8% Nuclear 3.3% Nuclear 11.7% Natural gas 12.2% Natural gas 21.9% Oil 4.8% Other* 0.6% Geothermal 0.3% Biofuels, waste 1.9% Solar PV 0.3% Wind 2.0% and other sources (a) 1971–2011 (b) 1973: 6 115 TWh total (c) 2011: 22 126 TWh total Note: Excludes pumped storage. *‘Other’includes geothermal, solar, wind, biofuels and waste, and heat. PV, solar photovoltaic. INDICATOR 13 (a) (b) 1973 (c) 2011 Trend in electricity generation by energy source
  • 25. Role of dams and reservoirs in out time, spacetime, space discharge discharge
  • 26. The first dam (2700 BC) Sadd-el-Kafara, Egypt 2700-2600 BC Source: http://www.hydriaproject.net, last visit 31.12.14  
  • 27. Dam development in the XIX and XX century Source: B. Lehner- McGill University
  • 28. Dam development in the XIX and XX century
  • 29. Dams by purpose Source: WWAP, with data from IEA (2013). IEA (International Energy Agency). 2013. World Indicators. World energy statistics and balances database. Paris, OECD/IEA. doi: 10.1787/data-00514-en (Accessed Dec 2013) (a) Single purpose dams (b) Multi purpose dams Source: WWAP, with data from ICOLD (n.d.). ICOLD (International Commission on Large Dams). n.d. General Synthesis. Paris, ICOLD. http://www.icold-cigb.net/GB/World_register/general_synthesis.asp (Accessed Dec 2013) INDICATOR 19 2000 2001 2002 2003 2004 2005 2006 2007 2011 World OECD Europe Africa Asia (excluding China) China (PR of China and Hong Kong) India Russian Federation United States of America 2008 2009 2010 Use of dams by purpose Hydropower 18.0% Water supply 12.0% Navigation and fish farming 0.6% Irrigation 50.0% Other 5.0% Recreation 5.0% Flood control 10.0% Irrigation 24.0% Navigation and fish farming 8.0% Recreation 12.0% Other 4.0% Flood control 20.0% Hydropower 16.0% Water supply 17.0% (a) (b) Source: WWAP, 2014 and ICOLD, 2014 single purpose multi purpose
  • 30. Dams by purpose and country Source: Lehner, 2011
  • 31. Capacity chart of hydropower HYPERBOLE Annual Conference, September 30 2014 8 Capacity Chart of Hydroelectric Power Station ρ= ×hP Q gH Source: Avelan, 2014 DISCHARGE HYDRAULICHEAD
  • 32. Capacity chart of hydropower HYPERBOLE Annual Conference, September 30 2014 8 Capacity Chart of Hydroelectric Power Station ρ= ×hP Q gH Source: Avelan, 2014 DISCHARGE HYDRAULICHEAD
  • 33. Capacity chart of hydropower HYPERBOLE Annual Conference, September 30 2014 8 Capacity Chart of Hydroelectric Power Station ρ= ×hP Q gH Source: Avelan, 2014 DISCHARGE HYDRAULICHEAD
  • 34. Largest hydropower plants (the first 25) 2 1 2 1 1 4 4 11 canada U.S. venezuela paraguay brazil pakistan russia china
  • 35. Hydropower impact Is HP generating conflicts with other water uses and ecosystem services? As a non-consumptive water use HP is not removing water from the system … … but for evaporation or seepage So, should we consider HP a clean, green and fair energy production source?
  • 36. Impacted sectors People Resettlement HYDROPOWER Environment Water Quality Sediment balance GHG emission Competing uses •  Agriculture •  Water supply •  Energy (cooling) •  Recreation •  …. Navigation
  • 37. Inter-sector conflicts: the Colorado river COLORADO RIVER, US-Mexico Salt intrusion (violet) Glen Canyon Dam •  Hydropower production ( 6 large dams) •  Agriculture (Imperial Valley) •  Water supply
  • 38. Inter-sector conflicts: the Colorado river COLORADO RIVER, US-Mexico Salt intrusion (violet) Glen Canyon Dam •  Hydropower production ( 6 large dams) •  Agriculture (Imperial Valley) •  Water supply
  • 39. Inter-sector conflicts: the Red River basin, Vietnam Hanoi HoaBinh TaBu LaiChau TamDuong NamGiang MuongTe VuQuang YenBai BaoLacHaGiang BacMe VIETNAM CHINA LAOS CAMBODIA THAILAND Da Thao Lo Integrated Management of Red-Thai Binh Rivers System (IMRR) funded by the Italian Ministry of Foreign Affairs http://www.imrr.info/
  • 40. Inter-sector conflicts: the Red River basin, Vietnam Basin wide, anthropogenic changes over the last ~ 60 years 1960 1970 1980 1990 2000 2010 Future LAND USE CHANGE RESERVOIR CONSTRUCTION SEDIMENT MINING
  • 41. Inter-sector conflicts: the Red River basin, Vietnam Focus on 3 stations Red  River:     Son  Tay   Ha  Noi     Duong  River:     Thuong  Cat  
  • 42. Inter-sector conflicts: the Red River basin, Vietnam Morphologic changes aggravate water scarcity & endanger vital infrastructure
  • 43. Inter-sector conflicts: the Red River basin, Vietnam Irriga@on   deficits     Saltwater   intrusion   Before Now
  • 44. Making things trickier: most rivers are transboundary … Trans-national river basins collect 60% of the world freshwater.
  • 46. Outline •  What is water-energy nexus? •  Hydropower and the nexus •  An added challenge: global change •  What can we do: the soft path approach •  Case study •  Conclusions
  • 48. Climate is changing: extremes will be more frequent source: IPCC, 2007
  • 49. Climate is changing and so does the water cycle: natural availability is declining Change in water natural availability, not considering production technology, access to water, etc 2050 vs [1961-90] source: Arnell, 2004
  • 50. Evidences from the future source: National GeographicRivers run dry (Colorado)
  • 51. Forzieri et al. , HESS, 107(25), 2014. Climate is changing and so does the water cycle: wetter in the north, drier in the south 40% reduction in minimum stream flow by the 2080s in the Iberian Peninsula, Italy and the Balkan Region
  • 52. Society is changing as well: + people source: UNEP, 2008
  • 53. Society is changing as well: + people ++ energy demand Global energy demand is expected to grow by more than one-third over the period to 2035, with China, India and the Middle Eastern countries accounting for about 60% of the increase.
  • 54. Society is changing as well: + people ++ energy demand ++ water demand Change in water withdrawal and consumption by 2025: more extraction less consumptive source: UNESCO, 2001
  • 55. Society is changing as well: + people ++ energy demand ++ water demand Shift to alternate energy will require more water + load balancing e.g. •  1st generation biofuel consume 20 times as much water for mile traveled compare to gasoline •  All-electric vehicles will place added strains on utilities: 1 mile three time water than with gasoline power (King and Webber, 2008) source: IEA, 2014 OECD/IEA,2012 newly built nuclear power plants that use once-through cooling (for instance, some that are constructed inland in China), which expands water withdrawals for nuclear generators by a third. Consumption of water in the world’s power sector rises by almost 40%, boosted by increased use of wet tower cooling in thermal capacity. Increasing shares of gas-fired and renewable generation play a significant role in constraining additional water use in many regions, as global electricity generation grows by some 0% over 2010-2035, much more than water withdrawal or consumption by the sector. Figure 17.7 ⊳ Global water use for energy production in the New Policies Scenario by fuel and power generation type 0 100 200 300 400 500 600 700 800 2010 2020 2035 bcm Withdrawal 0 20 40 60 80 100 120 140 2010 2020 2035 bcm ConsumpƟon Biofuels Fossil fuels Bioenergy Nuclear Oil Gas Coal Fuels: Power: Energy-related water use rises as a direct consequence of steeply increasing global biofuels supply, which triples in the New Policies Scenario on government policies that mandate the use of biofuels. Water withdrawals for biofuels increase in line with global supply, from 25 bcm to 110 bcm over 2010-2035. owever, consumption increases from 12 bcm to almost 50 bcm during that time, equalling the water consumption for power generation by the end of the Outlook period. These higher water requirements for biofuels production stem from the irrigation needs for feedstock crops for ethanol and biodiesel – primarily Global water use for energy by fuel and power generation source
  • 56. Society is changing as well: + people ++ energy demand ++ water demand Load balancing from renewable energy production Pumped storage is the largest-capacity form of grid energy storage available in the world (99% of bulk storage capacity worldwide, representing around 127,000 MW). Energy efficiency varies in practice between 70% and 80%. The EU has 38.3 GW net capacity (36.8% of world capacity) out of a total of 140 GW of hydropower. Japan has 25.5 GW net capacity (24.5% of world capacity).
  • 57. Global change is shrinking the pie global change
  • 58. Outline •  What is water-energy nexus? •  Hydropower and the nexus •  An added challenge: global change •  What can we do: the soft path approach •  Case study •  Conclusions
  • 59. React/adapt to change: re-expand the pie global change
  • 60. Accessible freshwater is limited Salt Water 98% Fresh Water 2% Worldwide distribution: 98% salt water 2% fresh water Surface waters (lake and rivers) are just 0.01% of the total freshwater Groundwater 12% Rivers & Lakes 0.01% Ice 87%
  • 61. What can we do? We should adapt, of course ADAPTATION MEASURE: Adjustment in natural or human systems in response to actual or expected climatic stimuli or their effects, which moderates harm or exploits beneficial opportunities. Source: European Climate Adaptation Platform - EC source: googling“adaptation program” – images
  • 62. Supply-side adaptation: investing in centralized, large-scale physical infrastructures, and centralized water management systems source: WRI 2003 The 20th century approach Water supply expansion is constrained (PEAK WATER) P.H. Gleick & M. Palanniappan, PNAS, 107(25), 2010. des of projections s that planners consis- y assumed continued, ven accelerated, expo- al growth in total water nd (Fig. 3). Some pro- ons were that water rawals would have to and even quadruple in ng years, requiring ad- nal dams and diver- on previously un- d water resources in te or pristine areas declared off-limits to lopment. Proposals been made to flood the d Canyon, dam the zon, and divert Siberi- nd Alaskan rivers to ern population centers. stead, as Figs. 3 and 4 , total water withdraw- egan to stabilize in the s and 1980s, and ruction activities be- o slow as the unquan- but real environmental and social of dams began to be recognized. More tly, the economic costs of the ional hard path have also risen to s that society now seems unwilling able to bear. The most cited estimate he cost of meeting future A New Approach for Water What is required is a “soft path,” one that continues to rely on carefully planned and managed centralized infrastructure but complements it with small-scale decentral- ized facilities. The soft path for water strives to improve the pro- ductivity of water use rather than seek endless sources of new supply. It delivers wa- ter services and qualities matched to users’ needs, rather than just delivering quantities of water. It ap- plies economic tools such as markets and pricing, but with the goal of encouraging efficient use, equitable dis- tribution of the resource, and sustainable system op- eration over time. And it in- cludes local communities in decisions about water man- agement, allocation, and use (21–23). As Lovins noted for the energy industry, the industrial dynamics of this approach are very different, the technical risks are smaller, and the dollars risked far fewer than those of the hard path (24). Rethinking water use means reevaluating the objec- tives of using water. Hard-path planners erro- neously equate the idea of using less water, or failing to use much more water, with a loss of well-being. This is a fallacy. Soft-path planners believe that people want to satisfy demands for goods and services, such as food, fiber, and Fig. 4. Construction of large reservoirs worldwide in the 20th century. Average numbers of reservoirs with volume greater than 0.1 km3 built by decade, through the late 1990s, are normalized to dams per year for different periods. Note that there was a peak in construction activities in the middle of the 20th century, tapering off toward the end of the century. The period 1991 to 1998 is not a complete decade; note also that the period 1901 to 1950 is half a century. “Other regions” include Latin America, Africa, and Oceania (46). source: Gleick, 2003
  • 63. Soft is wiser: the “soft path” Supply and demand integrated management: improving overall productivity of water by making water management more efficient rather than seeking new sources of supply P.H. Gleick, Nature, 418, 373, 2002. P.H. Gleick, Science, 302, 1524-1528, 2003. by •  EXPLORE THE TRADE-OFFs •  Distributed and coordinated management •  Better informed decisions (pervasive monitoring) •  Smart economics (option contracts, ensurances) •  Participatory decision-making •  ….
  • 64. Outline •  What is water-energy nexus? •  Hydropower and the nexus •  An added challenge: global change •  What can we do: the soft path approach •  Case study •  Conclusions
  • 65. An example: Lake Como Reservoirs Lake Como 247 Mm3 Alpine hydropowers 545 Mm3 Catchment area Lake Como 4500 km2 Stakeholders Hydropower producers: 25% national hydropower production Farmers: 5 districts for a total area of 1400 km2 Hydropower reservoir Power plant Como city Penstock River Adda River Adda Legend Lario Lario catchment River Irrigated area 0 10 20 30 40 505 Kilometers
  • 66. DISTRILAKE enhancing water resources management efficiency and sustainability via integration and coordination Hydropower reservoir Power plant Como city Penstock River Adda River Adda Legend Lario Lario catchment River Irrigated area 0 10 20 30 40 505 Kilometers Virtual and physical storages SNOW  PACK   HYDROPOWER   RESERVOIRS   LAKE  COMO   GROUNDWATER   GREEN  WATER  
  • 67. DISTRILAKE alpine hydro – lake como Hydropower reservoir Power plant Como city Penstock River Adda River Adda Legend Lario Lario catchment River Irrigated area 0 10 20 30 40 505 Kilometers Virtual and physical storages SNOW  PACK   HYDROPOWER   RESERVOIRS   LAKE  COMO   GROUNDWATER   GREEN  WATER   Anghileri, D. et al. Journal of Water Resources Planning and Management, 139(5), 492–500, 2013
  • 68. Hydropower reservoir Power plant Como city Penstock River Adda River Adda Legend Lario Lario catchment River Irrigated area 0 10 20 30 40 505 Kilometers Virtual and physical storages SNOW  PACK   HYDROPOWER   RESERVOIRS   LAKE  COMO   GROUNDWATER   GREEN  WATER   Anghileri, D. et al. Journal of Water Resources Planning and Management, 139(5), 492–500, 2013 R2   R1   DISTRILAKE alpine hydro – lake como
  • 69. Hydropower reservoir Power plant Como city Penstock River Adda River Adda Legend Lario Lario catchment River Irrigated area 0 10 20 30 40 505 Kilometers R2   R1   J F M A M J J A S O N D 0 10 20 30 40 Flow[m 3 /s] Inflow Release J F M A M J J A S O N D 50 100 150 200 250 Flow[m 3 /s] Time [days] (a) (b) FIG. 2. Historical inflow (dashed) and release (solid) of the hydropower reservoir R1 (a) and lake Como (b) (14-days moving median over the period 1996-2005). 22 R1 J F M A M J J A S O N D 50 100 150 200 250 Demand[m 3 /s] (a) J F M A M J J A S O N D 0 500 1000 1500 2000 2500 Price[euro/MW] (b) J F M A M J J A S O N D −20’000 −10’000 0 10’000 20’000 30’000 Revenue[euro/day] (c) Time [days] FIG. 5. (a): Yearly pattern of water demand. (b): Yearly pattern of the energy price (each colour band represents the energy price in the j-th most profitable hour). (c): Di↵erence in daily hydropower revenue (14-days moving average over years 1996-2005) between centralized policy C6 and uncoordinated UC. energy price J F M A M J J A S O N D 50 100 150 200 250 Demand[m 3 /s] (a) 2000 2500 ] (b) water demand J F M A M J J A S O N D 0 10 20 30 40 Flow[m 3 /s] Inflow Release J F M A M J J A S O N D 50 100 150 200 250 Flow[m 3 /s] Time [days] (a) (b) FIG. 2. Historical inflow (dashed) and release (solid) of the hydropower reservoir R1 (a) and lake Como (b) (14-days moving median over the period 1996-2005). Lake Como DISTRILAKE alpine hydro – lake como Anghileri, D. et al. Journal of Water Resources Planning and Management, 139(5), 492–500, 2013
  • 70. Lake Como Lake Como r s1 s2 s3 u1 u2 u3 R2 R1 R2 R1 hydropower plant irrigated area H2 H1 H3 H2 H1 H3 q3 q2 q1 q3 q2 q1 s1 s2 s3 u2 u3 u1 m1 m2 m 3 (•) m(•)(•) (•) UNCOORDINATED CENTRALIZED (a) (b) r FIG. 3. The model scheme under uncoordinated (left) and centralized (right) man- agement. 23 800 900 1000 1100 1200 1300 1400 1500 1600 460’000 470’000 480’000 490’000 Irrigation deficit [m 3 /s] 2 Hydropowerrevenue[euro/day] H ab C6 C5 C4 C3 C2 C1 CO2 CO1 UCUC UN-COORDINATED
  • 71. Lake Como Lake Como r s1 s2 s3 u1 u2 u3 R2 R1 R2 R1 hydropower plant irrigated area H2 H1 H3 H2 H1 H3 q3 q2 q1 q3 q2 q1 s1 s2 s3 u2 u3 u1 m1 m2 m 3 (•) m(•)(•) (•) UNCOORDINATED CENTRALIZED (a) (b) r FIG. 3. The model scheme under uncoordinated (left) and centralized (right) man- agement. 23 800 900 1000 1100 1200 1300 1400 1500 1600 460’000 470’000 480’000 490’000 Irrigation deficit [m 3 /s] 2 Hydropowerrevenue[euro/day] H ab C6 C5 C4 C3 C2 C1 CO2 CO1 UCUC UN-COORDINATED Lake Como r s1 s2 s3 u1 u2 u3 R2 R1 R2 R1 hydropower plant irrigated area H2 H1 H3 H2 H1 H3 q3 q2 q1 q3 q2 s2 s3 u2 u3 m 3 m(•) (•) NATED CENTRALIZED (b) cheme under uncoordinated (left) and centralized (right) man- CENTRALIZED (SOCIAL PLANNER)
  • 72. Lake Como Lake Como r s1 s2 s3 u1 u2 u3 R2 R1 R2 R1 hydropower plant irrigated area H2 H1 H3 H2 H1 H3 q3 q2 q1 q3 q2 q1 s1 s2 s3 u2 u3 u1 m1 m2 m 3 (•) m(•)(•) (•) UNCOORDINATED CENTRALIZED (a) (b) r FIG. 3. The model scheme under uncoordinated (left) and centralized (right) man- agement. 23 800 900 1000 1100 1200 1300 1400 1500 1600 460’000 470’000 480’000 490’000 Irrigation deficit [m 3 /s] 2 Hydropowerrevenue[euro/day] H ab C6 C5 C4 C3 C2 C1 CO2 CO1 UCC6 C5 C4 C3 C2 C1 UC UN-COORDINATED Lake Como r s1 s2 s3 u1 u2 u3 R2 R1 R2 R1 hydropower plant irrigated area H2 H1 H3 H2 H1 H3 q3 q2 q1 q3 q2 s2 s3 u2 u3 m 3 m(•) (•) NATED CENTRALIZED (b) cheme under uncoordinated (left) and centralized (right) man- CENTRALIZED (SOCIAL PLANNER)
  • 73. Lake Como Lake Como r s1 s2 s3 u1 u2 u3 R2 R1 R2 R1 hydropower plant irrigated area H2 H1 H3 H2 H1 H3 q3 q2 q1 q3 q2 q1 s1 s2 s3 u2 u3 u1 m1 m2 m 3 (•) m(•)(•) (•) UNCOORDINATED CENTRALIZED (a) (b) r FIG. 3. The model scheme under uncoordinated (left) and centralized (right) man- agement. 23 800 900 1000 1100 1200 1300 1400 1500 1600 460’000 470’000 480’000 490’000 Irrigation deficit [m 3 /s] 2 Hydropowerrevenue[euro/day] H ab C6 C5 C4 C3 C2 C1 CO2 CO1 UCC6 C5 C4 C3 C2 C1 UC UN-COORDINATED Lake Como r s1 s2 s3 u1 u2 u3 R2 R1 R2 R1 hydropower plant irrigated area H2 H1 H3 H2 H1 H3 q3 q2 q1 q3 q2 s2 s3 u2 u3 m 3 m(•) (•) NATED CENTRALIZED (b) cheme under uncoordinated (left) and centralized (right) man- CENTRALIZED (SOCIAL PLANNER) ?
  • 74. Lake Como R2 R1 hydropower plant irrigated area H2 H1 H3 q3 q2 q1 s1 s2 s3 u2 u3 u1 m1 m2 m 3 (•) (•) (•) COORDINATED r coordination mechanism FIG. 4. The model scheme under coordinated management. 24 800 900 1000 1100 1200 1300 1400 1500 1600 460’000 470’000 480’000 490’000 Irrigation deficit [m 3 /s] 2 Hydropowerrevenue[euro/day] H ab C6 C5 C4 C3 C2 C1 CO2 CO1 UCC6 C5 C4 C3 C2 C1 UC COORDINATED Lake Como r s1 s2 s3 u1 u2 u3 R2 R1 R2 R1 hydropower plant irrigated area H2 H1 H3 H2 H1 H3 q3 q2 q1 q3 q2 s2 s3 u2 u3 m 3 m(•) (•) NATED CENTRALIZED (b) cheme under uncoordinated (left) and centralized (right) man- CENTRALIZED (SOCIAL PLANNER) ?
  • 75. Lake Como R2 R1 hydropower plant irrigated area H2 H1 H3 q3 q2 q1 s1 s2 s3 u2 u3 u1 m1 m2 m 3 (•) (•) (•) COORDINATED r coordination mechanism FIG. 4. The model scheme under coordinated management. 24 800 900 1000 1100 1200 1300 1400 1500 1600 460’000 470’000 480’000 490’000 Irrigation deficit [m 3 /s] 2 Hydropowerrevenue[euro/day] H ab C6 C5 C4 C3 C2 C1 CO2 CO1 UCC6 C5 C4 C3 C2 C1 UC COORDINATED Lake Como r s1 s2 s3 u1 u2 u3 R2 R1 R2 R1 hydropower plant irrigated area H2 H1 H3 H2 H1 H3 q3 q2 q1 q3 q2 s2 s3 u2 u3 m 3 m(•) (•) NATED CENTRALIZED (b) cheme under uncoordinated (left) and centralized (right) man- CENTRALIZED (SOCIAL PLANNER) 0 0.5 1 1.5 2 2.5 3 3.5 x 10 8 0 2 4 6 8 10 12 Lake reservoir [m3 ] Releasedecision(R1)[m 3 /s] C6 UC Constraint FIG. 7. Hydropower release decision of reservoir R1 as a function of lake storage under centralized policy C6 (red circles) and uncoordinated policy UC (blue points). ?
  • 76. DISTRILAKE enhancing water resources management efficiency and sustainability via integration and coordination Hydropower reservoir Power plant Como city Penstock River Adda River Adda Legend Lario Lario catchment River Irrigated area 0 10 20 30 40 505 Kilometers Virtual and physical storages SNOW  PACK   HYDROPOWER   RESERVOIRS   LAKE  COMO   GROUNDWATER   GREEN  WATER  
  • 77. DISTRILAKE lake como - greenwater Hydropower reservoir Power plant Como city Penstock River Adda River Adda Legend Lario Lario catchment River Irrigated area 0 10 20 30 40 505 Kilometers Virtual and physical storages SNOW  PACK   HYDROPOWER   RESERVOIRS   LAKE  COMO   GROUNDWATER   GREEN  WATER   Galelli. et al. Environmental Modelling and Software, 25, 209–222, 2010
  • 78. Hydropower reservoir Power plant Como city Penstock River Adda River Adda Legend Lario Lario catchment River Irrigated area 0 10 20 30 40 505 Kilometers J F M A M J J A S O N D 50 100 150 200 250 Demand[m 3 /s] (a) J F M A M J J A S O N D 0 500 1000 1500 2000 2500 Price[euro/MW] (b) J F M A M J J A S O N D −20’000 −10’000 0 10’000 20’000 30’000 Revenue[euro/day] (c) Time [days] water demand J F M A M J J A S O N D 0 10 20 30 40 Flow[m 3 /s] Inflow Release J F M A M J J A S O N D 50 100 150 200 250 Flow[m 3 /s] Time [days] (a) (b) FIG. 2. Historical inflow (dashed) and release (solid) of the hydropower reservoir R1 (a) and lake Como (b) (14-days moving median over the period 1996-2005). 22 Lake Como water demand = Σ water use concessions [ - Irrigation - Industrial water supply - Run-off river hydro ] Is that the actual water demand? DISTRILAKE lake como - greenwater Galelli. et al. Environmental Modelling and Software, 25, 209–222, 2010
  • 79. DISTRILAKE lake como - greenwater green water resource blue water resource blue water resource blue water flow saturated zone unsaturated zone green water flow rain • BLUE WATER: surface and ground water • GREEN WATER: water in the unsaturated root zone Falkenmark, M. and Rockström, Journal of Water Resources Planning and Management, 132(3), 129–132, 2006 Galelli. et al. Environmental Modelling and Software, 25, 209–222, 2010
  • 80. Author's personal copy 0 200 400 600 800 1000 1200 1400 0 200 400 600 800 1000 1200 1400 J i (m 3 /s) 2 Jf (m2 /g/a) Naive OCP Frontier Reduced OCP Frontier Naive OCP Utopia point Reduced OCP Utopia point historical management C B B’ C’ AU’U U U’ h h Fig. 7. Image of the Pareto-Frontiers of the Naive (dashed line) and Reduced (solid line) OCP obtained by simulating the Lake Como system over the period 1993–20 historical performance, while points U’ and U are the Utopia points of the Naive and Reduced OCP respectively. The meaning of the labelled points is explained S. Galelli, R. Soncini-Sessa / Environmental Modelling & Software 25 (2010) 209–222 Hydropower reservoir Power plant Como city Penstock River Adda River Adda Legend Lario Lario catchment River Irrigated area 0 10 20 30 40 505 Kilometers J F M A M J J A S O N D 50 100 150 200 250 Demand[m 3 /s] (a) J F M A M J J A S O N D 0 500 1000 1500 2000 2500 Price[euro/MW] (b) J F M A M J J A S O N D −20’000 −10’000 0 10’000 20’000 30’000 Revenue[euro/day] (c) Time [days] water demand J F M A M J J A S O N D 0 10 20 30 40 Flow[m 3 /s] Inflow Release J F M A M J J A S O N D 50 100 150 200 250 Flow[m 3 /s] Time [days] (a) (b) FIG. 2. Historical inflow (dashed) and release (solid) of the hydropower reservoir R1 (a) and lake Como (b) (14-days moving median over the period 1996-2005). 22 Lake Como Blue water Blue & Green water irrigation deficit floodedarea DISTRILAKE lake como - greenwater Galelli. et al. Environmental Modelling and Software, 25, 209–222, 2010
  • 81. Author's personal copy 0 200 400 600 800 1000 1200 1400 0 200 400 600 800 1000 1200 1400 J i (m 3 /s) 2 Jf (m2 /g/a) Naive OCP Frontier Reduced OCP Frontier Naive OCP Utopia point Reduced OCP Utopia point historical management C B B’ C’ AU’U U U’ h h Fig. 7. Image of the Pareto-Frontiers of the Naive (dashed line) and Reduced (solid line) OCP obtained by simulating the Lake Como system over the period 1993–20 historical performance, while points U’ and U are the Utopia points of the Naive and Reduced OCP respectively. The meaning of the labelled points is explained S. Galelli, R. Soncini-Sessa / Environmental Modelling & Software 25 (2010) 209–222 Hydropower reservoir Power plant Como city Penstock River Adda River Adda Legend Lario Lario catchment River Irrigated area 0 10 20 30 40 505 Kilometers J F M A M J J A S O N D 50 100 150 200 250 Demand[m 3 /s] (a) J F M A M J J A S O N D 0 500 1000 1500 2000 2500 Price[euro/MW] (b) J F M A M J J A S O N D −20’000 −10’000 0 10’000 20’000 30’000 Revenue[euro/day] (c) Time [days] water demand J F M A M J J A S O N D 0 10 20 30 40 Flow[m 3 /s] Inflow Release J F M A M J J A S O N D 50 100 150 200 250 Flow[m 3 /s] Time [days] (a) (b) FIG. 2. Historical inflow (dashed) and release (solid) of the hydropower reservoir R1 (a) and lake Como (b) (14-days moving median over the period 1996-2005). 22 Lake Como Blue water Blue & Green water irrigation deficit floodedarea DISTRILAKE lake como - greenwater saving 75 Mm3 per year = ¼ of lake Como Galelli. et al. Environmental Modelling and Software, 25, 209–222, 2010
  • 82. DISTRILAKE lake como - greenwater Galelli. et al. Environmental Modelling and Software, 25, 209–222, 2010 Blue water
  • 83. DISTRILAKE lake como - greenwater Galelli. et al. Environmental Modelling and Software, 25, 209–222, 2010 Blue water
  • 84. DISTRILAKE lake como - greenwater Galelli. et al. Environmental Modelling and Software, 25, 209–222, 2010 Blue water
  • 85. DISTRILAKE lake como - greenwater Galelli. et al. Environmental Modelling and Software, 25, 209–222, 2010 Blue water Blue & green water
  • 86. DISTRILAKE lake como - greenwater Galelli. et al. Environmental Modelling and Software, 25, 209–222, 2010 Blue water Blue & green water
  • 87. Hydropower reservoir Power plant Como city Penstock River Adda River Adda Legend Lario Lario catchment River Irrigated area 0 10 20 30 40 505 Kilometers DISTRILAKE lake como - greenwater Galelli. et al. Environmental Modelling and Software, 25, 209–222, 2010 Network upgrade to supply on demand FlumeGateTM by RUBICON WATER
  • 88. Hydropower reservoir Power plant Como city Penstock River Adda River Adda Legend Lario Lario catchment River Irrigated area 0 10 20 30 40 505 Kilometers Downscaling Catchment model Water system model Performance indicators Management model Regional climate scenario Local climate scenario Reservoir inflow scenario Operation policy Impacts on water resources Anghileri, D. et al. Hydrology and Earth System Sciences, 15(6), 2025–2038, 2011 Uncertain futures and decision making
  • 89. Scenario-based approach possible future technological development and socio-economic development of the antropic forcings (IPCC 2007)
  • 90. Scenario-based approach from Le Treut et al., 2007 from www.wmo.int
  • 91. Scenario-based approach from www.wmo.int from100 km to 25 km and higher resolution
  • 92. Scenario-based approach HBV model [Bergstrom, 1976] from the atmosphere to local hydrological cycle
  • 94. Scenario-based approach Wilby & Dessai, Weather, 65(7), 180-185, 2010
  • 95. 500 1000 1500 2000 2500 3000 3500 4000 4500 5000 −5 −4.5 −4 −3.5 −3 −2.5 −2 x 10 5 Irrigation deficit (m 3 /s) 2 −Hydropowerrevenue(euro) * Future optimal management policies The impact of CC on Lake Como
  • 96. Adaptation is better than myopic 500 1000 1500 2000 2500 3000 3500 4000 4500 5000 −5 −4.5 −4 −3.5 −3 −2.5 −2 x 10 5 Irrigation deficit (m 3 /s) 2 −Hydropowerrevenue(euro) * Future optimal management policies
  • 97. Future is non stationary 500 1000 1500 2000 2500 3000 3500 4000 4500 5000 −5 −4.5 −4 −3.5 −3 −2.5 −2 x 10 5 Irrigation deficit (m3 /s)2 −Hydropowerrevenue(euro) 2071-­‐2080     2081-­‐2090     2091-­‐2100    
  • 98. Future is deeply uncertain 500 1000 1500 2000 2500 3000 3500 4000 4500 5000 −5 −4.5 −4 −3.5 −3 −2.5 −2 x 10 5 Irrigation deficit (m 3 /s) 2 −Hydropowerrevenue(euro) HadRM3H REMO HIRHAM RCAO CHRM PROMES CLM Uncertainty from different RCM projections
  • 99. Conclusions •  Present day water and energy systems are tightly intertwined •  Hydropower has a role in the nexus •  Global change is challenging future hydropower operation •  Soft adaptation measures should be first considered to better exploit the potential of existing infrastructures •  Designing and implementing those measures require a trully mulidisciplinary approach •  Sationarity is dead and the future uncertain: implications for planning