SlideShare ist ein Scribd-Unternehmen logo
1 von 84
ANALYSIS OF FINANCIAL WEALTH                  V.S.T. TILLERS TRACTORS LTD


                       INTRODUCTION

PART A: ABOUT INDUSTRY:
1.1 Introduction about the Tractor Industry


      The Indian tractor industries were as follows history of the company.
1945 to 1960:
      War suppliers tractors and bulldozers were imported for land
reclamation and cultivation in mid 1940`s in 1947 central and state tractors
organizations were setup to develop and promote the supply and age of
tractors in agriculture and unto 1960 the demand met entirely through
imports. There were 8500 tractors in age in1951-20000 is 1955 and 37000
by 1960.


1961 to 1970:
      Local production began in 1961 with five manufactures producing
total of880 units per day by 1965 this had increased to over 5000 unites per
pear and the total in use had rise to our 52000 by 1970 annual production
had exceeded 20000 units over 146000 units working in the country.


1971 to 1980
      Six new manufactures were established during this period although
three companies (Kriloscar tractors, Harshor and Pittie tractors) did not
survive. Escorts ltd., began location manufacture of ford tractors in 1971 in
collection with Ford UK and total production climbed steadily to 33000 in
1975 reaching 71000 by1980 credit facilities for farmers continued to
improve and the tractor market expanded the half million mark by 1980.


LORVEN EDUCATIONAL CENTRE                                                       1
ANALYSIS OF FINANCIAL WEALTH                  V.S.T. TILLERS TRACTORS LTD


1981 to 1990
      A further five manufacture began to production during this period but
only one of these survived in the increasingly competition market place.
Annual production exceeded 75000 units by 1985 and reaching 14000 in
1990 when the total in use was about 1 to 2 million. The Indian net importer
up to the mid seventies become an exporter in the 80`s mainly to countries in
Africa.


1991 to 1997
      Science 1992 it has not been necessary to obtain an industrial license
for tractor manufacture in India by 1997 annual production exceeded 255000
units and the national tractor park and passed the two million mark. India as
emerged as one of the world leaders wheeled tractors production.

The Industry Today

      Tractors manufacture in now firmly established in India and is highly
competitive with repaid advanced being made in technical design and
quality with increasing attention to export markets of the 16 companies that
began operation before 1990 six are considering before major manufactures
(Eicher, Escorts ltd., HMT, Mahindra and Mahindra, PTC and TAFE).

      Mahindra and Mahindra have emerged as a larger manufacture
producing68000 unites in 1997 followed TAFE, Escort ltd., and Punjab
tractors with 49000, 48000 and 40000 units respectively.


LORVEN EDUCATIONAL CENTRE                                                       2
ANALYSIS OF FINANCIAL WEALTH                   V.S.T. TILLERS TRACTORS LTD


      The average size of the tractor in the country is currently 35hp which
following trends in other parts of the world, seems likely to increase steadily
to around 45hp by 2020. By which time total tractor population may have
increased from the present two million with annual production up to
3200000.

Power Tillers
      By comparison with other parts of south East Asia demand for power
tillers in India has been slow to take off. However the current population of
around 66000 units with an average size of the 10hp is expected to rise
steadily to around production reaching our 50000 units.

      Tractor is a vehicle intended for drawing, towing, pushing or pulling
something which cannot propel itself and, often, powering it too. Most
commonly the word is used to describe a vehicle intended for pulling some
other vehicle or object (see traction unit).

      The word comes from the Latin trahere "to pull". A conflicting
history of the name suggests that steam tractors were originally referred to as
traction engines, with the word "tractor" eventually deriving from a
contraction of 'traction' and 'motor'.


LORVEN EDUCATIONAL CENTRE                                                       3
ANALYSIS OF FINANCIAL WEALTH                    V.S.T. TILLERS TRACTORS LTD


       In Britain, Australia, India, Spain, and Poland the word "tractor"
usually means "farm tractor", and the use of the word "tractor" to mean other
types of vehicles is familiar to the vehicle trade but unfamiliar to much of
the general public. In Canada and the US the word is also used to refer to a
road tractor .

Farm tractor


       A modern John Deere 8110 Farm Tractor plowing a field using a
chisel plow.

       The most common use of the term is for the vehicles used on farms.
The farm tractor is used for pulling or pushing agricultural machinery or
trailers, for plowing, tilling, disking, harrowing, planting, and similar tasks.

History

       The first powered farm implements in the early 1800s were portable
engines – steam engines on wheels that could be used to drive mechanical
farm machinery by way of a flexible belt. Around 1850, the first traction
engines were developed from these, and were widely adopted for
agricultural use. Where soil conditions permitted, such as the US, steam
tractors were used to direct-haul ploughs, but in the UK, ploughing engines
were used for cable-hauled ploughing instead. Steam-powered agricultural

LORVEN EDUCATIONAL CENTRE                                                          4
ANALYSIS OF FINANCIAL WEALTH                    V.S.T. TILLERS TRACTORS LTD


engines remained in use well into the 20th century, until reliable internal
combustion engines had been developed. [2]

        In 1892, John Froelich built the first practical gasoline-powered
tractor in Clayton County, Ohio. Only two were sold, and it was not until
1911, when the Twin City Traction Engine Company developed the design,
that it became successful.

        In Britain, the first recorded tractor sale was the oil-burning Hornsby-
Ackroyd Patent Safety Oil Traction engine, in 1897. However, the first
commercially successful design was Dan Albone's three-wheel Ivel tractor
of 1902. In 1908, Saundersons of Bedford introduced a four-wheel design,
and went on to become the largest tractor manufacturer outside the USA.

        While unpopular at first, these gasoline-powered machines began to
catch on in the 1910s as they became smaller and more affordable. Henry
Ford introduced the Fordson, the first mass-produced tractor in 1917. They
were built in the U.S., Ireland, England and Russia and by 1923, Fordson
had 77% of the U.S. market. The Fordson dispensed with a frame, using the
strength of the engine block to hold the machine together. By the 1920s,
tractors with a gasoline-powered internal combustion engine had become the
norm.

        The classic farm tractor is a simple open vehicle, with two very large
driving wheels on an axle below and slightly behind a single seat (the seat
and steering wheel consequently are in the center), and the engine in front of
the driver, with two steerable wheels below the engine compartment. This
basic design has remained unchanged for a number of years, but enclosed


LORVEN EDUCATIONAL CENTRE                                                        5
ANALYSIS OF FINANCIAL WEALTH                  V.S.T. TILLERS TRACTORS LTD


cabs are fitted on almost all modern models, for reasons of operator safety
and comfort.

      Originally, plows and other equiptment were connected via a draw-
bar, or a proporietary connecting system; prior to Harry Ferguson patenting
the three-point hitch. Recently, Bobcat's patent on its front loader connection
has expired; and compact tractors are now being outfitted with quick-
connect attachments for their front-end loaders.

      There are also lawn tractors. Cub Cadet, Husqvarna, John Deere,
Massey Ferguson and Toro are some of the better-known brands.


                                 Tractor

    Ford 75 HP tractor
    VST Mitsubishi Shakti MT 180 D Tractor

    Swaraj 744 FE

    OX –45 Tractor (45 HP)

    OX-35 Tractor (35 HP)


LORVEN EDUCATIONAL CENTRE                                                     6
ANALYSIS OF FINANCIAL WEALTH                         V.S.T. TILLERS TRACTORS LTD


Ford 75 HP tractor

Specifications:-

Powerful Engine

   • 75HP (BS). 4 cylinder engines give the power required to tackle the
       toughest soil conditions.
   • Direct injection (DI).

   • Easy start even in cold conditions

   • Rated engine rpm-2500

   • Bosch Rotary FI pump for high fuel efficiency

   • Dry type replaceable sleeves – enables the use of standard size piston
       after replacing the liners.

VST Mitsubishi Shakti MT 180 D Tractor

   •   More powerful and fuel efficient ‘Direct Injection’ Diesel Engine
   •   Micron Engine Oil Filter for long life
   •   Rotary changing device for ease and safety
   •   Adjustable tail wheel for superior field operation
   •   Optional wheel carrier for easy field operation


CHANNIES TRACTORS


LORVEN EDUCATIONAL CENTRE                                                      7
ANALYSIS OF FINANCIAL WEALTH                    V.S.T. TILLERS TRACTORS LTD


      Hubei Machinery & Equipment Import & Export Corporation was
established as a major machinery and equipment exporter. Today, we are
proud to be one of the world¡¯s foremost suppliers of industrial products
especially in the agricultural machinery and industrial equipment markets
such as tractors, ATVs, Gocarts, bulldozers, diesel/gasoline generators etc.

      With our beginnings in the early 1970s, we have since established 24
subsidiaries both inside and outside of China. These include 9 subsidiaries in
the provincial cities, 5 enterprises in chinese cities such as Zhuhai,
Shengzhen, Guangzhou, Shanghai, Beijing and 4 overseas enterprises in the
USA, UKRAINE, SYRIA and Hongkong. We also have set up 6 joint
ventures and hundreds of coordinate factories all over China. We have
traded in over 100 countries in the world market providing thousands of
products. Our annual product turnover ranks among China¡¯s top 200 largest
companies. We will be glad to work with the partners’ worldside.

HMT TRACTORS

   Commenced manufacturing Agricultural Tractors in 1972 with
technology acquired from ZETOR, Czech Republic and continues to
upgrade the products.

   Our Tractor Plants in Pinjore, Mohali and Hyderabad with capacity of
20,000 per annum, produces wide range of Tractors from 25 HP to 75 HP to
suit various farming requirements. HMT Tractor manufacturing units have
ISO 9001 certification.

   Our products are reliable, simple to operate with safety features and are
well accepted in the international market. We have exported our Tractors to


LORVEN EDUCATIONAL CENTRE                                                      8
ANALYSIS OF FINANCIAL WEALTH                   V.S.T. TILLERS TRACTORS LTD


USA, Czech Republic, Croatia, Sri Lanka, Bangladesh, South Africa,
Senegal, Nigeria, Malaysia, and Liberia etc.


The Tractors have:

   •   Powerful, fuel efficient engines.
   •   Roll Over Protective Structure for safety
   •   Hydraulic and Mechanical Disc Brakes
   •   Dual Clutch for travel and PTO operations
   •   Low maintenance and operational cost

       We also offer Primary & Secondary Tillage Implements, Land
Shaping, Planting and Harvesting Equipment.

MAHINDRA GUJARAT

       Mahindra Gujarat Tractor Limited was formed in 2001 after
Mahindra and Mahindra Limited purchased sixty percent of the remaining
shares in Gujarat Tractor Corporation Limited, from the Govt. of Gujarat. It
is based in Vadodara, Gujarat, India. Their tractors, now called Shaktimaan
were originally named Hindustan and are based on the Zetor tractor under
licensing agreements.


LORVEN EDUCATIONAL CENTRE                                                  9
ANALYSIS OF FINANCIAL WEALTH                  V.S.T. TILLERS TRACTORS LTD


PART-B: ABOUT SUBJECT


                          FINANCIAL STATEMENT

DEFINITION
      In the words of John .N. Myer “The Financial statements provide a
summary of the accounts of a business enterprise, the balance reflecting
the assets, liabilities and capital as on a certain date and the income
statement showing the results of operations during a certain period”.
      Financial statements are prepared primarily for decision-making. They
play a dominant role in setting the framework of managerial decisions. But
the information provided in the financial statements is not an end in itself as
no meaningful conclusions can be drawn from these statements alone.
However, the information provided in the financial statements is of immense
use in making decisions through analysis and interpretation of financial
statements


MEANING OF FINANCIAL STATEMENTS

      The term Financial Statement refers to the Two Statements
      1. The position statement or the Balance Sheet.


LORVEN EDUCATIONAL CENTRE                                                   10
ANALYSIS OF FINANCIAL WEALTH                    V.S.T. TILLERS TRACTORS LTD


      2. The Income statements or the Profit and loss account.
      These statements are used to convey to management and other
interested outsiders the profitability and financial position of a Firm.


FINANCIAL ANALYSIS
      Financial analysis is “The process of identifying the Financial
Strengths and Weaknesses of the firm by properly establishing
relationship between the items of the balance sheet and the profit and
loss account.”


      There are various methods or techniques used in analyzing financial
statements, such as comparative statements, trend analysis, common size
statements, schedules of changes in working capital, funds flow statement
and cash flow analysis, cost- volume-profit analysis and ratio analysis.
      The purpose of financial analysis is to diagnose the information
contained in financial statements so as to judge the profitability and financial
soundness of the firm, a financial analyst analyses the financial statements
with various tools of analysis before commenting upon the financial health
or weaknesses of an enterprise.
      The analysis and interpretation of financial statements is essential to
bring out the mystery behind the figures in financial statements. Financial
statement analysis is an attempt to determine the significance and meaning
of the financial statement data so that forecast may be made of the future


LORVEN EDUCATIONAL CENTRE                                                    11
ANALYSIS OF FINANCIAL WEALTH                    V.S.T. TILLERS TRACTORS LTD


earnings, ability to pay interest and debt maturities (both current and long
term) and profitability of a sound dividend policy.


The Significance or Importance of Financial Analysis:
   1. To know the Present and Future Profitability of their Concern

   2. To know the Earning Per Share and the Dividend Per Share, which
      have an impact on the market prices of their shareholdings.

   3. To know the Financial Position of the Concern.

   4. To know the stake or risk undertaken by firm.

   5. To Analyze the Financial Statements which helps the management to
      ascertain the profitability of the enterprise.

   6. To ascertain the Trend of Progress of the Concern.

   7. To forecast future sales, Production, Expenses, Profits etc on the basis
      of the past data.

   8. To ascertain the adequacy of Capital Structure of the Concern.

   9. To know whether the Short-term Financial Position of the concern is
      good to Pay Bonus Increased wages, etc.

   10.To have correct assessment of Taxes, such as Excise duties, Sales tax,
      Income tax etc.


LORVEN EDUCATIONAL CENTRE                                                  12
ANALYSIS OF FINANCIAL WEALTH                  V.S.T. TILLERS TRACTORS LTD


   11.To regulate the prices of goods produced by the enterprise.

   12.To determine it’s Financial Policies.


TYPES OF FINANCIAL ANALYSIS


      1. ON THE BASIS OF MATERIAL USED
              A) Externa1 analysis
              B) Internal analysis


A) EXTERNAL ANALYSIS:
      Outsiders who do not have access to the detailed internal accounting
records of the business firm do this analysis. These outsiders include
investors, potential investors, creditors, potential creditors, government
agencies, credit agencies and the general public. For financial analysis these
external parties to the firms depend almost on the published financial
statements.
B) INTERNAL ANALYSIS:
      The analysis conducted by persons who have access to the internal
accounting records of a business firm is known as internal analysis, such an
analysis can, therefore be performed by executives and employees of the
organization as well as government agencies which have Statutory powers
vested in them. Financial analysis for managerial purposes is the internal


LORVEN EDUCATIONAL CENTRE                                                  13
ANALYSIS OF FINANCIAL WEALTH                  V.S.T. TILLERS TRACTORS LTD


type of analysis that can be affected depending upon the purpose to be
achieved.


2. ON THE BASIS OF MODUS OPERANDI
         A. Horizontal analysis
         B. Vertical analysis.


A) HORIZONTAL ANALYSIS
       Horizontal analysis refers to the comparison of financial data of a
company for several years. The figures for this type of analysis are presented
horizontally over a number of columns. The figures of the various years are
compared with standard or base year. A base year is a year chosen as
beginning point. This type of analysis is also called ‘Dynamic analysis’ as it
is based on the data from year to year rather than on data of any one year.
Comparative statements and trend percentages are two tools employed in
horizontal analysis.


B) VERTICAL ANALYSIS.
      Vertical analysis refers to the study of relationships of the various
items in the financial statements of one accounting period. In this type of
analysis the figures from financial statements of a year are compared with a
base selected from the same year’s statement. It is also known as ‘static
analyses. Common-size financial statements and financial ratio’s are the two
tools employed in vertical analysis.


PROCEDURE OF FINANCIAL STATEMENT ANALYSIS


LORVEN EDUCATIONAL CENTRE                                                  14
ANALYSIS OF FINANCIAL WEALTH                   V.S.T. TILLERS TRACTORS LTD


      There are three steps involved in the analysis of financial statements.
These are
      1. Selection
      2. Classification and
      3. Interpretation.
      The first involves selection of information (data) relevant to the
purpose of analysis of financial statements.
      The second step involved is the methodical classification of the data
and the third step includes drawing of intervenes and conclusions.


METHODS OR DEVICES OF FINANCIAL ANALYSIS.
      The analysis and interpretation of financial statements is used to
determine the financial position and results of operations as well. A number
of methods or devices are used to study the relationship between different
statements.
The following methods of analysis are generally used
   1. Comparative statements.
   2. Trend analysis.
   3. Common-size statements.
   4. Funds flow analysis.
   5. Cash flow analysis.
   6. Ratio analysis.
   7. Cost-volume-profit analysis.


1. COMPARATIVE STATEMENTS.


LORVEN EDUCATIONAL CENTRE                                                 15
ANALYSIS OF FINANCIAL WEALTH                   V.S.T. TILLERS TRACTORS LTD


      The Comparative Financial statements are statements of the financial
position at different periods of time. The elements of financial position are
shown in a comparative form so as to give an idea of financial position at
two or more periods. Two financial statements (balance sheet and income
statement) are prepared in Comparative form for financial analysis purposes.
Not only the comparison of the figures of the two periods but also the
relationship between balance sheet and income statement enables an in depth
study of financial position and operative results.
      The two Comparative statements are
            A. Balance sheet.
            B. Income statement.
A. COMPARATIVE BALANCE SHEET.
      The Comparative balance sheet analysis is the study of the trend of the
same items, group of items and computed items in two or more balance
sheets of the same business enterprise on different dates. The changes in
periodic balance sheet items reflect the conduct of a business. The changes
can be observed by comparison of the balance sheet at the beginning and at
the end of a period and these changes can help in forming an opinion about
the progress of an enterprise.
B. COMPARATIVE INCOME STATEMENT.
      The income statement gives the results of the operations of a business.
The Comparative Income statement gives an idea of the progress of a
business over a period of time. The changes in absolute data in money
values and percentages can be determined to analyze the profitability of the
business.


LORVEN EDUCATIONAL CENTRE                                                 16
ANALYSIS OF FINANCIAL WEALTH                       V.S.T. TILLERS TRACTORS LTD


2. TREND ANALYSIS.
       The financial statements may be analyzed by computing trends of
series of information. This method determines the direction upwards or
downwards and involves the computation of the percentage relationship that
each statement item bears to the same item in base year.


3.     COMMON SIZE STATEMENT.
       The common size statements, balance sheet and income statement are
shown in analytical percentages. The common size statements may be
Prepared in the following way.
The Total of Assets or Liabilities is taken as 100, The individual assets are
expressed as a percentage of total assets that is 100 and different liabilities
are calculated in relation to total liabilities.


 A. COMMON SIZE BALANCE SHEET.
       A statement in which balance sheet items are expressed as the ratio of
each asset to total and ratio of each liability is expressed as a ratio of total
liabilities is called common size balance sheet. The common size balance
sheet can be used to compare companies of differing size. The comparison
of figures in different periods is not useful because total figures may be
affected by a number of factors. It is not possible to establish standard norms
for various assets. The trends of figures from year to year may not be studied
and even they may not give proper results.


     B. COMMON SIZE INCOME STATEMENT.


LORVEN EDUCATIONAL CENTRE                                                    17
ANALYSIS OF FINANCIAL WEALTH                   V.S.T. TILLERS TRACTORS LTD


      The items in income statement can be shown as percentages of sales
to show the relation of each item to sales. A significant relationship can be
established between items of income statement and volume of sales. The
increase in sales will certainly increase selling expenses and not
administrative or financial expenses. In case the volume of sales increases to
a considerable extent, administrative and financial expenses may go up. In
case the sales are declining, the selling expenses should be reduced at once.
So a relationship is established between sales and other items in Income
statement and their relationship is helpful in evaluating operational activities
of the enterprise.


2. FUNDS FLOW STATEMENT
      According to ‘SMITH and BROWN' Funds flow statement “Is a
method by which we study changes in the financial position of a
business enterprises between beginning and ending financial statement
dates”.
      Meaning of funds “Funds are usually called as working capital for
the purpose of funds flow statement”
          It is a statement showing sources and application of funds for a
period of time. The funds flow statement, which shows the movement of
funds and is a report of the financial operation of the business undertaking. It
indicates various means by which funds were obtained during a particular
period and the ways in which these funds were employed. In simple words,
it is a statement of sources and application of funds.
Advantages of Funds Flow Statement
   1. It helps in providing proper guideline for of available Funds.


LORVEN EDUCATIONAL CENTRE                                                    18
ANALYSIS OF FINANCIAL WEALTH                   V.S.T. TILLERS TRACTORS LTD


   2. Acts as a basis for financial plan budgeting.
   3. It gives early warning for the financial dangers.
   4. It helps in borrowing funds from others sources.
5. CASH FLOW ANALYSIS.
      Cash flow statement is a “Statement, which describes the Inflows
(sources) and Outflow (uses) of cash and cash equivalent in an
enterprise during a specified period of time”.


Advantages:
   1. Cash flow statement is very useful in the evaluation of cash position
      of a firm.
   2. It helps in planning the repayment of loans, replacement of fixed
      assets and other similar long term planning of cash.
   3. Cash flow statement is more suitable for making comparisons than the
      funds flow statement, as there is no standard format for the same.
   4. Cash flow statement provides information of all activities classified
      under operating, investing and financing activities.


6. RATIO ANALYSIS.
      The ratio analysis is one of the most powerful tools of financial
analysis. It is the process of establishing and interpreting various ratios
(quantitative relationship between figures and groups of figures) it is with
the help of ratios that the financial statements can be analyzed more clearly
and decisions made from such analysis. Ratio analysis is a technique of
analysis and interpretation of financial statements.


LORVEN EDUCATIONAL CENTRE                                                  19
ANALYSIS OF FINANCIAL WEALTH                     V.S.T. TILLERS TRACTORS LTD


Advantages:
   1. It helps in decision-making.
   2. It helps in financial forecasting and planning.
   3. It helps in communicating. The financial strength and weakness of a
       firm are communicated in a more easy and understandable manner by
       the use of ratios.
   4. It helps in co-ordination and control.
   5. It use full in inter- firm comparison


TYPES OF RATIOS
I). LIQUIDITY RATIO.
       These are the ratios, which measure the short-term solvency or
financial position of a firm. These ratios are calculated to comment upon the
Short term paying capacity of a concern or the firm’s ability to meet its
current obligations.
       To measure the liquidity of a firm, the following ratios can be
calculated.
Liquidity Ratios
       A). Current ratio.
       B). Quick ratio or acid test or liquid ratio.
       C). Absolute liquid ratio.


A). CURRENT RATIO
        It is the ratio, which matches current assets with the firm’s current
liabilities
                           Current Assets
        Current Ratio =
                          Current Liabilities


LORVEN EDUCATIONAL CENTRE                                                  20
ANALYSIS OF FINANCIAL WEALTH                           V.S.T. TILLERS TRACTORS LTD


       This ratio throws good light on the short-term financial position and
its policies. It is an indicator of a firm’s ability to promptly meet its short-
term liabilities.


B). QUICK RATIO OR ACID TEST OR LIQUID RATIO
              This ratio more severe test of liquidity of a firm. It shows the
ability of a business to meet its immediate financial commitments.
                         Quick Assets
       Quick Ratio =
                       Current Liabilities


C). ABSOLUTE LIQUID RATIO.
       This also known as super quick ratio
                                       Cash
       Absolute Liquid Ratio =
                                 Current Liabilities


II) ANALYSIS OF LONG-TERM FINANCIAL POSITION
OR TESTS OF SOLVENCY:
       The term solvency refers to the ability of a concern to meet its long-
term obligations. The long-term indebtedness of a firm includes debenture
holders, financial institutions providing medium and long-term loans and
other creditors selling goods on installment basis.
       Long-term solvency ratios indicate a firm’s ability to meet the fixed
interest and costs and repayment schedules associated with its long-term
borrowings.


LORVEN EDUCATIONAL CENTRE                                                       21
ANALYSIS OF FINANCIAL WEALTH                        V.S.T. TILLERS TRACTORS LTD


      The following ratios serve the purpose of determining the solvency of
the concern.
   A) Debt-equity ratio
   B) Proprietary ratio or equity ratio
   C) Fixed assets to net worth or proprietor’s funds ratio


A). DEBT-EQUITY RATIO:
      Debt-equity ratio also known as external-internal equity ratio. It is
calculated to measure the relative claims of outsiders and the owners (that is
share holders) against the firm’s assets. This ratio indicates the relationship
between the external equities or the outsider’s funds and the internal equities
or the shareholders funds.
                               Long Term Debts
      Debt - Equity Ratio =
                              Shareholders Equity

      Where outsider’s funds include all debts/Liabilities to outsiders
whether long term or short term or whether in the form of debentures, bonds,
mortgages or bills. The shareholders funds consist of equity share capital,
preference share capital, capital reserves, revenue reserves and reserves
representing accumulated profits and surplus like reserves for contingencies,
sinking funds etc
      The debt- equity ratio is calculated to measure the extent to which
debt financing has been used in business. The ratio indicates the
proportionate claims of owners and the outsiders against the firm’s assets.
The purpose is to get an idea of the cushion available to outsiders on the
liquidation of the firm. Generally a low ratio (debt being low in comparison
to shareholders funds) is considered as favorable from the long-term
creditor’s point of view because a high proportion of owner’s funds provide


LORVEN EDUCATIONAL CENTRE                                                    22
ANALYSIS OF FINANCIAL WEALTH                       V.S.T. TILLERS TRACTORS LTD


a larger margin of safety for them. A high debt equity ratio which indicates
that the claims of outsiders (creditors) are greater than those of owners, may
not be considered by the creditors because it gives a lesser margin of safety
for them at the time of liquidation of the firm.


B) PROPRIETORY RATIO:
      A variant to the debt-equity ratio is the proprietary ratio, which is also
known as equity ratio or shareholders to total equities ratio or net worth to
total assets ratio. This ratio establishes the relationship between
shareholder’s funds to total assets of the firm.
                             Shareholdres Funds
       Proprietory Ratio =
                                Total Assets

      Where shareholders fund is equity share capital, undistributed profits,
reserves and surplus out of this amount, accumulated losses should be
deducted.
      As equity represents the relationship of owner’s funds to total assets,
higher the ratio or the share of the shareholders in the total capital of the
company. This ratio indicates the extent to which the assets of the company
can be lost without affecting the interest of creditors of the company.


C). FIXED ASSETS TO NET WORTH RATIO OR FIXED
ASSETS TO PROPRIETOR’S FUNDS:
      This ratio establishes the relationship between fixed assets and
shareholder’s funds that is share capital, reserves and surplus and retained
earnings.
                                    Fixed Assets
  Fixed Assets to Networth Raio =
                                     Networth


LORVEN EDUCATIONAL CENTRE                                                    23
ANALYSIS OF FINANCIAL WEALTH                       V.S.T. TILLERS TRACTORS LTD


III) PROFITABILITY RATIOS:
      The primary objective of a business undertaking is to earn profits.
Profit earning is considered essential for the survival of the business. A
business needs profits not for its existence but also for expansion and
diversification.
Generally, profitability ratios are calculated either in relation to investment
General profitability ratios.
   A. Gross profit ratio.
   B. Operating ratio
   C. Operating profit ratio
   D. Expenses ratio
   E. Net profit ratio


A) GROSS PROFIT RATIO:
      Gross profit ratio measures the relationship of gross profit to net sales
and is usually represented as a percentage.
                               Gross Profit
        Gross Profit Ratio =                X100
                                Net Sales


      The gross profit ratio indicates the extent to which selling prices of
goods per unit may decline without resulting in losses on operations of a


LORVEN EDUCATIONAL CENTRE                                                         24
ANALYSIS OF FINANCIAL WEALTH                       V.S.T. TILLERS TRACTORS LTD


Firm. As the gross profit is found by deducting cost of goods sold from the
net sales, higher the gross profit better the result. A low gross profit ratio
indicates high cost of goods sold due to unfavorable purchasing policies,
lesser sales, lower selling prices, excessive competition, over- investment in
plant and machinery etc
      A comparison of gross profit ratio overtime or for different firms in
the same industry is a good measure of profitability, yet the gross profit ratio
is one of the very important ratios for measuring profitability of a firm.


B). OPERATING RATIO:
             Operating ratio establishes the relationship between the cost of
goods sold and other operating expenses on the one hand and the sales on
the other.
      In other words, it measures the cost of operations per rupee of sales.
                           Operating Cost
       Operating Ratio =                  X 100
                             Net Sales


C) OPERATING PROFIT RATIO
      This ratio is calculated by dividing operating profit by sales
                                  Operating Profit
       Operating Profit Ratio =                    X 100
                                     Net Sales


      Where operating profit = Net sales –Operating profit


D) EXPENSES RATIO:
      Expenses ratio indicates the relationship of various expenses to net
sales. Expenses ratio are calculated by dividing each item of expenses or


LORVEN EDUCATIONAL CENTRE                                                      25
ANALYSIS OF FINANCIAL WEALTH                               V.S.T. TILLERS TRACTORS LTD


group of expenses with the net sales to analyze the cause of variation if the
operating profit.


Expenses ratio can be calculated as follows:
                              Cost of sales
a)    Total cost to Sales =                 X 100
                               Net Sales


      Administration and Office
b).    expenses to Sales Ratio                 =
                                                   Adiminsration & Office Expenses
                                                                                   X 100
                                                              Net Sales
      Selling and Distribution
c).    Expenses to SalesRatio         =
                                          Selling and Distribution expenses
                                                                            X100
                                                      Net Sales
                                                      Non Opertaing Expenses
d).    Non Operating Expenses to Sales Ratio =                               X 100
                                                            Net Sales


E) NET PROFIT RATIO
          Net profit ratio establishes a relationship between net profit (after
taxes) and sales and indicates the efficiency of the management in
manufacturing, selling, administrative and other activities of the firm. This
ratio is the overall measure of firm’s profitability and is calculated as.
                                    Net Profit After Tax
          a)   Net Profit Ratio =                        X 100
                                         Net Sales


IV OVERALL PROFITABILITY RATIO
          Profits are the measure of overall efficiency of a business. The higher
the profit, the more efficient is the business considered. Thus, overall
profitability or efficiency of a business can be measured in terms of profits
related to investments made in the business.

LORVEN EDUCATIONAL CENTRE                                                                  26
ANALYSIS OF FINANCIAL WEALTH                          V.S.T. TILLERS TRACTORS LTD


   A. Return on shareholder’s investment or net worth ratio.
   B. Return on equity capital
   C. Earning per share
   D. Dividend yield ratio
   E. Dividend pay-out ratio
   F. Price earning (earning yield) ratio.


A) RETURN ON SHAREHOLDER’S INVESTMENT OR NET
WORTH RATIO
      Return on shareholder’s investment popularly known as return on
investment or return on shareholder. Proprietor’s fund is the relationship
between net profits (after interest and tax) and the proprietor’s funds
                                  Net Profit After Interest and Tax
       Return on Investment =
                                        Shareholders Funds


B) RETURN ON EQUITY CAPITAL:
      Ordinary shareholders are the real owners of the company. They
assume the highest risk in the company. Ordinary shareholders are more
interested in the profitability of a company and the performance of a
company should be judged on the basis of return on equity capital of a
company.
                             Net Profit After Tax - Preference Dividend
Return on Equity Capital =
                                        Equity Share Capital


LORVEN EDUCATIONAL CENTRE                                                      27
ANALYSIS OF FINANCIAL WEALTH                        V.S.T. TILLERS TRACTORS LTD


C) EARNING PER SHARE:
       Earning per share is a small variation of return on equity capital and is
calculated by dividing the net profit after taxes and preference dividend by
the total number of equity shares.
                       Net Profit After Tax - Prefernce Dividend
Earnings Per Share =
                                   No Equity Shares


D) RETURN ON CAPITAL EMPLOYED:
       Return on capital employed establishes the relationship between
profits and the capital employed. It is the primary ratio and is most widely
used to measure the overall profitability and efficiency of a business.
       The term capital employed refers to the total of investments made in a
business and can be defined in a number of ways. The three most widely
used definition of this term is
   I. Gross capital employed
  II. Net capital employed
 III. Proprietors net capital employed


GROSS CAPITAL EMPLOYED:
       The term gross capital employed usually comprises the total assets
used in a business.
       Gross capital employed = fixed assets+ current assets
NET CAPITAL EMPLOYED
       The term net capital employed comprises the total used in a business
less its current liabilities
       Net capital employed = Total assets- current liabilities


LORVEN EDUCATIONAL CENTRE                                                    28
ANALYSIS OF FINANCIAL WEALTH                        V.S.T. TILLERS TRACTORS LTD


PROPRIETOR’S NET CAPITAL EMPLOYED:
       Proprietor’s net capital employed means shareholders funds or
investment in the business.
       Proprietors net capital employed = fixed assets = current assets —
outside liabilities.


D) DIVIDEND YIELD RATIO:
       Shareholders are the real owners of a company and they are interested
in real sense in the earnings distributed and paid to them as dividends.
Therefore, dividend yield ratio is calculated to evaluate the relationship
between dividend per share paid and the market value of the share
                                 Dividend Per Equity Share
       Dividend Yeild Ratio =
                                Market Pr ice Per Equity Share


                              Dividend Paid to Shareholders
       Dividend Per Share =
                                Number of Equity Shares


E) DIVIDEND PAY OUT RATIO:
       Dividend pay out ratio is calculated to find the extent to which
earnings per share have been retained in the business. It is an important ratio
because Pouching back of profits enables a company to grow and pay more
dividends in future.
                                  Dividend Per Equity Share
       Dividend Pay Out Ratio =
                                     Earnings Per Share


F) PRICE EARNING RATIO:


LORVEN EDUCATIONAL CENTRE                                                    29
ANALYSIS OF FINANCIAL WEALTH                        V.S.T. TILLERS TRACTORS LTD


      Price earning ratio is the ratio between market price per equity share
and earnings per share. The ratio is calculated to make an estimate of
appreciation in the value of a share of a company and is widely used by
investors to decide whether or not to buy shares in a particular company.
                               Market Price Per Share
       Price Earning Ratio =
                                Earnings Per Share


G) EARNING YIELD RATIO:
      This ratio is also shows a relationship between earnings per share and
market value of shares.
                                 Earnings Per Share
       Earnings Yield Ratio =
                                Market Price Per Share


7. COST-VOLUME-PROFIT ANALYSIS:
      Cost-volume-profit analysis is a technique for studying the
relationship between cost, volume and profit. The CVP relationship is an
important tool used for the profit planning of a business. The study of cost-
volume-profit analysis is often referred to as break-even analysis. The term
break-even analysis is used in two senses, narrow sense and broad sense. In
its broad sense, break-even analysis refers to the study of relationship
between costs, volume and profit at different levels of sales or production. In
its narrow sense, it refers to a technique of determining that levels of
operations where total revenues equal total expenses that are the point of no
profit no loss.


LORVEN EDUCATIONAL CENTRE                                                    30
ANALYSIS OF FINANCIAL WEALTH                V.S.T. TILLERS TRACTORS LTD


                       RESEARCH METHODLOGY


TITLE OF THE STUDY:
   PROJECT REPORT ON “A STUDY ON RATIO ANALYSIS OF
   FINANCIAL WEALTH OF VST TILLERS TRACTORS LTD”.


STATEMENT OF THE PROBLEM
      Financial statements are the reports of stewardship (that is the
performance of management). They are the basis for formulation of
economic and financial policies and guide to dividend decision. Financial
statements help to determine the legality of dividend payment. They act as
the basis for granting credit and are very informative to prospective
investors. Financial statements serve as a proper guide to value the
investments already made in an enterprise and serve as a basis for taxation
and act as a basis for price regulation by the government. They serve as an
aid to government interference and supervision of a business enterprise.
      Financial statements are useful to various parties like the owners,
prospective investors, management, creditors, employees, government,
‘tenera1 public etc.


    OBJECTIVES OF THE STUDY

LORVEN EDUCATIONAL CENTRE                                                31
ANALYSIS OF FINANCIAL WEALTH                  V.S.T. TILLERS TRACTORS LTD


   1. To analyze the financial position of a VST tillers tractors ltd from the
      financial statement using tools of management accounting.

   2. To make detail analysis of each and every component of balance sheet
      of VST tillers tractors ltd.

   3. To Know the Operating Expenses of the VST tillers tractors ltd

   4. To assess the Profitability condition of the Company through
      analyzing the Balance sheet of the Company.

   5. To Assess the Rate of return of the Company


SCOPE OF THE STUDY:
      The study covers the financial analysis of the statement, which is
disclosed by the annual report of the Company. Overall performance of the
Company is assessed.

LIMITATIONS OF THE STUDY:
   1. Study restricted to2 to 3 years financial statement of the Company.

   2. The overall performance of the Company is analyzed and not branch
      wise.

   3. Few tools for analysis are used to analyze the financial statement.

   4. In-depth study of items of profit or loss account and balance sheet are
      not made.

   5. They say little about the firm’s prospects in an absolute sense.
   6. Their insights about relative performance require a reference point
      from other time periods or similar firms.


LORVEN EDUCATIONAL CENTRE                                                   32
ANALYSIS OF FINANCIAL WEALTH                  V.S.T. TILLERS TRACTORS LTD


   7. One ratio holds little meaning.
   8. As indicators, ratios can be logically interpreted in at least two ways.
      One can partially overcome this problem by combining several related
      ratios to paint a more comprehensive picture of the firm’s
      performance.


METHODOLOGY OF THE STUDY:
      All information for preparations of project is collected through annual
report of the Company and some information is collected through the books
maintained by Company and also through the employees of the Company
and some information from the website of the VST tillers tractors ltd.

SOURCES OF DATA
1. Primary Data-
      Primary data are the original data which originally collected by direct
interview with the Company for the 1 st time, about the statistical
investigation & and used by them in statistical analysis are formed as
Primary Data.
2. Secondary Data-
      These are the Data which might be published or unpublished have
already been collected and processed by same agency or person and take
over from some other agency.
Example-
Balance sheet, Profit & Loss account, Cash Flow Statement.


RESEARCH INSTURMENTS

LORVEN EDUCATIONAL CENTRE                                                  33
ANALYSIS OF FINANCIAL WEALTH                 V.S.T. TILLERS TRACTORS LTD


      The technique used for the Analysis is Ratio Analysis and
Comparative Balance Sheet etc. It is a most widely used and powerful tool
for Financial Statements Analysis. The ratios used for the study are
Liquidity ratio, Profitability Ratios, Solvency Ratios. Which includes Liquid
assets to total assets ratio and Liquid assets to total investments?
Profitability ratios such as Return on Assets, Return on Equity, Net Profit
Ratio etc. Long –term solvency ratios such as Proprietary Ratio etc.


                         COMPANY PROFILE:


LORVEN EDUCATIONAL CENTRE                                                 34
ANALYSIS OF FINANCIAL WEALTH                  V.S.T. TILLERS TRACTORS LTD


History of the company

      VST Tiller Tractors Ltd (VTTL) was incorporated in the year 1967 in
Bangalore India. It was promoted by the VST group, a well-known business
house in south India, in technology collaboration and joint venture with
Mitsubishi Heavy Industries and Mitsubishi; corporation Japan for the
manufacture of Tillers and diesel engines. The plant went into production in
the year 1970.

      In 1970, an additional technical and financial collaboration with
Mitsubishi Agriculture of 18.5 HP, 4-wheel drive tractor was entered into.

      The manufacturing plan is located in Whitefield industrial area near
Bangalore. It has 75,000 sq. meters, of land and a built up area of 15,000 sq.
meters (approx). The company has total personnel strength of about 500
employees as on date. The manufacturing capacity of the company is 12,000
power tillers, 16,000 engines and 2,500 tractors.

      Now, the company has come out of collaboration and joint venture
partnership. It has in house design and development section for upgrading
and updating the level of technology in line with current requirements. The
company is certified to ISO-9001 quality management system. Since Jan
1998 our company follows ISO-9001-2000 Quality Systems requirements to
satisfy all out customer needs.


LORVEN EDUCATIONAL CENTRE                                                    35
ANALYSIS OF FINANCIAL WEALTH                   V.S.T. TILLERS TRACTORS LTD


      The main product of the company namely Power tillers and Tractors
are used in the agriculture sector all over the country. Power Tillers, Tractors
are component parts are exported to countries such as Srilanka, Tanzania,
Zambia Ghaha, Cryprus, Europe, Austria, USA, Japan and Thailand.

      The company has set up a nation wide network of Dealers supported
by sales and service Organization. Adequate supply of spare parts, provision
of service tools and equipment, making available service information
through technical literature, instruction manuals etc, and imparting training
to dealer’s personnel as well as end users namely the farmers, are some of
the effective steps taken by the company towards customer satisfaction.

      With this objective, company was formulated its quality policy
achievement of an international quality standard is not a single event but an
ongoing commitment which remains as a continuous obligation and process.

      The plans set in place are designed to ensure that the continuous
commitment is a part of the operational policy of the company, with the help
of its people. The company will provide the best possible service to the
customers and strive for excellence in performance.

      Way back in 1920 the VST Group made a humble start by dealing in
petroleum products. Using this strong base, the Group quickly diversified
into automotive marketing and after-sales service. From this activity grew
the network of the organization throughout the southern states of Karnataka
and Tamil Nadu.


     The tradition and culture of the VST Group continues in this Company


LORVEN EDUCATIONAL CENTRE                                                    36
ANALYSIS OF FINANCIAL WEALTH                    V.S.T. TILLERS TRACTORS LTD


in spite of it having adopted new management techniques to face global
challenges.

         Over the years, VST Tillers Tractors Ltd. has established an extensive
and efficient countrywide sales and after-sales service network backed by
easy availability of spare parts. Periodic training programmes for Dealers
and customers are taken up to keep them constantly updated on
improvements on its products.

Type:
         The company is manufacturing sectors. It is located in white field
road.
Nature:
         The company is manufacturing the tractors, tillers and diesel engines.
The company has produced the goods and gives to dealers and increases the
sales.
Board of Directors:
         The board comprises of a Non-Executive Chairman, two whole time
Directors and six Non-Executives Directors. The constitution of the Board is
given below. During the year 2005-06, four Meeting of Board Of Directors
were held i.e., on November 2005 and 30th January 2006.
Mr. V.P. Mahendra                         Managing Directors
Mr. A.T. Nahender                         Directors (Operations)
Mr.v.v.Vijayandra                         Non-executive
Mr.v.k. Surendra                          Non-executive
Mr.V.T.Velu                               Non-executive
Mr.A.Hishikawa                            Non-executive
Mr.M.Tanaka                               Non-executive
Mr. R.Subbramanian                        Non-executive/independent
Mr.M.V.Bannerjee                          Non-executive/independent


LORVEN EDUCATIONAL CENTRE                                                     37
ANALYSIS OF FINANCIAL WEALTH                     V.S.T. TILLERS TRACTORS LTD


Mr.V.Ramachandran                        Non-executive/independent


ORGANIZATION CHART:

                        Directors (Operations)


                           Vice President


                          General Manager


                              Manager


                               Officer


                            Junior Officer


                             Supervisor


                              Workers


                 THE COMPANY' S VISION


VST Tillers Tractors Ltd. believes that the foundation of its business is to
provide
EXCELLENCE in its products through:


LORVEN EDUCATIONAL CENTRE                                                  38
ANALYSIS OF FINANCIAL WEALTH                   V.S.T. TILLERS TRACTORS LTD


High Quality and Reliability.
 Economical and Competitive Prices.
Efficient Services to the satisfaction of the customers.
In order to achieve these goals and attain market leadership,
it shall be the objective of every employee to strive to be


Future planes

          a) Higher horsepower Tractor as a variant to MT180D.
          b) Aesthetical improvement on power Tiller engines.
          c) Emission compliance of new series of engines for varied
             applications.


PRODUCT PROFILE

      Consequent to its long and close association with the Mitsubishi
Group of Companies, VST Tillers Tractors Ltd. Has effectively absorbed the
latest technology and work culture. This has resulted in the company's


LORVEN EDUCATIONAL CENTRE                                                39
ANALYSIS OF FINANCIAL WEALTH                  V.S.T. TILLERS TRACTORS LTD


achievement in perfecting every product it manufactures, meeting even the
most exacting requirements of the customer.


          Tillers                     Tractors           Diesel Engines

Tillers are classified as follows:


                                         Mitsubishi-Shakti VWH-120 Power
VST-Shakti 130 DI Power Tiller           Tiller


Tractors are classified as follows:


LORVEN EDUCATIONAL CENTRE                                                   40
ANALYSIS OF FINANCIAL WEALTH                 V.S.T. TILLERS TRACTORS LTD


            Euro tractors –VST             Mitsubishi-Shakti MT180D

180                                   Tractor

Features of Euro tractors:

        • Compact, Light weight, Four Wheel drive multipurpose tractor.
        • Fully confirms to safety regulations as specified by the Council
           of European Communities (EEC) with the following features:


           - EEC approved Roll Over Protection System (ROPS) for
            operator’s safety. Options:
            Regular ROPS - 'e' mark No. e11-0933.
             Foldable ROPS - 'e' mark No. e4-VI-028.


           - Independent hand operated brake system for additional
            safety.


           - 'e' Marked electrical signaling devices.
        • Option of two & Four Wheel drives for optimum engine power
           utilization.


LORVEN EDUCATIONAL CENTRE                                               41
ANALYSIS OF FINANCIAL WEALTH                 V.S.T. TILLERS TRACTORS LTD


         • Overriding PTO clutch to facilitate use of high inertia
            implements.
         • Live hydraulic system with adjustable implements position, and
            lowering speed control.
         • Elegant dash board with all necessary instruments

Diesel engines are classified as follows:


       130 DI                          AD8V


          K3C                         VWH 120


LORVEN EDUCATIONAL CENTRE                                              42
ANALYSIS OF FINANCIAL WEALTH              V.S.T. TILLERS TRACTORS LTD


FINANCIAL HIGHLIGHTS

     The financial results are summarized below

                                                              (Rs.in lakhs)
          Particulars                               Year            Year
                                                  2005-06          2004-05
     TURNOVER                                          1299            11086

     OTHER INCOME                                     165            186

     TOTAL INCOME                                     13164          11272

     PROFIT BEFORE DEPRECIATION &                     1563           1346
INTREST
                                                      137            171
     INTRESET
                                                      271            299
     DEPRECIATION
                                                      1155           876
     PROFIT BEFORE TAX
                                                      414            290
     INCOME TAX
                                                      741            586
     PROFIT AFTER TAX
                                                      497            575
     BALANCE B/F
                                                      1238           1161
     SURPLUS AVAILABLE FOR
APPROPRATION TO:                                      173            144

     DIVIDENT                                         24             20

     TAX ON DIVIDENT                                  500            500

     TRANSFER TO GENERAL RESERVE                      541            497

     BALANCE CARRIED FORWARD


LORVEN EDUCATIONAL CENTRE                                                  43
ANALYSIS OF FINANCIAL WEALTH               V.S.T. TILLERS TRACTORS LTD


Market share:

     The stock exchange or the Securities Exchange Board of India (SEBI)
 and / or any other statutory authority have not imposed any strictures /
 penalties on the company on any matters relating to capital market during
 the last three years


 Market Price Data:


 Month       Highest      Lowest       Month         Highest       Lowest
             price(Rs).   Price(Rs).                 price(Rs)     price(Rs)
 Apr - 05      71.90      66.15        Oct- 05         122.60      91.85
 May - 05       106.25    70.00        Nov- 05         113.05      97.75
 Jun - 05       121.6     102.05       Dec- 05         114.10      98.60
 Jul - 05       145.2     117.55       Jan- 06         116.60      106.25
 Aug- 05        128.95    112.55       Feb- 06         110.60      101.30
 Sept- 05       152.05    116.55       Mar- 06         105.30      91.75

Competitors:

         1. Channies – From China
         2. Campco – Kerla
         3. Sun Brand
         4. Hmt


Functional chart


LORVEN EDUCATIONAL CENTRE                                              44
ANALYSIS OF FINANCIAL WEALTH               V.S.T. TILLERS TRACTORS LTD


  MANAGEING                                                                        DGM-
  DIRECTOR                                                                         MKV


  DIRECTOR
                                                           GM-MK
  (OPERATION)
                       VP (BUSINESS
                       DEPATMENT)                                                  MKS

                                                                                  FIA
                        VP
                        (CHARMAN)                          GM-FI
                                                                                  FIC

                                                                                  FII

                                                        DGM-SPS
                                                                            SPS
                                           DGM-MF

                                                        MFA           MFM               MFP

                                       GM-EN

                                                        ENE /ENE                        ENP

                                      DGM-QA
                                                      QAC             QAV          QAM


                                       GM-IM               DGM-IM

                                                                      ISC         IMC/IMD
                                       GM-HR

                                                               HRD          HRW


                                              PGD / PDS (HR)         PDT
                                                                                  CE

                                                                     GAF


                                      GA             GAA                   GAS
Growths and Prospect


LORVEN EDUCATIONAL CENTRE                                                  45
ANALYSIS OF FINANCIAL WEALTH                   V.S.T. TILLERS TRACTORS LTD


      During the year under report, your company has been on a consistent
upward path in sales, profit and margins. The turnover increased by 17%
from Rs.111 crores in 2004-2005 to an all time high of 130 crores. The
operating profit increased by over 16% to 1563 lakhs due to higher
realization and lower interest cost. The profit after tax was higher by 26%
from 586 lakhs to 586 lakhs. Consequently, earnings per share grew from
Rs.10.17 to Rs.13.10 for 2005-2006. On the backdrop of the year with a
good financial performance your company is presently dept free. The sale of
power tillers increased to 8489 units as against the previous year sales of
7625 units. With respect to Tractors, your company sold 1249 unit as against
933 units an increase of 33%. This improvement in sales has been achieved
in line with the overall increase in demand complemented by better
government support prices for crops, opening new markets, normal
monsoons and availability of finance to farmers. The last factor plays a key
role since more then 80% of tractor sales are on credit.

      The performance of precision components division located continued
to be challenging due to lack of consistency in overseas orders. Due to a
sudden order cancellation, this division suffered losses on account of
underutilization of capacity during the year. In addition, the substantial
reduction in DEPB benefits on exports and increase in the price of steel and
other input material has had an adverse impact on margins. However a
subsequent increase in orders for supply of crankshafts and connecting rods
to one of its customers during the year has shored up its revenues thereby
achieving optimal production.


About VST Group:


LORVEN EDUCATIONAL CENTRE                                                     46
ANALYSIS OF FINANCIAL WEALTH                 V.S.T. TILLERS TRACTORS LTD


      Way back in 1920 the VST Group made a humble start by dealing in
petroleum products. Using this strong base, the Group quickly diversified
into automotive marketing with after sales service. From this activity grew
the network of the Organization throughout the southern states of Karnataka
and Tamil Nadu.


The VST Group has over 2000 employees and has a turnover of U.S.
$500 million p.a.


QUALITY POLICY

   • The Company will supply reliable products at competitive price with
      improved technology to the satisfaction of customers.
   • The Company shall ensure prompt and efficient after sales service
      backed by quality spare parts.
   • All employees in every function and level shall strive to achieve high
      quality of work through continuous improvement Guided by global
      quality system standards.


LORVEN EDUCATIONAL CENTRE                                                 47
ANALYSIS OF FINANCIAL WEALTH                  V.S.T. TILLERS TRACTORS LTD


   • Product costs shall be minimized without lowering quality and
     sustained
     efforts shall be made to reduce quality costs at all times

Sales and service of product:
      Over the years, VST Tillers Tractors Ltd., has established an
extensive and efficient countrywide sales and after-sales service network
backed by easy availability of spare parts. Periodic training programmes for
dealers and customers are taken up to keep them constantly updated on
improvements in its products.
      Keeping in line with India's liberalized economic policies and guided
by the conviction that quality products are marketable world wide, VST
Tillers Tractors Ltd., has successfully launched global marketing of its
products. It is marketing Diesel Engines, Power Tillers and Tractors to
regions of Asia, Middle East, Africa, Europe and United States of America.


SWOT ANALYSIS
                                STRENGTH
   • During the year review, the Indian economy witnessed a GDP growth
      rate of 8% with agriculture contributing around 2.4% and is estimated
      to grow to 3.2%.
   • The central and state governments continue to give priority to
      agriculture through various subsidy schemes.
   • This apart, Banks have promoted farm mechanization by providing
      timely finance which has generated good demand for power tillers and
      your company continues to maintain its lead in the power tiller
      industry in India by delivering a superior value product.


LORVEN EDUCATIONAL CENTRE                                                   48
ANALYSIS OF FINANCIAL WEALTH                  V.S.T. TILLERS TRACTORS LTD


  • The performance is even more satisfying when viewed in the light of
     the competitive pressure from low cost Chinese brand power tillers.
                             WEAKNESS
   • In the domestic tractor segment, the industry as a whole grew to
      262000 units during 2005-2006 from226000 units in the previous
      year.
   • The western and southern states of Maharashtra, Gujarat, AP,
      Karanataka and Kerala primarily contributed to the above growth.
   • Your company commands a niche market share in Maharashtra and
      Gujarat in the smaller HP tractor and sales in this segment are
      expected and sales in this segment are expected to grow in the
      coming year.
   • To cater to newer markets, the manufacturing capacities and
      aesthetics for tractors are being upgraded that will lead to higher
      revenue streams for the current year.
                               OPPORTUNITIES
   • The growth of the power tiller and tractor industry could be direly
      linked to the GDP growth of the Indian economy.
   • As mentioned above, the country’s GDP grew by a robust 8%
      making it one of the faster growing large economies in the world.
   • Easier and cheaper credit availability to farmer and awareness of the
      benefits to farmer mechanization provided opportunities for higher
      sales and optimum utilization of capacities.
   • The government’s policy on agriculture and the introduction of the
      Bharat Nirman Programme for creating massive rural infrastructure
      will directly benefit demand for your company’s product.

LORVEN EDUCATIONAL CENTRE                                                  49
ANALYSIS OF FINANCIAL WEALTH                V.S.T. TILLERS TRACTORS LTD


                                THREATS
   • Several importers realizing the business potential for power tillers
      have commenced imports to quickly capitalize on this front.
   • These tillers are low cost unit and qualify under subsidy schemes
      that could intensify competition thereby affecting demand in the
      future various strategies have been planned including a tie up with a
      Chinese tiller manufacture for marketing power tillers.
   • Your company is continuing to pursue strategies such as cutting
      casts, including manufacturing efficiencies, strengthening marketing
      initiatives and garner greater economies of scale to stay ahead.
   • During the year, importing duties have been reduced and further
      reduction in line with WTO obligations may affect demand in this
      price sensitive may affect demand in this price sensitive market
      which could bring down price further that may affect the demand
      pattern.


LORVEN EDUCATIONAL CENTRE                                                50
ANALYSIS OF FINANCIAL WEALTH                         V.S.T. TILLERS TRACTORS LTD


          RATIO ANALYSIS AND INTERPRETATION
                                    TABLE-1

Table showing the Current Ratio of the VST TILLERS TRACTORS
LTD for the Years 2003-2004 to 2005-2006


                                Current Assets
             Current Ratio =
                               Current liabilities


                                                               (Rs in Lakhs)

                  Current
   Year                              Current liabilities     current Ratio
                   Assets

 2003-2004        4534.88                   2056.55                2.21
 2004-2005        5184.93                   2094.54                2.48
 2005-2006        5088.99                   2558.01                1.99


ANALYSIS-
      The Current ratio of the VST TILLERS TRACTORS LTD for the
Year 2003-2004 was 2.21 %, for the Year 2004-2005 was 2.48%, and for the
Year 2005-2006 was 1.99%.
INFERENCE-
        2:1 is considered as standard for the ratio. In all three years, it is far
above than the ideal level. The Current Assets of the VST TILLERS
TRACTORS LTD for the Year 2004-2005 was 2.48% which much higher
when compared other two-year 2003-2004, 2005-2006.


LORVEN EDUCATIONAL CENTRE                                                      51
ANALYSIS OF FINANCIAL WEALTH              V.S.T. TILLERS TRACTORS LTD


                            GRAPH -1
Graph Showing the Current Ratio for the years 2003-2004 to 2005-2006


                         Current Ratio

            3
   Ratios


            2
            1     2.21             2.48               1.99
            0
                2003-2004       2004-2005          2005-2006
                                  years


LORVEN EDUCATIONAL CENTRE                                          52
ANALYSIS OF FINANCIAL WEALTH                           V.S.T. TILLERS TRACTORS LTD


                                     TABLE-2

Table showing the Liquid Ratio of the VST TILLERS TRACTORS
LTD for the Years 2003-2004 to 2005-2006


                                                Liquid Assets
Liquid Assets to current liabilities Ratio =
                                               Current liabilities


                                                                       (Rs in Lakhs)

    Year         Liquid Assets        Current liabilities            Liquid Ratio

 2003-2004           2506.02                   2056.55                    1.22
 2004-2005           3178.15                   2094.54                    1.52
 2005-2006           2926.66                   2558.01                    1.14


ANALYSIS
       The Liquid Assets of the VST TILLERS TRACTORS LTD for the
Year 2003-2004 was 1.22 %, for the Year 2004-2005 was 1.52%, and for the
Year 2005-2006 was 1.14%.
INFERENCE
The company has maintained its liquidity ratio above the standard level in

all the three years 2004-2005 was 1.52% more as compared to the year

2003-2004 and 2005-2006.


LORVEN EDUCATIONAL CENTRE                                                              53
ANALYSIS OF FINANCIAL WEALTH                  V.S.T. TILLERS TRACTORS LTD


                               GRAPH -2
Graph Showing the Liquid Assets to Current Liabilities Ratio for the
years 2003-2004 to 2005-2006


                               Liquid Ratio

            1.6
            1.4
            1.2
             1
   Ratios


            0.8                        1.52
            0.6     1.22                                   1.14
            0.4
            0.2
             0
                  2003-2004         2004-2005            2005-2006
                                      years


LORVEN EDUCATIONAL CENTRE                                              54
ANALYSIS OF FINANCIAL WEALTH                       V.S.T. TILLERS TRACTORS LTD


                                      TABLE-3

Table showing the Cash Ratio of the VST TILLERS TRACTORS LTD
for the Years 2003-2004 to 2005-2006
Cash Ratio =       Cash + Marketable Securities

                     Current Liabilities
              Cash & Bank Balances
          =
              Current Liabilities & Provisions
                                                             [Rupees in lakhs]

   Year                Cash            Current liabilities   Cash Ratio

 2003-2004            363.18                 2056.55              0.177
 2004-2005            535.18                 2094.54              0.255
 2005-2006            647.597                2558.01              0.253

ANALYSIS:

The above table indicates that the Cash ratio in the year 2003-04 was 0.177

in the year 2004-05 it was 0..255 and in the year 2005-06 it was 0.253.

INFERENCE:

The Cash ratio of the firm shows decreasing flow in the year 2003-2004 as

compared to 2004-2005 and increasing from in the year 2004-05 as

compared to 2005-06


LORVEN EDUCATIONAL CENTRE                                                        55
ANALYSIS OF FINANCIAL WEALTH            V.S.T. TILLERS TRACTORS LTD


                            GRAPH -3
Graph Showing the Cash Ratio for the years 2003-2004 to 2005-2006


                         Cash Ratio

             0.3
             0.2
    Ratios


             0.1                    0.255           0.253
                    0.177
              0
                   2003-2004     2004-2005        2005-2006
                                    years


LORVEN EDUCATIONAL CENTRE                                           56
ANALYSIS OF FINANCIAL WEALTH                            V.S.T. TILLERS TRACTORS LTD


                                        TABLE-4

Table showing the Liquid Assets to Total Assets Ratio of the VST
TILLERS TRACTORS LTD for the Years 2003-2004 to 2005-2006

                                        Liquid Assets
Liquid Assets to Total Assets Ratio =
                                        Total Assets

                                                                  (Rs in Lakhs)
                                                                Liquid Assets to
    Year         Liquid Assets             Total Assets         Total Assets
                                                                Ratio (%)
 2003-2004           2506.02                  7049.85                35.547
 2004-2005           3178.15                  7991.91                39.767
 2005-2006           2926.66                  7967.95                36.73


ANALYSIS-
       The Liquid Assets to Total Assets Ratio of the VST TILLERS
TRACTORS LTD for the Year 2003-2004 was 35.54%, for the Year 2004-
2005 was 39.767%, and for the Year 2005-2006 was 36.73%.
INFERENCE-
             The Liquid Assets to Total Assets Ratio of the VST TILLERS
TRACTORS LTD for the Year 2004-2005 was 39.767% which much higher
when compared other two-year 2003-2004, 2005-2006.


LORVEN EDUCATIONAL CENTRE                                                          57
ANALYSIS OF FINANCIAL WEALTH              V.S.T. TILLERS TRACTORS LTD


                             GRAPH -4
Graph Showing the Liquid Assets to Total Assets Ratio for the years
2003-2004 to 2005-2006


             Liquid Assets to Total Assets
        42
        40
        38
        36                   39.767
        34      35.547                     36.73
        32
              2003-2004 2004-2005 2005-2006

                             years


LORVEN EDUCATIONAL CENTRE                                             58
ANALYSIS OF FINANCIAL WEALTH                         V.S.T. TILLERS TRACTORS LTD


                                    TABLE-5

Table showing the Liquid Assets to Total Investments Ratio of the VST
TILLERS TRACTORS LTD for the Years 2003-2004 to 2005-2006


                                               Liquid Assets
Liquid Assets to Total investments Ratio =
                                             Total investments

                                                                  (Rs in Lakhs)

                 Liquid                                     Liquid Assets to Total
  Year                           Total investments
                 Assets                                          investments
                                                                    50.63
2003-2004        2506.02                 49.50
                                                                    62.60
2004-2005        3178.15                 50.77
                                                                    35.03
2005-2006        2926.66                 83.54


ANALYSIS:
      The Liquid Assets to Total Investments Ratio of the VST TILLERS
TRACTORS LTD for the Year 2003-2004 was 50.63%, for the Year 2004-
2005 was 62.60%, and for the Year 2005-2006 was 35.03%.


INFERENCE-
      The Liquid Assets to Total Investments Ratio of the VST TILLERS
TRACTORS LTD for the Year 2004-2005 was 62.60% which much higher
when compared to other two years 2003-2004, 2005-2006.


LORVEN EDUCATIONAL CENTRE                                                         59
ANALYSIS OF FINANCIAL WEALTH              V.S.T. TILLERS TRACTORS LTD


                               GRAPH-5
Graph Showing the Liquid Assets to Total Investments Ratio for the
years 2003-2004 to 2005-2006


                  Liquid Assets to Total
                    Investments Ratio

            100
   Ratios


            50
                   50.63           62.6            35.03
             0
                  2003-2004     2004-2005       2005-2006
                                   years


LORVEN EDUCATIONAL CENTRE                                            60
ANALYSIS OF FINANCIAL WEALTH                        V.S.T. TILLERS TRACTORS LTD


                                      TABLE-6

Table showing the Debt- Equity Ratio of the VST TILLERS
TRACTORS LTD for the Years 2003-2004 to 2005-2006


                         Long Term Debts
Debt - Equity Ratio =
                        Share holders Equity


                                                              (Rs in Lakhs)

   Year             Debt                   Equity        Debt- Equity Ratio

2003-2004          2056.59                3780.86               53.75

2004-2005          2094.54                4193.33               49.94

2005-2006          2558.01                4758.72               53.74


ANALYSIS:
Debt Equity Ratio of VST TILLERS TRACTORS LTD for the Year 2003-
2004 was 53.75%, for the Year 2004-2005 was 49.94%, and for the Year 05-
06 was 53.74%.
INFERENCE:
         When the Firm’s Debt-Equity Ratio is high it indicates that the firm
has to face difficulty in meeting its fixed obligation. Lower the Ratio it is
less difficult to meet its fixed obligation. In the Year 2004-2005 the Debt
Equity Ratio of VST TILLERS TRACTORS LTD is 49.94% which much
lower when compared to the other two year 2003-2004, 2005-2006.


LORVEN EDUCATIONAL CENTRE                                                     61
ANALYSIS OF FINANCIAL WEALTH            V.S.T. TILLERS TRACTORS LTD


                             GRAPH-6
Graph Showing the Debt Equity Ratio for the years 2003-2004 to
2005-2006


                   Debt- Equity Ratio

            56
            54
   Ratios


            52
            50     54.39                            53.75
            48                     49.94
            46
                 2003-2004      2004-2005        2005-2006
                                   years


                             TABLE-7


LORVEN EDUCATIONAL CENTRE                                        62
ANALYSIS OF FINANCIAL WEALTH                  V.S.T. TILLERS TRACTORS LTD


Table showing the Proprietary Ratio of the VST TILLERS
TRACTORS LTD for the Years 2003-2004 to 2005-2006


                      Shareholders Funds
Proprietory Ratio =
                         Total Assets


                                                          (Rs in Lakhs)
                      Share Holders                          Proprietary
    Year                                   Total Assets
                           Funds                              Ratio (%)
 2003-2004                3780.86            7099.89            53.25

 2004-2005                4193.33            8020.97            52.27

 2005-2006                4758.72            8116.95            58.63


ANALYSIS
      The Proprietary Ratio of the VST TILLERS TRACTORS LTD for the
year 2003-2004 was 53.25% the year 2004-2005 was 52.27%, and for the
year 2005-2006 was 58.63%.
INFERENCE
      Higher the Proprietary Ratio, Greater the Long Term stability for the
Firm, the firms Proprietary Ratio in the year 2005-2006 is 58.63% which is
Higher when compared to the other two years 2003-2004, 2004-2005.


LORVEN EDUCATIONAL CENTRE                                                  63
ANALYSIS OF FINANCIAL WEALTH             V.S.T. TILLERS TRACTORS LTD


                             GRAPH-7

Graph Showing the Proprietary Ratio for the years 2003-2004 to 2005-
2006


                     propretory ratio

            60
            55
   ratios


                                                     58.63
            50     53.25           52.28
            45
                 2003-2004       2004-2005        2005-2006
                                   years


                             TABLE-8


LORVEN EDUCATIONAL CENTRE                                          64
ANALYSIS OF FINANCIAL WEALTH                        V.S.T. TILLERS TRACTORS LTD


Table showing the Fixed Assets to Net worth Ratio of the VST
TILLERS TRACTORS LTD for the Years 2003-2004 to 2005-2006

                                    Fixed Assets
 Fixed Assets to Networth Ratio =
                                     Networth

                                                              (Rs in Lakhs)

                                                                Fixed Assets to
     Year            Fixed Assets              Net worth          Net worth
                                                                  Ratio (%)
   2003-2004            2514.98                    3780.86          66.52

   2004-2005            5184.93                    4193.33          123.64

   2005-2006            5088.99                    4738.72          107.39


ANALYSIS –
      The Fixed Asset to Net worth Ratio of the VST TILLERS
TRACTORS LTD for the year 2003-2004 was 66.52%, for the Year 2004-
2005 was 123.64%, and for the Year 2005-2006 was 107.39%.


INFERENCE-
      The Fixed Asset to Net worth Ratio of the VST TILLERS
TRACTORS LTD for the year 2004-2005 was 123.64%, which is higher
when compared to other two years 2003-2004, 2005-2006.


LORVEN EDUCATIONAL CENTRE                                                     65
ANALYSIS OF FINANCIAL WEALTH                V.S.T. TILLERS TRACTORS LTD


                               GRAPH-8
Graph Showing the Fixed Assets to Net worth Ratio for the years2003-
2004 to 2005-2006


                       Fixed Assets to Networth Ratio

           140
           120
           100
            80
  ratios


            60                         123.64
                                                          107.39
            40      66.52
            20
             0
                 2003-2004           2004-2005           2005-2006
                                       Years


                               TABLE-9


LORVEN EDUCATIONAL CENTRE                                            66
ANALYSIS OF FINANCIAL WEALTH                        V.S.T. TILLERS TRACTORS LTD


Table showing the Liquid Asset to Net worth Ratio of the VST
TILLERS TRACTORS LTD for the Years 2003-2004 to 2005-2006

                                    Liquid Assets
Liquid Assets to Networth Ratio =
                                      Networth

                                                              (Rs in Lakhs)

                                                            Liquid Asset to
    Year           Liquid Assets             Net worth      Net worth Ratio

 2003-2004            2506.02                  3780.86            .6652

 2004-2005            3178.15                  4193.33           1.2364

 2005-2006            2926.66                  4738.72           1.0739


ANALYSIS-

         The Liquid Asset to Net worth Ratio of the VST TILLERS
TRACTORS LTD for the year 2003-2004 was .6652 Times, for the Year
2004-2005 was 1.2364 Times and for the Year 2005-2006 was 1.0739
Times.
INFERENCE-
      The Liquid Asset to Net worth Ratio of the VST TILLERS
TRACTORS LTD for the year 2004-2005 was 1.2364 Times which is much
higher when compared to other two year 2003-2004, 2005-2006.


LORVEN EDUCATIONAL CENTRE                                                     67
ANALYSIS OF FINANCIAL WEALTH                         V.S.T. TILLERS TRACTORS LTD


                             GRAPH-9
Graph Showing the Liquid Assets to Net worth Ratio for the years
2003-2004 to 2005-2006


                            Liquid Asset to Networth Ratio

          1.4
          1.2
           1
          0.8
 ratios


          0.6                               1.2364
                                                                   1.0739
          0.4
                 0.6652
          0.2
           0
                2003-2004                 2004-2005               2005-2006
                                            Years


                                   TABLE-10


LORVEN EDUCATIONAL CENTRE                                                     68
ANALYSIS OF FINANCIAL WEALTH                     V.S.T. TILLERS TRACTORS LTD


Table showing the Net Profit Ratio of the VST TILLERS TRACTORS
LTD for the Years 2003-2004 to 2005-2006
                           Net Profit
            Net Profit =              *100
                            Sales

                                                             (Rs In Lakhs)
                                                           Net Profit Ratio
     Year             Net Profit              Sales
                                                                 (%)
  2003-2004                578.56            10313.75            5.60

  2004-2005                585.84            11272.43            5.19

  2005-2006                741.66            13164.67            5.633


ANALYSIS-
      The Net Profit Ratio of the VST TILLERS TRACTORS LTD for the
Year 2003-2004 was 5.60%, for the year 2004-2005 was 5.19%, and for the
year 2005-2006 was 5.633%.


INFERENCE-
Net Profit ratio indicates the efficiency of the firm’s. Higher the Net Profit it
indicates the firm is Positive and in an advantageous position. The Net Profit
Ratio of the VST TILLERS TRACTORS LTD during the year 2005-2006
was 5.633% which much higher when compared to other two years 2003-
2004, 2004-2005.


LORVEN EDUCATIONAL CENTRE                                                      69
ANALYSIS OF FINANCIAL WEALTH                  V.S.T. TILLERS TRACTORS LTD


                            GRAPH-10
Graph Showing the Net Profit Ratio for the years 2003-2004 to 2005-
2006


                             Net profit ratio

          5.7
          5.6
          5.5
          5.4
 ratios


          5.3
                  5.61                                        5.6
          5.2
          5.1
                                       5.19
            5
          4.9
                2003-2004           2004-2005              2005-2006
                                      years


           .


                             TABLE-11

LORVEN EDUCATIONAL CENTRE                                              70
ANALYSIS OF FINANCIAL WEALTH                        V.S.T. TILLERS TRACTORS LTD


Table showing the Inventory Ratio of the VST TILLERS TRACTORS
LTD for the Years 2003-2004 to 2005-2006


                                Inventory
          Inventory Ratio =                  *100
                              Current Assets


      (Rs in Lakhs)

                                       Current           Inventory
   Year         Inventory
                                        Assets           Ratio in %

 2003-2004        2028.86              4534.88              44.74
 2004-2005        2006.77              5184.93              38.7
 2005-2006        2162.33              5088.99              42.49


ANALYSIS:

The above table indicates that the inventory ratio in the year 2003-04 was

44.74%, in the year 2004-05 it was 38.70% and in the year 2005-06 it was

42.49%.

INFERENCE:

The ratio shows the up and downfall trend. In the year 2003-04, it is

recorded the highest (44.74%) and lowest (38.7%) in the year 2004-05.


LORVEN EDUCATIONAL CENTRE                                                    71
ANALYSIS OF FINANCIAL WEALTH              V.S.T. TILLERS TRACTORS LTD


                             GRAPH-11
Graph Showing the Inventory Ratio for the years 2003-2004 to 2005-
2006


                     Inventory Ratio

            50
   Ratios


            45
            40     44.74                            42.49
                                   38.7
            35
                 2003-2004      2004-2005        2005-2006
                                  years


LORVEN EDUCATIONAL CENTRE                                            72
ANALYSIS OF FINANCIAL WEALTH                     V.S.T. TILLERS TRACTORS LTD


                                      TABLE-12

Table showing Operating Profit Ratio of the VST TILLERS
TRACTORS LTD for the Years 2003-2004 to 2005-2006

                       Gross profit
Gross Profit Ratio =                *100
                          Sales


                                                           (Rs in Lakhs)

                                                           Operating
      Year               Gross profit       Sales         Profit Ratio
                                                              (%)
   2003-2004                3717.59        10403.92          35.73

   2004-2005                3599.35        11272.43           31.93

   2005-2006               21709.17        13164.67         164.91


ANALYSIS-

      The Operating Profit Ratio the VST TILLERS TRACTORS LTD for
the year 2003-2004 was 35.73%, for the year 2004-2005 was 31.93%, and
for the year 2005-2006 was 164.91%.


INFERENCE
        The Gross Profit Ratio of the VST TILLERS TRACTORS LTD
during the year 2005-2006 was 164.91% which much higher when compared
to the other two year 2003-2004, 2004-2005.


LORVEN EDUCATIONAL CENTRE                                                  73
ANALYSIS OF FINANCIAL WEALTH                  V.S.T. TILLERS TRACTORS LTD


                             GRAPH-12
Graph Showing the Operating Profit Ratio for the years2003-2004 to
2005-2006


                            Gross profit ratio

          200

          150
 Ratios


          100
                                                           164.91
          50
                 35.73                31.93
           0
                2003-2004           2004-2005             2005-2006
                                      Years


                             TABLE-13

LORVEN EDUCATIONAL CENTRE                                              74
ANALYSIS OF FINANCIAL WEALTH                      V.S.T. TILLERS TRACTORS LTD


Table showing Return on Equity funds Ratio of the VST TILLERS
TRACTORS LTD for the Years 2003-2004 to 2005-2006

                                  Profit After Tax
   Return on Equity Funds =
                              Equity Shareholders fund


                                                            (Rs in Lakhs)
                                                             Return on
    Year       Profit After Tax             Net worth       Equity funds
                                                                (%)
 2003-2004           578.56                  3780.86            15.3

 2004-2005           585.84                  4193.33            13.97

 2005-2006           741.66                  4738.72            15.65


ANALYSIS-
      The Return on Equity Ratio of the VST TILLERS TRACTORS LTD
for the Year 2003-2004 was 15.3%, for the year 2004-2005 was 13.9%, and
for the year 2005-2006 was 15.65%.


INFERENCE-
      The Return on Equity Ratio shows the profit percentage of the Equity
shareholders. The investors favor higher Return on Equity Ratio. The Return
on Equity Ratio of the VST TILLERS TRACTORS LTD for the Year 2005-
2006 was 15.65%, which is higher when compared to the other two years
2003-2004, 2004-2005.


LORVEN EDUCATIONAL CENTRE                                                   75
ANALYSIS OF FINANCIAL WEALTH                         V.S.T. TILLERS TRACTORS LTD


                                   GRAPH-13
Graph Showing the Return on Equity funds Ratio for the years2003-
2004 to 2005-2006


                             Return on Equity funds Ratio

           16
          15.5
           15
 Ratios


          14.5
                                                                   15.65
                   15.3
           14
          13.5                               13.97
           13
                 2003-2004                 2004-2005             2005-2006
                                            years


           .


                                    TABLE-14


LORVEN EDUCATIONAL CENTRE                                                     76
ANALYSIS OF FINANCIAL WEALTH                        V.S.T. TILLERS TRACTORS LTD


Table showing Earnings Per Share Ratio of the VST TILLERS
TRACTORS LTD for the Years 2003-2004 to 2005-2006

                            Net Profit After Tax
   Earnings Per Share =
                          Number of Equity Shares


                                                              (In Rs)

                   Net Profit After       No of Equity        Earnings Per
     Year                tax                Shares            Share Ratio
                                                                (In Rs)
  2003-2004           57855631               5759685             10.04
  2004-2005           58583878               5759685             10.17
  2005-2006           74166443               5759685             12.88


ANALYSIS
      The Earnings per Share Ratio of the VST TILLERS TRACTORS
LTD for the Year 2003-2004 was 10.04 Rs, for the year 2004-2005 was
10.17 Rs, for the year 2005-2006 12.88 Rs.


INFERENCE-
      This Ratio measures the Profitability in terms of the Earnings per
share. The earnings per share of the VST TILLERS TRACTORS LTD in the
year 2005-2006 was 12.88 which is higher than the other two years 2003-
2004, 2004-2005.


LORVEN EDUCATIONAL CENTRE                                                    77
ANALYSIS OF FINANCIAL WEALTH                 V.S.T. TILLERS TRACTORS LTD


                            GRAPH-14
Graph Showing the Earnings per Share Ratio for the years2003-2004 to
2005-2006


                          Earnings Per Share

 14
 12
 10
  8
  6                                                        12.88
              10.04               10.17
  4
  2
  0
            2003-2004            2004-2005               2005-2006


                            TABLE-15


LORVEN EDUCATIONAL CENTRE                                             78
ANALYSIS OF FINANCIAL WEALTH                      V.S.T. TILLERS TRACTORS LTD


Table showing Return on Assets Ratio of the VST TILLERS
TRACTORS LTD for the Years 2003-2004 to 2005-2006
                     Net Profit after Tax
Return on Assets =
                        Total Assets


                                                            (Rs in Lakhs)
                      Net Profit after      Total Assets     Return on
      Year                                                  Assets Ratio
                             Tax
                                                                (%)
   2003-2004                578.56            7099.89           8.15

   2004-2005                585.84            8020.97           7.30

   2005-2006                741.66            8116.95           9.14


ANALYSIS-
      Return on Assets of the VST TILLERS TRACTORS LTD for the
Year 2003-2004 was 8.15%, for the Year 2004-2005 was 7.30%, and for the
year 2005-2006 was 9.14%.


INFERENCES-
      The Return on Assets Ratio of the VST TILLERS TRACTORS LTD
for the year 2005-2006 was 9.14% which much higher when compared to
other two year 2003-2004, 2004-2005.


LORVEN EDUCATIONAL CENTRE                                                   79
ANALYSIS OF FINANCIAL WEALTH                 V.S.T. TILLERS TRACTORS LTD


                            GRAPH-15
Graph Showing the Return on Assets Ratio for the years 2003-2004 to
2005-2006


                        Return on Assets Ratio

 10

  8

  6
                                                           9.14
  4           8.15                 7.3
  2

  0
            2003-2004            2004-2005               2005-2006
                                  Years


SUMMARY OF FINDINGS AND CONCLUSION


                            FINDINGS

LORVEN EDUCATIONAL CENTRE                                             80
A study on ratio analysis at vst tillers tractors final

Weitere ähnliche Inhalte

Was ist angesagt?

Indian Tractor Market : Perspective & Analysis
Indian Tractor Market : Perspective & AnalysisIndian Tractor Market : Perspective & Analysis
Indian Tractor Market : Perspective & AnalysisVivek Singhal
 
strategic analysis of mahindra tractor
strategic analysis of mahindra tractorstrategic analysis of mahindra tractor
strategic analysis of mahindra tractorSitansu Sekhar
 
109541595 sonalika-tractors-ltd
109541595 sonalika-tractors-ltd109541595 sonalika-tractors-ltd
109541595 sonalika-tractors-ltdTekken Striker
 
Projet report swaraj 2013
Projet report swaraj 2013Projet report swaraj 2013
Projet report swaraj 2013Rishabh Kaushik
 
Mahindra tractor Project Report
Mahindra tractor Project ReportMahindra tractor Project Report
Mahindra tractor Project ReportMahindra Tractors
 
Marketing strategies of mahindra tractors
Marketing strategies of mahindra tractorsMarketing strategies of mahindra tractors
Marketing strategies of mahindra tractorsaniljat
 
Tata Motors Company Analysis Report 2015-2016
Tata Motors Company Analysis Report 2015-2016Tata Motors Company Analysis Report 2015-2016
Tata Motors Company Analysis Report 2015-2016Rahul Gulaganji
 
mahindra & mahindra automakers
mahindra & mahindra automakersmahindra & mahindra automakers
mahindra & mahindra automakersGurkirat Dhaliwal
 
Farm Machinery Uses and Agricultural Machinery Industries in India: Status, E...
Farm Machinery Uses and Agricultural Machinery Industries in India: Status, E...Farm Machinery Uses and Agricultural Machinery Industries in India: Status, E...
Farm Machinery Uses and Agricultural Machinery Industries in India: Status, E...essp2
 
Mahindra Tractors Growth Strategy
Mahindra Tractors Growth StrategyMahindra Tractors Growth Strategy
Mahindra Tractors Growth StrategySaurabh Pandey
 
Tata motors - International Business Project Report
Tata motors - International Business Project ReportTata motors - International Business Project Report
Tata motors - International Business Project ReportPrathamesh Gawane
 
Complete analysis of Mahindra & Mahindra
Complete analysis of Mahindra & MahindraComplete analysis of Mahindra & Mahindra
Complete analysis of Mahindra & MahindraSantosh Tiwari
 
Mahindra and Mahindra Case Study
Mahindra and Mahindra Case StudyMahindra and Mahindra Case Study
Mahindra and Mahindra Case StudyAtish Chattopadhyay
 
TATA MOTORS - SW ERA- Micro economics
TATA MOTORS - SW ERA- Micro economics TATA MOTORS - SW ERA- Micro economics
TATA MOTORS - SW ERA- Micro economics MayankAgrawal205
 

Was ist angesagt? (20)

Eicher motors
Eicher motorsEicher motors
Eicher motors
 
Indian Tractor Market : Perspective & Analysis
Indian Tractor Market : Perspective & AnalysisIndian Tractor Market : Perspective & Analysis
Indian Tractor Market : Perspective & Analysis
 
strategic analysis of mahindra tractor
strategic analysis of mahindra tractorstrategic analysis of mahindra tractor
strategic analysis of mahindra tractor
 
109541595 sonalika-tractors-ltd
109541595 sonalika-tractors-ltd109541595 sonalika-tractors-ltd
109541595 sonalika-tractors-ltd
 
Projet report swaraj 2013
Projet report swaraj 2013Projet report swaraj 2013
Projet report swaraj 2013
 
Mahindra tractor Project Report
Mahindra tractor Project ReportMahindra tractor Project Report
Mahindra tractor Project Report
 
Royal enfield
Royal enfield Royal enfield
Royal enfield
 
Marketing strategies of mahindra tractors
Marketing strategies of mahindra tractorsMarketing strategies of mahindra tractors
Marketing strategies of mahindra tractors
 
Tata Motors Company Analysis Report 2015-2016
Tata Motors Company Analysis Report 2015-2016Tata Motors Company Analysis Report 2015-2016
Tata Motors Company Analysis Report 2015-2016
 
mahindra & mahindra automakers
mahindra & mahindra automakersmahindra & mahindra automakers
mahindra & mahindra automakers
 
ashok leyland
ashok leylandashok leyland
ashok leyland
 
Farm Machinery Uses and Agricultural Machinery Industries in India: Status, E...
Farm Machinery Uses and Agricultural Machinery Industries in India: Status, E...Farm Machinery Uses and Agricultural Machinery Industries in India: Status, E...
Farm Machinery Uses and Agricultural Machinery Industries in India: Status, E...
 
Mahindra Tractors Growth Strategy
Mahindra Tractors Growth StrategyMahindra Tractors Growth Strategy
Mahindra Tractors Growth Strategy
 
Tata motors - International Business Project Report
Tata motors - International Business Project ReportTata motors - International Business Project Report
Tata motors - International Business Project Report
 
HYUNDAI-Internship
HYUNDAI-InternshipHYUNDAI-Internship
HYUNDAI-Internship
 
Mahindra and mahindra
Mahindra and mahindraMahindra and mahindra
Mahindra and mahindra
 
Group 5 hero motocorp
Group 5  hero motocorpGroup 5  hero motocorp
Group 5 hero motocorp
 
Complete analysis of Mahindra & Mahindra
Complete analysis of Mahindra & MahindraComplete analysis of Mahindra & Mahindra
Complete analysis of Mahindra & Mahindra
 
Mahindra and Mahindra Case Study
Mahindra and Mahindra Case StudyMahindra and Mahindra Case Study
Mahindra and Mahindra Case Study
 
TATA MOTORS - SW ERA- Micro economics
TATA MOTORS - SW ERA- Micro economics TATA MOTORS - SW ERA- Micro economics
TATA MOTORS - SW ERA- Micro economics
 

Andere mochten auch

B. D. J. International, Ghaziabad, Agriculture Equipment
B. D. J. International, Ghaziabad, Agriculture Equipment  	 B. D. J. International, Ghaziabad, Agriculture Equipment
B. D. J. International, Ghaziabad, Agriculture Equipment IndiaMART InterMESH Limited
 
Project Report TAFE final
Project Report TAFE finalProject Report TAFE final
Project Report TAFE finalSai Chaitanya
 
An analysis on inventory management at whirlpool of india limited
An analysis on inventory management at whirlpool of india limitedAn analysis on inventory management at whirlpool of india limited
An analysis on inventory management at whirlpool of india limitedjaspreetharpreet
 
CV-Ramachandra
CV-RamachandraCV-Ramachandra
CV-Ramachandrarla2011g
 
Tractor and farm equipment limited
Tractor and farm equipment limitedTractor and farm equipment limited
Tractor and farm equipment limitedGokul S
 
Understanding your rights under the EQC Act 1993 and your Insurance Policy (K...
Understanding your rights under the EQC Act 1993 and your Insurance Policy (K...Understanding your rights under the EQC Act 1993 and your Insurance Policy (K...
Understanding your rights under the EQC Act 1993 and your Insurance Policy (K...EQCfix New Zealand
 
Elements of Claims Settlement (Kaikoura Meeting)
Elements of Claims Settlement (Kaikoura Meeting)Elements of Claims Settlement (Kaikoura Meeting)
Elements of Claims Settlement (Kaikoura Meeting)EQCfix New Zealand
 
Presentation anil
Presentation anilPresentation anil
Presentation anilAnil Aks
 
VST Tillers Tractors ltd (NSE Code VSTTILLERS) - Katalyst Wealth Alpha Recomm...
VST Tillers Tractors ltd (NSE Code VSTTILLERS) - Katalyst Wealth Alpha Recomm...VST Tillers Tractors ltd (NSE Code VSTTILLERS) - Katalyst Wealth Alpha Recomm...
VST Tillers Tractors ltd (NSE Code VSTTILLERS) - Katalyst Wealth Alpha Recomm...Katalyst Wealth
 
Iist of finance projects
Iist of finance  projectsIist of finance  projects
Iist of finance projectsBabasab Patil
 
A project report on orgnoziation study of tata motors
A project report on  orgnoziation study of tata motorsA project report on  orgnoziation study of tata motors
A project report on orgnoziation study of tata motorsBabasab Patil
 
Data analysis and Interpretation
Data analysis and InterpretationData analysis and Interpretation
Data analysis and InterpretationMehul Gondaliya
 

Andere mochten auch (14)

B. D. J. International, Ghaziabad, Agriculture Equipment
B. D. J. International, Ghaziabad, Agriculture Equipment  	 B. D. J. International, Ghaziabad, Agriculture Equipment
B. D. J. International, Ghaziabad, Agriculture Equipment
 
Project Report TAFE final
Project Report TAFE finalProject Report TAFE final
Project Report TAFE final
 
An analysis on inventory management at whirlpool of india limited
An analysis on inventory management at whirlpool of india limitedAn analysis on inventory management at whirlpool of india limited
An analysis on inventory management at whirlpool of india limited
 
CV-Ramachandra
CV-RamachandraCV-Ramachandra
CV-Ramachandra
 
Inventory accounting theory
Inventory accounting theoryInventory accounting theory
Inventory accounting theory
 
Tractor and farm equipment limited
Tractor and farm equipment limitedTractor and farm equipment limited
Tractor and farm equipment limited
 
Understanding your rights under the EQC Act 1993 and your Insurance Policy (K...
Understanding your rights under the EQC Act 1993 and your Insurance Policy (K...Understanding your rights under the EQC Act 1993 and your Insurance Policy (K...
Understanding your rights under the EQC Act 1993 and your Insurance Policy (K...
 
Elements of Claims Settlement (Kaikoura Meeting)
Elements of Claims Settlement (Kaikoura Meeting)Elements of Claims Settlement (Kaikoura Meeting)
Elements of Claims Settlement (Kaikoura Meeting)
 
Presentation anil
Presentation anilPresentation anil
Presentation anil
 
VST Tillers Tractors ltd (NSE Code VSTTILLERS) - Katalyst Wealth Alpha Recomm...
VST Tillers Tractors ltd (NSE Code VSTTILLERS) - Katalyst Wealth Alpha Recomm...VST Tillers Tractors ltd (NSE Code VSTTILLERS) - Katalyst Wealth Alpha Recomm...
VST Tillers Tractors ltd (NSE Code VSTTILLERS) - Katalyst Wealth Alpha Recomm...
 
Iist of finance projects
Iist of finance  projectsIist of finance  projects
Iist of finance projects
 
K to 12 Horticulture Learning Module
K to 12 Horticulture Learning ModuleK to 12 Horticulture Learning Module
K to 12 Horticulture Learning Module
 
A project report on orgnoziation study of tata motors
A project report on  orgnoziation study of tata motorsA project report on  orgnoziation study of tata motors
A project report on orgnoziation study of tata motors
 
Data analysis and Interpretation
Data analysis and InterpretationData analysis and Interpretation
Data analysis and Interpretation
 

Ähnlich wie A study on ratio analysis at vst tillers tractors final

Tractor file (prjct)
Tractor file (prjct)Tractor file (prjct)
Tractor file (prjct)mayank jain
 
Motorbikes by pablo climent
Motorbikes by pablo climentMotorbikes by pablo climent
Motorbikes by pablo climentclireba
 
Automobile industry
Automobile industryAutomobile industry
Automobile industryPon prakash
 
HRM_PROJECT_HERO_latest.docx
HRM_PROJECT_HERO_latest.docxHRM_PROJECT_HERO_latest.docx
HRM_PROJECT_HERO_latest.docxTsure1
 
(37)history of ashok leyland ppt hari master piece
(37)history of ashok leyland ppt hari master piece(37)history of ashok leyland ppt hari master piece
(37)history of ashok leyland ppt hari master piecehariharanmasterpiece
 
Tractor for Sale
Tractor for SaleTractor for Sale
Tractor for SaleVamsiram15
 
Sip report the study of shipping & logistics management at hero moto corp.
Sip report   the study of shipping & logistics management at hero moto corp.Sip report   the study of shipping & logistics management at hero moto corp.
Sip report the study of shipping & logistics management at hero moto corp.Aniket Patil
 
TAFE | Engines | Silent Gensets | Tractors and Farm Equipments
TAFE | Engines | Silent Gensets | Tractors and Farm EquipmentsTAFE | Engines | Silent Gensets | Tractors and Farm Equipments
TAFE | Engines | Silent Gensets | Tractors and Farm EquipmentsAllwenstewart
 
ZIGWHEELS FINALS
ZIGWHEELS FINALSZIGWHEELS FINALS
ZIGWHEELS FINALSSwathi PG
 
TRACTOR POWER REPORT -AE 215 SOURCES OF FARM POWER 2018
TRACTOR POWER REPORT -AE 215  SOURCES OF FARM POWER 2018TRACTOR POWER REPORT -AE 215  SOURCES OF FARM POWER 2018
TRACTOR POWER REPORT -AE 215 SOURCES OF FARM POWER 2018musadoto
 

Ähnlich wie A study on ratio analysis at vst tillers tractors final (20)

Tractor file (prjct)
Tractor file (prjct)Tractor file (prjct)
Tractor file (prjct)
 
Ramesh
RameshRamesh
Ramesh
 
Honda motors project report
Honda motors project reportHonda motors project report
Honda motors project report
 
Motorbikes by pablo climent
Motorbikes by pablo climentMotorbikes by pablo climent
Motorbikes by pablo climent
 
Caterpillar
CaterpillarCaterpillar
Caterpillar
 
project of mba
project of mbaproject of mba
project of mba
 
Automobile industry
Automobile industryAutomobile industry
Automobile industry
 
ASHOK LEYLAND
ASHOK LEYLANDASHOK LEYLAND
ASHOK LEYLAND
 
HRM_PROJECT_HERO_latest.docx
HRM_PROJECT_HERO_latest.docxHRM_PROJECT_HERO_latest.docx
HRM_PROJECT_HERO_latest.docx
 
(37)history of ashok leyland ppt hari master piece
(37)history of ashok leyland ppt hari master piece(37)history of ashok leyland ppt hari master piece
(37)history of ashok leyland ppt hari master piece
 
Royal Enfield
Royal Enfield Royal Enfield
Royal Enfield
 
Automobile module1
Automobile module1Automobile module1
Automobile module1
 
Tractor for Sale
Tractor for SaleTractor for Sale
Tractor for Sale
 
Power Harrow
Power HarrowPower Harrow
Power Harrow
 
Template 1
Template 1Template 1
Template 1
 
Types of tractors kvg
Types of tractors kvgTypes of tractors kvg
Types of tractors kvg
 
Sip report the study of shipping & logistics management at hero moto corp.
Sip report   the study of shipping & logistics management at hero moto corp.Sip report   the study of shipping & logistics management at hero moto corp.
Sip report the study of shipping & logistics management at hero moto corp.
 
TAFE | Engines | Silent Gensets | Tractors and Farm Equipments
TAFE | Engines | Silent Gensets | Tractors and Farm EquipmentsTAFE | Engines | Silent Gensets | Tractors and Farm Equipments
TAFE | Engines | Silent Gensets | Tractors and Farm Equipments
 
ZIGWHEELS FINALS
ZIGWHEELS FINALSZIGWHEELS FINALS
ZIGWHEELS FINALS
 
TRACTOR POWER REPORT -AE 215 SOURCES OF FARM POWER 2018
TRACTOR POWER REPORT -AE 215  SOURCES OF FARM POWER 2018TRACTOR POWER REPORT -AE 215  SOURCES OF FARM POWER 2018
TRACTOR POWER REPORT -AE 215 SOURCES OF FARM POWER 2018
 

Mehr von Anantha Bellary (20)

An Organisational study at TUMUL, Tumkur, Karnataka
An Organisational study at TUMUL, Tumkur, KarnatakaAn Organisational study at TUMUL, Tumkur, Karnataka
An Organisational study at TUMUL, Tumkur, Karnataka
 
Fii
FiiFii
Fii
 
Certificates
CertificatesCertificates
Certificates
 
Annexure
AnnexureAnnexure
Annexure
 
Body
BodyBody
Body
 
Chapter titles
Chapter titlesChapter titles
Chapter titles
 
Bibliography
BibliographyBibliography
Bibliography
 
Abstract
AbstractAbstract
Abstract
 
Table of content
Table of contentTable of content
Table of content
 
21 chap
21 chap21 chap
21 chap
 
20 chap
20 chap20 chap
20 chap
 
19 chap
19 chap19 chap
19 chap
 
18 chap
18 chap18 chap
18 chap
 
17 chap
17 chap17 chap
17 chap
 
16 chap
16 chap16 chap
16 chap
 
14 chap
14 chap14 chap
14 chap
 
13 chap
13 chap13 chap
13 chap
 
12 chap
12 chap12 chap
12 chap
 
11 chap
11 chap11 chap
11 chap
 
10 chap
10 chap10 chap
10 chap
 

Kürzlich hochgeladen

Economics, Commerce and Trade Management: An International Journal (ECTIJ)
Economics, Commerce and Trade Management: An International Journal (ECTIJ)Economics, Commerce and Trade Management: An International Journal (ECTIJ)
Economics, Commerce and Trade Management: An International Journal (ECTIJ)ECTIJ
 
fca-bsps-decision-letter-redacted (1).pdf
fca-bsps-decision-letter-redacted (1).pdffca-bsps-decision-letter-redacted (1).pdf
fca-bsps-decision-letter-redacted (1).pdfHenry Tapper
 
Bladex Earnings Call Presentation 1Q2024
Bladex Earnings Call Presentation 1Q2024Bladex Earnings Call Presentation 1Q2024
Bladex Earnings Call Presentation 1Q2024Bladex
 
Authentic No 1 Amil Baba In Pakistan Authentic No 1 Amil Baba In Karachi No 1...
Authentic No 1 Amil Baba In Pakistan Authentic No 1 Amil Baba In Karachi No 1...Authentic No 1 Amil Baba In Pakistan Authentic No 1 Amil Baba In Karachi No 1...
Authentic No 1 Amil Baba In Pakistan Authentic No 1 Amil Baba In Karachi No 1...First NO1 World Amil baba in Faisalabad
 
212MTAMount Durham University Bachelor's Diploma in Technology
212MTAMount Durham University Bachelor's Diploma in Technology212MTAMount Durham University Bachelor's Diploma in Technology
212MTAMount Durham University Bachelor's Diploma in Technologyz xss
 
原版1:1复刻堪萨斯大学毕业证KU毕业证留信学历认证
原版1:1复刻堪萨斯大学毕业证KU毕业证留信学历认证原版1:1复刻堪萨斯大学毕业证KU毕业证留信学历认证
原版1:1复刻堪萨斯大学毕业证KU毕业证留信学历认证jdkhjh
 
Tenets of Physiocracy History of Economic
Tenets of Physiocracy History of EconomicTenets of Physiocracy History of Economic
Tenets of Physiocracy History of Economiccinemoviesu
 
How Automation is Driving Efficiency Through the Last Mile of Reporting
How Automation is Driving Efficiency Through the Last Mile of ReportingHow Automation is Driving Efficiency Through the Last Mile of Reporting
How Automation is Driving Efficiency Through the Last Mile of ReportingAggregage
 
Financial Leverage Definition, Advantages, and Disadvantages
Financial Leverage Definition, Advantages, and DisadvantagesFinancial Leverage Definition, Advantages, and Disadvantages
Financial Leverage Definition, Advantages, and Disadvantagesjayjaymabutot13
 
(中央兰开夏大学毕业证学位证成绩单-案例)
(中央兰开夏大学毕业证学位证成绩单-案例)(中央兰开夏大学毕业证学位证成绩单-案例)
(中央兰开夏大学毕业证学位证成绩单-案例)twfkn8xj
 
NO1 Certified Ilam kala Jadu Specialist Expert In Bahawalpur, Sargodha, Sialk...
NO1 Certified Ilam kala Jadu Specialist Expert In Bahawalpur, Sargodha, Sialk...NO1 Certified Ilam kala Jadu Specialist Expert In Bahawalpur, Sargodha, Sialk...
NO1 Certified Ilam kala Jadu Specialist Expert In Bahawalpur, Sargodha, Sialk...Amil Baba Dawood bangali
 
NO1 WorldWide online istikhara for love marriage vashikaran specialist love p...
NO1 WorldWide online istikhara for love marriage vashikaran specialist love p...NO1 WorldWide online istikhara for love marriage vashikaran specialist love p...
NO1 WorldWide online istikhara for love marriage vashikaran specialist love p...Amil Baba Dawood bangali
 
House of Commons ; CDC schemes overview document
House of Commons ; CDC schemes overview documentHouse of Commons ; CDC schemes overview document
House of Commons ; CDC schemes overview documentHenry Tapper
 
Stock Market Brief Deck FOR 4/17 video.pdf
Stock Market Brief Deck FOR 4/17 video.pdfStock Market Brief Deck FOR 4/17 video.pdf
Stock Market Brief Deck FOR 4/17 video.pdfMichael Silva
 
Monthly Market Risk Update: April 2024 [SlideShare]
Monthly Market Risk Update: April 2024 [SlideShare]Monthly Market Risk Update: April 2024 [SlideShare]
Monthly Market Risk Update: April 2024 [SlideShare]Commonwealth
 
NO1 WorldWide Love marriage specialist baba ji Amil Baba Kala ilam powerful v...
NO1 WorldWide Love marriage specialist baba ji Amil Baba Kala ilam powerful v...NO1 WorldWide Love marriage specialist baba ji Amil Baba Kala ilam powerful v...
NO1 WorldWide Love marriage specialist baba ji Amil Baba Kala ilam powerful v...Amil baba
 
Stock Market Brief Deck for 4/24/24 .pdf
Stock Market Brief Deck for 4/24/24 .pdfStock Market Brief Deck for 4/24/24 .pdf
Stock Market Brief Deck for 4/24/24 .pdfMichael Silva
 
SBP-Market-Operations and market managment
SBP-Market-Operations and market managmentSBP-Market-Operations and market managment
SBP-Market-Operations and market managmentfactical
 

Kürzlich hochgeladen (20)

Economics, Commerce and Trade Management: An International Journal (ECTIJ)
Economics, Commerce and Trade Management: An International Journal (ECTIJ)Economics, Commerce and Trade Management: An International Journal (ECTIJ)
Economics, Commerce and Trade Management: An International Journal (ECTIJ)
 
fca-bsps-decision-letter-redacted (1).pdf
fca-bsps-decision-letter-redacted (1).pdffca-bsps-decision-letter-redacted (1).pdf
fca-bsps-decision-letter-redacted (1).pdf
 
Bladex Earnings Call Presentation 1Q2024
Bladex Earnings Call Presentation 1Q2024Bladex Earnings Call Presentation 1Q2024
Bladex Earnings Call Presentation 1Q2024
 
Authentic No 1 Amil Baba In Pakistan Authentic No 1 Amil Baba In Karachi No 1...
Authentic No 1 Amil Baba In Pakistan Authentic No 1 Amil Baba In Karachi No 1...Authentic No 1 Amil Baba In Pakistan Authentic No 1 Amil Baba In Karachi No 1...
Authentic No 1 Amil Baba In Pakistan Authentic No 1 Amil Baba In Karachi No 1...
 
212MTAMount Durham University Bachelor's Diploma in Technology
212MTAMount Durham University Bachelor's Diploma in Technology212MTAMount Durham University Bachelor's Diploma in Technology
212MTAMount Durham University Bachelor's Diploma in Technology
 
原版1:1复刻堪萨斯大学毕业证KU毕业证留信学历认证
原版1:1复刻堪萨斯大学毕业证KU毕业证留信学历认证原版1:1复刻堪萨斯大学毕业证KU毕业证留信学历认证
原版1:1复刻堪萨斯大学毕业证KU毕业证留信学历认证
 
Tenets of Physiocracy History of Economic
Tenets of Physiocracy History of EconomicTenets of Physiocracy History of Economic
Tenets of Physiocracy History of Economic
 
How Automation is Driving Efficiency Through the Last Mile of Reporting
How Automation is Driving Efficiency Through the Last Mile of ReportingHow Automation is Driving Efficiency Through the Last Mile of Reporting
How Automation is Driving Efficiency Through the Last Mile of Reporting
 
Monthly Economic Monitoring of Ukraine No 231, April 2024
Monthly Economic Monitoring of Ukraine No 231, April 2024Monthly Economic Monitoring of Ukraine No 231, April 2024
Monthly Economic Monitoring of Ukraine No 231, April 2024
 
Financial Leverage Definition, Advantages, and Disadvantages
Financial Leverage Definition, Advantages, and DisadvantagesFinancial Leverage Definition, Advantages, and Disadvantages
Financial Leverage Definition, Advantages, and Disadvantages
 
(中央兰开夏大学毕业证学位证成绩单-案例)
(中央兰开夏大学毕业证学位证成绩单-案例)(中央兰开夏大学毕业证学位证成绩单-案例)
(中央兰开夏大学毕业证学位证成绩单-案例)
 
NO1 Certified Ilam kala Jadu Specialist Expert In Bahawalpur, Sargodha, Sialk...
NO1 Certified Ilam kala Jadu Specialist Expert In Bahawalpur, Sargodha, Sialk...NO1 Certified Ilam kala Jadu Specialist Expert In Bahawalpur, Sargodha, Sialk...
NO1 Certified Ilam kala Jadu Specialist Expert In Bahawalpur, Sargodha, Sialk...
 
NO1 WorldWide online istikhara for love marriage vashikaran specialist love p...
NO1 WorldWide online istikhara for love marriage vashikaran specialist love p...NO1 WorldWide online istikhara for love marriage vashikaran specialist love p...
NO1 WorldWide online istikhara for love marriage vashikaran specialist love p...
 
House of Commons ; CDC schemes overview document
House of Commons ; CDC schemes overview documentHouse of Commons ; CDC schemes overview document
House of Commons ; CDC schemes overview document
 
Stock Market Brief Deck FOR 4/17 video.pdf
Stock Market Brief Deck FOR 4/17 video.pdfStock Market Brief Deck FOR 4/17 video.pdf
Stock Market Brief Deck FOR 4/17 video.pdf
 
Monthly Market Risk Update: April 2024 [SlideShare]
Monthly Market Risk Update: April 2024 [SlideShare]Monthly Market Risk Update: April 2024 [SlideShare]
Monthly Market Risk Update: April 2024 [SlideShare]
 
🔝+919953056974 🔝young Delhi Escort service Pusa Road
🔝+919953056974 🔝young Delhi Escort service Pusa Road🔝+919953056974 🔝young Delhi Escort service Pusa Road
🔝+919953056974 🔝young Delhi Escort service Pusa Road
 
NO1 WorldWide Love marriage specialist baba ji Amil Baba Kala ilam powerful v...
NO1 WorldWide Love marriage specialist baba ji Amil Baba Kala ilam powerful v...NO1 WorldWide Love marriage specialist baba ji Amil Baba Kala ilam powerful v...
NO1 WorldWide Love marriage specialist baba ji Amil Baba Kala ilam powerful v...
 
Stock Market Brief Deck for 4/24/24 .pdf
Stock Market Brief Deck for 4/24/24 .pdfStock Market Brief Deck for 4/24/24 .pdf
Stock Market Brief Deck for 4/24/24 .pdf
 
SBP-Market-Operations and market managment
SBP-Market-Operations and market managmentSBP-Market-Operations and market managment
SBP-Market-Operations and market managment
 

A study on ratio analysis at vst tillers tractors final

  • 1. ANALYSIS OF FINANCIAL WEALTH V.S.T. TILLERS TRACTORS LTD INTRODUCTION PART A: ABOUT INDUSTRY: 1.1 Introduction about the Tractor Industry The Indian tractor industries were as follows history of the company. 1945 to 1960: War suppliers tractors and bulldozers were imported for land reclamation and cultivation in mid 1940`s in 1947 central and state tractors organizations were setup to develop and promote the supply and age of tractors in agriculture and unto 1960 the demand met entirely through imports. There were 8500 tractors in age in1951-20000 is 1955 and 37000 by 1960. 1961 to 1970: Local production began in 1961 with five manufactures producing total of880 units per day by 1965 this had increased to over 5000 unites per pear and the total in use had rise to our 52000 by 1970 annual production had exceeded 20000 units over 146000 units working in the country. 1971 to 1980 Six new manufactures were established during this period although three companies (Kriloscar tractors, Harshor and Pittie tractors) did not survive. Escorts ltd., began location manufacture of ford tractors in 1971 in collection with Ford UK and total production climbed steadily to 33000 in 1975 reaching 71000 by1980 credit facilities for farmers continued to improve and the tractor market expanded the half million mark by 1980. LORVEN EDUCATIONAL CENTRE 1
  • 2. ANALYSIS OF FINANCIAL WEALTH V.S.T. TILLERS TRACTORS LTD 1981 to 1990 A further five manufacture began to production during this period but only one of these survived in the increasingly competition market place. Annual production exceeded 75000 units by 1985 and reaching 14000 in 1990 when the total in use was about 1 to 2 million. The Indian net importer up to the mid seventies become an exporter in the 80`s mainly to countries in Africa. 1991 to 1997 Science 1992 it has not been necessary to obtain an industrial license for tractor manufacture in India by 1997 annual production exceeded 255000 units and the national tractor park and passed the two million mark. India as emerged as one of the world leaders wheeled tractors production. The Industry Today Tractors manufacture in now firmly established in India and is highly competitive with repaid advanced being made in technical design and quality with increasing attention to export markets of the 16 companies that began operation before 1990 six are considering before major manufactures (Eicher, Escorts ltd., HMT, Mahindra and Mahindra, PTC and TAFE). Mahindra and Mahindra have emerged as a larger manufacture producing68000 unites in 1997 followed TAFE, Escort ltd., and Punjab tractors with 49000, 48000 and 40000 units respectively. LORVEN EDUCATIONAL CENTRE 2
  • 3. ANALYSIS OF FINANCIAL WEALTH V.S.T. TILLERS TRACTORS LTD The average size of the tractor in the country is currently 35hp which following trends in other parts of the world, seems likely to increase steadily to around 45hp by 2020. By which time total tractor population may have increased from the present two million with annual production up to 3200000. Power Tillers By comparison with other parts of south East Asia demand for power tillers in India has been slow to take off. However the current population of around 66000 units with an average size of the 10hp is expected to rise steadily to around production reaching our 50000 units. Tractor is a vehicle intended for drawing, towing, pushing or pulling something which cannot propel itself and, often, powering it too. Most commonly the word is used to describe a vehicle intended for pulling some other vehicle or object (see traction unit). The word comes from the Latin trahere "to pull". A conflicting history of the name suggests that steam tractors were originally referred to as traction engines, with the word "tractor" eventually deriving from a contraction of 'traction' and 'motor'. LORVEN EDUCATIONAL CENTRE 3
  • 4. ANALYSIS OF FINANCIAL WEALTH V.S.T. TILLERS TRACTORS LTD In Britain, Australia, India, Spain, and Poland the word "tractor" usually means "farm tractor", and the use of the word "tractor" to mean other types of vehicles is familiar to the vehicle trade but unfamiliar to much of the general public. In Canada and the US the word is also used to refer to a road tractor . Farm tractor A modern John Deere 8110 Farm Tractor plowing a field using a chisel plow. The most common use of the term is for the vehicles used on farms. The farm tractor is used for pulling or pushing agricultural machinery or trailers, for plowing, tilling, disking, harrowing, planting, and similar tasks. History The first powered farm implements in the early 1800s were portable engines – steam engines on wheels that could be used to drive mechanical farm machinery by way of a flexible belt. Around 1850, the first traction engines were developed from these, and were widely adopted for agricultural use. Where soil conditions permitted, such as the US, steam tractors were used to direct-haul ploughs, but in the UK, ploughing engines were used for cable-hauled ploughing instead. Steam-powered agricultural LORVEN EDUCATIONAL CENTRE 4
  • 5. ANALYSIS OF FINANCIAL WEALTH V.S.T. TILLERS TRACTORS LTD engines remained in use well into the 20th century, until reliable internal combustion engines had been developed. [2] In 1892, John Froelich built the first practical gasoline-powered tractor in Clayton County, Ohio. Only two were sold, and it was not until 1911, when the Twin City Traction Engine Company developed the design, that it became successful. In Britain, the first recorded tractor sale was the oil-burning Hornsby- Ackroyd Patent Safety Oil Traction engine, in 1897. However, the first commercially successful design was Dan Albone's three-wheel Ivel tractor of 1902. In 1908, Saundersons of Bedford introduced a four-wheel design, and went on to become the largest tractor manufacturer outside the USA. While unpopular at first, these gasoline-powered machines began to catch on in the 1910s as they became smaller and more affordable. Henry Ford introduced the Fordson, the first mass-produced tractor in 1917. They were built in the U.S., Ireland, England and Russia and by 1923, Fordson had 77% of the U.S. market. The Fordson dispensed with a frame, using the strength of the engine block to hold the machine together. By the 1920s, tractors with a gasoline-powered internal combustion engine had become the norm. The classic farm tractor is a simple open vehicle, with two very large driving wheels on an axle below and slightly behind a single seat (the seat and steering wheel consequently are in the center), and the engine in front of the driver, with two steerable wheels below the engine compartment. This basic design has remained unchanged for a number of years, but enclosed LORVEN EDUCATIONAL CENTRE 5
  • 6. ANALYSIS OF FINANCIAL WEALTH V.S.T. TILLERS TRACTORS LTD cabs are fitted on almost all modern models, for reasons of operator safety and comfort. Originally, plows and other equiptment were connected via a draw- bar, or a proporietary connecting system; prior to Harry Ferguson patenting the three-point hitch. Recently, Bobcat's patent on its front loader connection has expired; and compact tractors are now being outfitted with quick- connect attachments for their front-end loaders. There are also lawn tractors. Cub Cadet, Husqvarna, John Deere, Massey Ferguson and Toro are some of the better-known brands. Tractor  Ford 75 HP tractor  VST Mitsubishi Shakti MT 180 D Tractor  Swaraj 744 FE  OX –45 Tractor (45 HP)  OX-35 Tractor (35 HP) LORVEN EDUCATIONAL CENTRE 6
  • 7. ANALYSIS OF FINANCIAL WEALTH V.S.T. TILLERS TRACTORS LTD Ford 75 HP tractor Specifications:- Powerful Engine • 75HP (BS). 4 cylinder engines give the power required to tackle the toughest soil conditions. • Direct injection (DI). • Easy start even in cold conditions • Rated engine rpm-2500 • Bosch Rotary FI pump for high fuel efficiency • Dry type replaceable sleeves – enables the use of standard size piston after replacing the liners. VST Mitsubishi Shakti MT 180 D Tractor • More powerful and fuel efficient ‘Direct Injection’ Diesel Engine • Micron Engine Oil Filter for long life • Rotary changing device for ease and safety • Adjustable tail wheel for superior field operation • Optional wheel carrier for easy field operation CHANNIES TRACTORS LORVEN EDUCATIONAL CENTRE 7
  • 8. ANALYSIS OF FINANCIAL WEALTH V.S.T. TILLERS TRACTORS LTD Hubei Machinery & Equipment Import & Export Corporation was established as a major machinery and equipment exporter. Today, we are proud to be one of the world¡¯s foremost suppliers of industrial products especially in the agricultural machinery and industrial equipment markets such as tractors, ATVs, Gocarts, bulldozers, diesel/gasoline generators etc. With our beginnings in the early 1970s, we have since established 24 subsidiaries both inside and outside of China. These include 9 subsidiaries in the provincial cities, 5 enterprises in chinese cities such as Zhuhai, Shengzhen, Guangzhou, Shanghai, Beijing and 4 overseas enterprises in the USA, UKRAINE, SYRIA and Hongkong. We also have set up 6 joint ventures and hundreds of coordinate factories all over China. We have traded in over 100 countries in the world market providing thousands of products. Our annual product turnover ranks among China¡¯s top 200 largest companies. We will be glad to work with the partners’ worldside. HMT TRACTORS Commenced manufacturing Agricultural Tractors in 1972 with technology acquired from ZETOR, Czech Republic and continues to upgrade the products. Our Tractor Plants in Pinjore, Mohali and Hyderabad with capacity of 20,000 per annum, produces wide range of Tractors from 25 HP to 75 HP to suit various farming requirements. HMT Tractor manufacturing units have ISO 9001 certification. Our products are reliable, simple to operate with safety features and are well accepted in the international market. We have exported our Tractors to LORVEN EDUCATIONAL CENTRE 8
  • 9. ANALYSIS OF FINANCIAL WEALTH V.S.T. TILLERS TRACTORS LTD USA, Czech Republic, Croatia, Sri Lanka, Bangladesh, South Africa, Senegal, Nigeria, Malaysia, and Liberia etc. The Tractors have: • Powerful, fuel efficient engines. • Roll Over Protective Structure for safety • Hydraulic and Mechanical Disc Brakes • Dual Clutch for travel and PTO operations • Low maintenance and operational cost We also offer Primary & Secondary Tillage Implements, Land Shaping, Planting and Harvesting Equipment. MAHINDRA GUJARAT Mahindra Gujarat Tractor Limited was formed in 2001 after Mahindra and Mahindra Limited purchased sixty percent of the remaining shares in Gujarat Tractor Corporation Limited, from the Govt. of Gujarat. It is based in Vadodara, Gujarat, India. Their tractors, now called Shaktimaan were originally named Hindustan and are based on the Zetor tractor under licensing agreements. LORVEN EDUCATIONAL CENTRE 9
  • 10. ANALYSIS OF FINANCIAL WEALTH V.S.T. TILLERS TRACTORS LTD PART-B: ABOUT SUBJECT FINANCIAL STATEMENT DEFINITION In the words of John .N. Myer “The Financial statements provide a summary of the accounts of a business enterprise, the balance reflecting the assets, liabilities and capital as on a certain date and the income statement showing the results of operations during a certain period”. Financial statements are prepared primarily for decision-making. They play a dominant role in setting the framework of managerial decisions. But the information provided in the financial statements is not an end in itself as no meaningful conclusions can be drawn from these statements alone. However, the information provided in the financial statements is of immense use in making decisions through analysis and interpretation of financial statements MEANING OF FINANCIAL STATEMENTS The term Financial Statement refers to the Two Statements 1. The position statement or the Balance Sheet. LORVEN EDUCATIONAL CENTRE 10
  • 11. ANALYSIS OF FINANCIAL WEALTH V.S.T. TILLERS TRACTORS LTD 2. The Income statements or the Profit and loss account. These statements are used to convey to management and other interested outsiders the profitability and financial position of a Firm. FINANCIAL ANALYSIS Financial analysis is “The process of identifying the Financial Strengths and Weaknesses of the firm by properly establishing relationship between the items of the balance sheet and the profit and loss account.” There are various methods or techniques used in analyzing financial statements, such as comparative statements, trend analysis, common size statements, schedules of changes in working capital, funds flow statement and cash flow analysis, cost- volume-profit analysis and ratio analysis. The purpose of financial analysis is to diagnose the information contained in financial statements so as to judge the profitability and financial soundness of the firm, a financial analyst analyses the financial statements with various tools of analysis before commenting upon the financial health or weaknesses of an enterprise. The analysis and interpretation of financial statements is essential to bring out the mystery behind the figures in financial statements. Financial statement analysis is an attempt to determine the significance and meaning of the financial statement data so that forecast may be made of the future LORVEN EDUCATIONAL CENTRE 11
  • 12. ANALYSIS OF FINANCIAL WEALTH V.S.T. TILLERS TRACTORS LTD earnings, ability to pay interest and debt maturities (both current and long term) and profitability of a sound dividend policy. The Significance or Importance of Financial Analysis: 1. To know the Present and Future Profitability of their Concern 2. To know the Earning Per Share and the Dividend Per Share, which have an impact on the market prices of their shareholdings. 3. To know the Financial Position of the Concern. 4. To know the stake or risk undertaken by firm. 5. To Analyze the Financial Statements which helps the management to ascertain the profitability of the enterprise. 6. To ascertain the Trend of Progress of the Concern. 7. To forecast future sales, Production, Expenses, Profits etc on the basis of the past data. 8. To ascertain the adequacy of Capital Structure of the Concern. 9. To know whether the Short-term Financial Position of the concern is good to Pay Bonus Increased wages, etc. 10.To have correct assessment of Taxes, such as Excise duties, Sales tax, Income tax etc. LORVEN EDUCATIONAL CENTRE 12
  • 13. ANALYSIS OF FINANCIAL WEALTH V.S.T. TILLERS TRACTORS LTD 11.To regulate the prices of goods produced by the enterprise. 12.To determine it’s Financial Policies. TYPES OF FINANCIAL ANALYSIS 1. ON THE BASIS OF MATERIAL USED A) Externa1 analysis B) Internal analysis A) EXTERNAL ANALYSIS: Outsiders who do not have access to the detailed internal accounting records of the business firm do this analysis. These outsiders include investors, potential investors, creditors, potential creditors, government agencies, credit agencies and the general public. For financial analysis these external parties to the firms depend almost on the published financial statements. B) INTERNAL ANALYSIS: The analysis conducted by persons who have access to the internal accounting records of a business firm is known as internal analysis, such an analysis can, therefore be performed by executives and employees of the organization as well as government agencies which have Statutory powers vested in them. Financial analysis for managerial purposes is the internal LORVEN EDUCATIONAL CENTRE 13
  • 14. ANALYSIS OF FINANCIAL WEALTH V.S.T. TILLERS TRACTORS LTD type of analysis that can be affected depending upon the purpose to be achieved. 2. ON THE BASIS OF MODUS OPERANDI A. Horizontal analysis B. Vertical analysis. A) HORIZONTAL ANALYSIS Horizontal analysis refers to the comparison of financial data of a company for several years. The figures for this type of analysis are presented horizontally over a number of columns. The figures of the various years are compared with standard or base year. A base year is a year chosen as beginning point. This type of analysis is also called ‘Dynamic analysis’ as it is based on the data from year to year rather than on data of any one year. Comparative statements and trend percentages are two tools employed in horizontal analysis. B) VERTICAL ANALYSIS. Vertical analysis refers to the study of relationships of the various items in the financial statements of one accounting period. In this type of analysis the figures from financial statements of a year are compared with a base selected from the same year’s statement. It is also known as ‘static analyses. Common-size financial statements and financial ratio’s are the two tools employed in vertical analysis. PROCEDURE OF FINANCIAL STATEMENT ANALYSIS LORVEN EDUCATIONAL CENTRE 14
  • 15. ANALYSIS OF FINANCIAL WEALTH V.S.T. TILLERS TRACTORS LTD There are three steps involved in the analysis of financial statements. These are 1. Selection 2. Classification and 3. Interpretation. The first involves selection of information (data) relevant to the purpose of analysis of financial statements. The second step involved is the methodical classification of the data and the third step includes drawing of intervenes and conclusions. METHODS OR DEVICES OF FINANCIAL ANALYSIS. The analysis and interpretation of financial statements is used to determine the financial position and results of operations as well. A number of methods or devices are used to study the relationship between different statements. The following methods of analysis are generally used 1. Comparative statements. 2. Trend analysis. 3. Common-size statements. 4. Funds flow analysis. 5. Cash flow analysis. 6. Ratio analysis. 7. Cost-volume-profit analysis. 1. COMPARATIVE STATEMENTS. LORVEN EDUCATIONAL CENTRE 15
  • 16. ANALYSIS OF FINANCIAL WEALTH V.S.T. TILLERS TRACTORS LTD The Comparative Financial statements are statements of the financial position at different periods of time. The elements of financial position are shown in a comparative form so as to give an idea of financial position at two or more periods. Two financial statements (balance sheet and income statement) are prepared in Comparative form for financial analysis purposes. Not only the comparison of the figures of the two periods but also the relationship between balance sheet and income statement enables an in depth study of financial position and operative results. The two Comparative statements are A. Balance sheet. B. Income statement. A. COMPARATIVE BALANCE SHEET. The Comparative balance sheet analysis is the study of the trend of the same items, group of items and computed items in two or more balance sheets of the same business enterprise on different dates. The changes in periodic balance sheet items reflect the conduct of a business. The changes can be observed by comparison of the balance sheet at the beginning and at the end of a period and these changes can help in forming an opinion about the progress of an enterprise. B. COMPARATIVE INCOME STATEMENT. The income statement gives the results of the operations of a business. The Comparative Income statement gives an idea of the progress of a business over a period of time. The changes in absolute data in money values and percentages can be determined to analyze the profitability of the business. LORVEN EDUCATIONAL CENTRE 16
  • 17. ANALYSIS OF FINANCIAL WEALTH V.S.T. TILLERS TRACTORS LTD 2. TREND ANALYSIS. The financial statements may be analyzed by computing trends of series of information. This method determines the direction upwards or downwards and involves the computation of the percentage relationship that each statement item bears to the same item in base year. 3. COMMON SIZE STATEMENT. The common size statements, balance sheet and income statement are shown in analytical percentages. The common size statements may be Prepared in the following way. The Total of Assets or Liabilities is taken as 100, The individual assets are expressed as a percentage of total assets that is 100 and different liabilities are calculated in relation to total liabilities. A. COMMON SIZE BALANCE SHEET. A statement in which balance sheet items are expressed as the ratio of each asset to total and ratio of each liability is expressed as a ratio of total liabilities is called common size balance sheet. The common size balance sheet can be used to compare companies of differing size. The comparison of figures in different periods is not useful because total figures may be affected by a number of factors. It is not possible to establish standard norms for various assets. The trends of figures from year to year may not be studied and even they may not give proper results. B. COMMON SIZE INCOME STATEMENT. LORVEN EDUCATIONAL CENTRE 17
  • 18. ANALYSIS OF FINANCIAL WEALTH V.S.T. TILLERS TRACTORS LTD The items in income statement can be shown as percentages of sales to show the relation of each item to sales. A significant relationship can be established between items of income statement and volume of sales. The increase in sales will certainly increase selling expenses and not administrative or financial expenses. In case the volume of sales increases to a considerable extent, administrative and financial expenses may go up. In case the sales are declining, the selling expenses should be reduced at once. So a relationship is established between sales and other items in Income statement and their relationship is helpful in evaluating operational activities of the enterprise. 2. FUNDS FLOW STATEMENT According to ‘SMITH and BROWN' Funds flow statement “Is a method by which we study changes in the financial position of a business enterprises between beginning and ending financial statement dates”. Meaning of funds “Funds are usually called as working capital for the purpose of funds flow statement” It is a statement showing sources and application of funds for a period of time. The funds flow statement, which shows the movement of funds and is a report of the financial operation of the business undertaking. It indicates various means by which funds were obtained during a particular period and the ways in which these funds were employed. In simple words, it is a statement of sources and application of funds. Advantages of Funds Flow Statement 1. It helps in providing proper guideline for of available Funds. LORVEN EDUCATIONAL CENTRE 18
  • 19. ANALYSIS OF FINANCIAL WEALTH V.S.T. TILLERS TRACTORS LTD 2. Acts as a basis for financial plan budgeting. 3. It gives early warning for the financial dangers. 4. It helps in borrowing funds from others sources. 5. CASH FLOW ANALYSIS. Cash flow statement is a “Statement, which describes the Inflows (sources) and Outflow (uses) of cash and cash equivalent in an enterprise during a specified period of time”. Advantages: 1. Cash flow statement is very useful in the evaluation of cash position of a firm. 2. It helps in planning the repayment of loans, replacement of fixed assets and other similar long term planning of cash. 3. Cash flow statement is more suitable for making comparisons than the funds flow statement, as there is no standard format for the same. 4. Cash flow statement provides information of all activities classified under operating, investing and financing activities. 6. RATIO ANALYSIS. The ratio analysis is one of the most powerful tools of financial analysis. It is the process of establishing and interpreting various ratios (quantitative relationship between figures and groups of figures) it is with the help of ratios that the financial statements can be analyzed more clearly and decisions made from such analysis. Ratio analysis is a technique of analysis and interpretation of financial statements. LORVEN EDUCATIONAL CENTRE 19
  • 20. ANALYSIS OF FINANCIAL WEALTH V.S.T. TILLERS TRACTORS LTD Advantages: 1. It helps in decision-making. 2. It helps in financial forecasting and planning. 3. It helps in communicating. The financial strength and weakness of a firm are communicated in a more easy and understandable manner by the use of ratios. 4. It helps in co-ordination and control. 5. It use full in inter- firm comparison TYPES OF RATIOS I). LIQUIDITY RATIO. These are the ratios, which measure the short-term solvency or financial position of a firm. These ratios are calculated to comment upon the Short term paying capacity of a concern or the firm’s ability to meet its current obligations. To measure the liquidity of a firm, the following ratios can be calculated. Liquidity Ratios A). Current ratio. B). Quick ratio or acid test or liquid ratio. C). Absolute liquid ratio. A). CURRENT RATIO It is the ratio, which matches current assets with the firm’s current liabilities Current Assets Current Ratio = Current Liabilities LORVEN EDUCATIONAL CENTRE 20
  • 21. ANALYSIS OF FINANCIAL WEALTH V.S.T. TILLERS TRACTORS LTD This ratio throws good light on the short-term financial position and its policies. It is an indicator of a firm’s ability to promptly meet its short- term liabilities. B). QUICK RATIO OR ACID TEST OR LIQUID RATIO This ratio more severe test of liquidity of a firm. It shows the ability of a business to meet its immediate financial commitments. Quick Assets Quick Ratio = Current Liabilities C). ABSOLUTE LIQUID RATIO. This also known as super quick ratio Cash Absolute Liquid Ratio = Current Liabilities II) ANALYSIS OF LONG-TERM FINANCIAL POSITION OR TESTS OF SOLVENCY: The term solvency refers to the ability of a concern to meet its long- term obligations. The long-term indebtedness of a firm includes debenture holders, financial institutions providing medium and long-term loans and other creditors selling goods on installment basis. Long-term solvency ratios indicate a firm’s ability to meet the fixed interest and costs and repayment schedules associated with its long-term borrowings. LORVEN EDUCATIONAL CENTRE 21
  • 22. ANALYSIS OF FINANCIAL WEALTH V.S.T. TILLERS TRACTORS LTD The following ratios serve the purpose of determining the solvency of the concern. A) Debt-equity ratio B) Proprietary ratio or equity ratio C) Fixed assets to net worth or proprietor’s funds ratio A). DEBT-EQUITY RATIO: Debt-equity ratio also known as external-internal equity ratio. It is calculated to measure the relative claims of outsiders and the owners (that is share holders) against the firm’s assets. This ratio indicates the relationship between the external equities or the outsider’s funds and the internal equities or the shareholders funds. Long Term Debts Debt - Equity Ratio = Shareholders Equity Where outsider’s funds include all debts/Liabilities to outsiders whether long term or short term or whether in the form of debentures, bonds, mortgages or bills. The shareholders funds consist of equity share capital, preference share capital, capital reserves, revenue reserves and reserves representing accumulated profits and surplus like reserves for contingencies, sinking funds etc The debt- equity ratio is calculated to measure the extent to which debt financing has been used in business. The ratio indicates the proportionate claims of owners and the outsiders against the firm’s assets. The purpose is to get an idea of the cushion available to outsiders on the liquidation of the firm. Generally a low ratio (debt being low in comparison to shareholders funds) is considered as favorable from the long-term creditor’s point of view because a high proportion of owner’s funds provide LORVEN EDUCATIONAL CENTRE 22
  • 23. ANALYSIS OF FINANCIAL WEALTH V.S.T. TILLERS TRACTORS LTD a larger margin of safety for them. A high debt equity ratio which indicates that the claims of outsiders (creditors) are greater than those of owners, may not be considered by the creditors because it gives a lesser margin of safety for them at the time of liquidation of the firm. B) PROPRIETORY RATIO: A variant to the debt-equity ratio is the proprietary ratio, which is also known as equity ratio or shareholders to total equities ratio or net worth to total assets ratio. This ratio establishes the relationship between shareholder’s funds to total assets of the firm. Shareholdres Funds Proprietory Ratio = Total Assets Where shareholders fund is equity share capital, undistributed profits, reserves and surplus out of this amount, accumulated losses should be deducted. As equity represents the relationship of owner’s funds to total assets, higher the ratio or the share of the shareholders in the total capital of the company. This ratio indicates the extent to which the assets of the company can be lost without affecting the interest of creditors of the company. C). FIXED ASSETS TO NET WORTH RATIO OR FIXED ASSETS TO PROPRIETOR’S FUNDS: This ratio establishes the relationship between fixed assets and shareholder’s funds that is share capital, reserves and surplus and retained earnings. Fixed Assets Fixed Assets to Networth Raio = Networth LORVEN EDUCATIONAL CENTRE 23
  • 24. ANALYSIS OF FINANCIAL WEALTH V.S.T. TILLERS TRACTORS LTD III) PROFITABILITY RATIOS: The primary objective of a business undertaking is to earn profits. Profit earning is considered essential for the survival of the business. A business needs profits not for its existence but also for expansion and diversification. Generally, profitability ratios are calculated either in relation to investment General profitability ratios. A. Gross profit ratio. B. Operating ratio C. Operating profit ratio D. Expenses ratio E. Net profit ratio A) GROSS PROFIT RATIO: Gross profit ratio measures the relationship of gross profit to net sales and is usually represented as a percentage. Gross Profit Gross Profit Ratio = X100 Net Sales The gross profit ratio indicates the extent to which selling prices of goods per unit may decline without resulting in losses on operations of a LORVEN EDUCATIONAL CENTRE 24
  • 25. ANALYSIS OF FINANCIAL WEALTH V.S.T. TILLERS TRACTORS LTD Firm. As the gross profit is found by deducting cost of goods sold from the net sales, higher the gross profit better the result. A low gross profit ratio indicates high cost of goods sold due to unfavorable purchasing policies, lesser sales, lower selling prices, excessive competition, over- investment in plant and machinery etc A comparison of gross profit ratio overtime or for different firms in the same industry is a good measure of profitability, yet the gross profit ratio is one of the very important ratios for measuring profitability of a firm. B). OPERATING RATIO: Operating ratio establishes the relationship between the cost of goods sold and other operating expenses on the one hand and the sales on the other. In other words, it measures the cost of operations per rupee of sales. Operating Cost Operating Ratio = X 100 Net Sales C) OPERATING PROFIT RATIO This ratio is calculated by dividing operating profit by sales Operating Profit Operating Profit Ratio = X 100 Net Sales Where operating profit = Net sales –Operating profit D) EXPENSES RATIO: Expenses ratio indicates the relationship of various expenses to net sales. Expenses ratio are calculated by dividing each item of expenses or LORVEN EDUCATIONAL CENTRE 25
  • 26. ANALYSIS OF FINANCIAL WEALTH V.S.T. TILLERS TRACTORS LTD group of expenses with the net sales to analyze the cause of variation if the operating profit. Expenses ratio can be calculated as follows: Cost of sales a) Total cost to Sales = X 100 Net Sales Administration and Office b). expenses to Sales Ratio = Adiminsration & Office Expenses X 100 Net Sales Selling and Distribution c). Expenses to SalesRatio = Selling and Distribution expenses X100 Net Sales Non Opertaing Expenses d). Non Operating Expenses to Sales Ratio = X 100 Net Sales E) NET PROFIT RATIO Net profit ratio establishes a relationship between net profit (after taxes) and sales and indicates the efficiency of the management in manufacturing, selling, administrative and other activities of the firm. This ratio is the overall measure of firm’s profitability and is calculated as. Net Profit After Tax a) Net Profit Ratio = X 100 Net Sales IV OVERALL PROFITABILITY RATIO Profits are the measure of overall efficiency of a business. The higher the profit, the more efficient is the business considered. Thus, overall profitability or efficiency of a business can be measured in terms of profits related to investments made in the business. LORVEN EDUCATIONAL CENTRE 26
  • 27. ANALYSIS OF FINANCIAL WEALTH V.S.T. TILLERS TRACTORS LTD A. Return on shareholder’s investment or net worth ratio. B. Return on equity capital C. Earning per share D. Dividend yield ratio E. Dividend pay-out ratio F. Price earning (earning yield) ratio. A) RETURN ON SHAREHOLDER’S INVESTMENT OR NET WORTH RATIO Return on shareholder’s investment popularly known as return on investment or return on shareholder. Proprietor’s fund is the relationship between net profits (after interest and tax) and the proprietor’s funds Net Profit After Interest and Tax Return on Investment = Shareholders Funds B) RETURN ON EQUITY CAPITAL: Ordinary shareholders are the real owners of the company. They assume the highest risk in the company. Ordinary shareholders are more interested in the profitability of a company and the performance of a company should be judged on the basis of return on equity capital of a company. Net Profit After Tax - Preference Dividend Return on Equity Capital = Equity Share Capital LORVEN EDUCATIONAL CENTRE 27
  • 28. ANALYSIS OF FINANCIAL WEALTH V.S.T. TILLERS TRACTORS LTD C) EARNING PER SHARE: Earning per share is a small variation of return on equity capital and is calculated by dividing the net profit after taxes and preference dividend by the total number of equity shares. Net Profit After Tax - Prefernce Dividend Earnings Per Share = No Equity Shares D) RETURN ON CAPITAL EMPLOYED: Return on capital employed establishes the relationship between profits and the capital employed. It is the primary ratio and is most widely used to measure the overall profitability and efficiency of a business. The term capital employed refers to the total of investments made in a business and can be defined in a number of ways. The three most widely used definition of this term is I. Gross capital employed II. Net capital employed III. Proprietors net capital employed GROSS CAPITAL EMPLOYED: The term gross capital employed usually comprises the total assets used in a business. Gross capital employed = fixed assets+ current assets NET CAPITAL EMPLOYED The term net capital employed comprises the total used in a business less its current liabilities Net capital employed = Total assets- current liabilities LORVEN EDUCATIONAL CENTRE 28
  • 29. ANALYSIS OF FINANCIAL WEALTH V.S.T. TILLERS TRACTORS LTD PROPRIETOR’S NET CAPITAL EMPLOYED: Proprietor’s net capital employed means shareholders funds or investment in the business. Proprietors net capital employed = fixed assets = current assets — outside liabilities. D) DIVIDEND YIELD RATIO: Shareholders are the real owners of a company and they are interested in real sense in the earnings distributed and paid to them as dividends. Therefore, dividend yield ratio is calculated to evaluate the relationship between dividend per share paid and the market value of the share Dividend Per Equity Share Dividend Yeild Ratio = Market Pr ice Per Equity Share Dividend Paid to Shareholders Dividend Per Share = Number of Equity Shares E) DIVIDEND PAY OUT RATIO: Dividend pay out ratio is calculated to find the extent to which earnings per share have been retained in the business. It is an important ratio because Pouching back of profits enables a company to grow and pay more dividends in future. Dividend Per Equity Share Dividend Pay Out Ratio = Earnings Per Share F) PRICE EARNING RATIO: LORVEN EDUCATIONAL CENTRE 29
  • 30. ANALYSIS OF FINANCIAL WEALTH V.S.T. TILLERS TRACTORS LTD Price earning ratio is the ratio between market price per equity share and earnings per share. The ratio is calculated to make an estimate of appreciation in the value of a share of a company and is widely used by investors to decide whether or not to buy shares in a particular company. Market Price Per Share Price Earning Ratio = Earnings Per Share G) EARNING YIELD RATIO: This ratio is also shows a relationship between earnings per share and market value of shares. Earnings Per Share Earnings Yield Ratio = Market Price Per Share 7. COST-VOLUME-PROFIT ANALYSIS: Cost-volume-profit analysis is a technique for studying the relationship between cost, volume and profit. The CVP relationship is an important tool used for the profit planning of a business. The study of cost- volume-profit analysis is often referred to as break-even analysis. The term break-even analysis is used in two senses, narrow sense and broad sense. In its broad sense, break-even analysis refers to the study of relationship between costs, volume and profit at different levels of sales or production. In its narrow sense, it refers to a technique of determining that levels of operations where total revenues equal total expenses that are the point of no profit no loss. LORVEN EDUCATIONAL CENTRE 30
  • 31. ANALYSIS OF FINANCIAL WEALTH V.S.T. TILLERS TRACTORS LTD RESEARCH METHODLOGY TITLE OF THE STUDY: PROJECT REPORT ON “A STUDY ON RATIO ANALYSIS OF FINANCIAL WEALTH OF VST TILLERS TRACTORS LTD”. STATEMENT OF THE PROBLEM Financial statements are the reports of stewardship (that is the performance of management). They are the basis for formulation of economic and financial policies and guide to dividend decision. Financial statements help to determine the legality of dividend payment. They act as the basis for granting credit and are very informative to prospective investors. Financial statements serve as a proper guide to value the investments already made in an enterprise and serve as a basis for taxation and act as a basis for price regulation by the government. They serve as an aid to government interference and supervision of a business enterprise. Financial statements are useful to various parties like the owners, prospective investors, management, creditors, employees, government, ‘tenera1 public etc. OBJECTIVES OF THE STUDY LORVEN EDUCATIONAL CENTRE 31
  • 32. ANALYSIS OF FINANCIAL WEALTH V.S.T. TILLERS TRACTORS LTD 1. To analyze the financial position of a VST tillers tractors ltd from the financial statement using tools of management accounting. 2. To make detail analysis of each and every component of balance sheet of VST tillers tractors ltd. 3. To Know the Operating Expenses of the VST tillers tractors ltd 4. To assess the Profitability condition of the Company through analyzing the Balance sheet of the Company. 5. To Assess the Rate of return of the Company SCOPE OF THE STUDY: The study covers the financial analysis of the statement, which is disclosed by the annual report of the Company. Overall performance of the Company is assessed. LIMITATIONS OF THE STUDY: 1. Study restricted to2 to 3 years financial statement of the Company. 2. The overall performance of the Company is analyzed and not branch wise. 3. Few tools for analysis are used to analyze the financial statement. 4. In-depth study of items of profit or loss account and balance sheet are not made. 5. They say little about the firm’s prospects in an absolute sense. 6. Their insights about relative performance require a reference point from other time periods or similar firms. LORVEN EDUCATIONAL CENTRE 32
  • 33. ANALYSIS OF FINANCIAL WEALTH V.S.T. TILLERS TRACTORS LTD 7. One ratio holds little meaning. 8. As indicators, ratios can be logically interpreted in at least two ways. One can partially overcome this problem by combining several related ratios to paint a more comprehensive picture of the firm’s performance. METHODOLOGY OF THE STUDY: All information for preparations of project is collected through annual report of the Company and some information is collected through the books maintained by Company and also through the employees of the Company and some information from the website of the VST tillers tractors ltd. SOURCES OF DATA 1. Primary Data- Primary data are the original data which originally collected by direct interview with the Company for the 1 st time, about the statistical investigation & and used by them in statistical analysis are formed as Primary Data. 2. Secondary Data- These are the Data which might be published or unpublished have already been collected and processed by same agency or person and take over from some other agency. Example- Balance sheet, Profit & Loss account, Cash Flow Statement. RESEARCH INSTURMENTS LORVEN EDUCATIONAL CENTRE 33
  • 34. ANALYSIS OF FINANCIAL WEALTH V.S.T. TILLERS TRACTORS LTD The technique used for the Analysis is Ratio Analysis and Comparative Balance Sheet etc. It is a most widely used and powerful tool for Financial Statements Analysis. The ratios used for the study are Liquidity ratio, Profitability Ratios, Solvency Ratios. Which includes Liquid assets to total assets ratio and Liquid assets to total investments? Profitability ratios such as Return on Assets, Return on Equity, Net Profit Ratio etc. Long –term solvency ratios such as Proprietary Ratio etc. COMPANY PROFILE: LORVEN EDUCATIONAL CENTRE 34
  • 35. ANALYSIS OF FINANCIAL WEALTH V.S.T. TILLERS TRACTORS LTD History of the company VST Tiller Tractors Ltd (VTTL) was incorporated in the year 1967 in Bangalore India. It was promoted by the VST group, a well-known business house in south India, in technology collaboration and joint venture with Mitsubishi Heavy Industries and Mitsubishi; corporation Japan for the manufacture of Tillers and diesel engines. The plant went into production in the year 1970. In 1970, an additional technical and financial collaboration with Mitsubishi Agriculture of 18.5 HP, 4-wheel drive tractor was entered into. The manufacturing plan is located in Whitefield industrial area near Bangalore. It has 75,000 sq. meters, of land and a built up area of 15,000 sq. meters (approx). The company has total personnel strength of about 500 employees as on date. The manufacturing capacity of the company is 12,000 power tillers, 16,000 engines and 2,500 tractors. Now, the company has come out of collaboration and joint venture partnership. It has in house design and development section for upgrading and updating the level of technology in line with current requirements. The company is certified to ISO-9001 quality management system. Since Jan 1998 our company follows ISO-9001-2000 Quality Systems requirements to satisfy all out customer needs. LORVEN EDUCATIONAL CENTRE 35
  • 36. ANALYSIS OF FINANCIAL WEALTH V.S.T. TILLERS TRACTORS LTD The main product of the company namely Power tillers and Tractors are used in the agriculture sector all over the country. Power Tillers, Tractors are component parts are exported to countries such as Srilanka, Tanzania, Zambia Ghaha, Cryprus, Europe, Austria, USA, Japan and Thailand. The company has set up a nation wide network of Dealers supported by sales and service Organization. Adequate supply of spare parts, provision of service tools and equipment, making available service information through technical literature, instruction manuals etc, and imparting training to dealer’s personnel as well as end users namely the farmers, are some of the effective steps taken by the company towards customer satisfaction. With this objective, company was formulated its quality policy achievement of an international quality standard is not a single event but an ongoing commitment which remains as a continuous obligation and process. The plans set in place are designed to ensure that the continuous commitment is a part of the operational policy of the company, with the help of its people. The company will provide the best possible service to the customers and strive for excellence in performance. Way back in 1920 the VST Group made a humble start by dealing in petroleum products. Using this strong base, the Group quickly diversified into automotive marketing and after-sales service. From this activity grew the network of the organization throughout the southern states of Karnataka and Tamil Nadu. The tradition and culture of the VST Group continues in this Company LORVEN EDUCATIONAL CENTRE 36
  • 37. ANALYSIS OF FINANCIAL WEALTH V.S.T. TILLERS TRACTORS LTD in spite of it having adopted new management techniques to face global challenges. Over the years, VST Tillers Tractors Ltd. has established an extensive and efficient countrywide sales and after-sales service network backed by easy availability of spare parts. Periodic training programmes for Dealers and customers are taken up to keep them constantly updated on improvements on its products. Type: The company is manufacturing sectors. It is located in white field road. Nature: The company is manufacturing the tractors, tillers and diesel engines. The company has produced the goods and gives to dealers and increases the sales. Board of Directors: The board comprises of a Non-Executive Chairman, two whole time Directors and six Non-Executives Directors. The constitution of the Board is given below. During the year 2005-06, four Meeting of Board Of Directors were held i.e., on November 2005 and 30th January 2006. Mr. V.P. Mahendra Managing Directors Mr. A.T. Nahender Directors (Operations) Mr.v.v.Vijayandra Non-executive Mr.v.k. Surendra Non-executive Mr.V.T.Velu Non-executive Mr.A.Hishikawa Non-executive Mr.M.Tanaka Non-executive Mr. R.Subbramanian Non-executive/independent Mr.M.V.Bannerjee Non-executive/independent LORVEN EDUCATIONAL CENTRE 37
  • 38. ANALYSIS OF FINANCIAL WEALTH V.S.T. TILLERS TRACTORS LTD Mr.V.Ramachandran Non-executive/independent ORGANIZATION CHART: Directors (Operations) Vice President General Manager Manager Officer Junior Officer Supervisor Workers THE COMPANY' S VISION VST Tillers Tractors Ltd. believes that the foundation of its business is to provide EXCELLENCE in its products through: LORVEN EDUCATIONAL CENTRE 38
  • 39. ANALYSIS OF FINANCIAL WEALTH V.S.T. TILLERS TRACTORS LTD High Quality and Reliability. Economical and Competitive Prices. Efficient Services to the satisfaction of the customers. In order to achieve these goals and attain market leadership, it shall be the objective of every employee to strive to be Future planes a) Higher horsepower Tractor as a variant to MT180D. b) Aesthetical improvement on power Tiller engines. c) Emission compliance of new series of engines for varied applications. PRODUCT PROFILE Consequent to its long and close association with the Mitsubishi Group of Companies, VST Tillers Tractors Ltd. Has effectively absorbed the latest technology and work culture. This has resulted in the company's LORVEN EDUCATIONAL CENTRE 39
  • 40. ANALYSIS OF FINANCIAL WEALTH V.S.T. TILLERS TRACTORS LTD achievement in perfecting every product it manufactures, meeting even the most exacting requirements of the customer. Tillers Tractors Diesel Engines Tillers are classified as follows: Mitsubishi-Shakti VWH-120 Power VST-Shakti 130 DI Power Tiller Tiller Tractors are classified as follows: LORVEN EDUCATIONAL CENTRE 40
  • 41. ANALYSIS OF FINANCIAL WEALTH V.S.T. TILLERS TRACTORS LTD Euro tractors –VST Mitsubishi-Shakti MT180D 180 Tractor Features of Euro tractors: • Compact, Light weight, Four Wheel drive multipurpose tractor. • Fully confirms to safety regulations as specified by the Council of European Communities (EEC) with the following features: - EEC approved Roll Over Protection System (ROPS) for operator’s safety. Options: Regular ROPS - 'e' mark No. e11-0933. Foldable ROPS - 'e' mark No. e4-VI-028. - Independent hand operated brake system for additional safety. - 'e' Marked electrical signaling devices. • Option of two & Four Wheel drives for optimum engine power utilization. LORVEN EDUCATIONAL CENTRE 41
  • 42. ANALYSIS OF FINANCIAL WEALTH V.S.T. TILLERS TRACTORS LTD • Overriding PTO clutch to facilitate use of high inertia implements. • Live hydraulic system with adjustable implements position, and lowering speed control. • Elegant dash board with all necessary instruments Diesel engines are classified as follows: 130 DI AD8V K3C VWH 120 LORVEN EDUCATIONAL CENTRE 42
  • 43. ANALYSIS OF FINANCIAL WEALTH V.S.T. TILLERS TRACTORS LTD FINANCIAL HIGHLIGHTS The financial results are summarized below (Rs.in lakhs) Particulars Year Year 2005-06 2004-05 TURNOVER 1299 11086 OTHER INCOME 165 186 TOTAL INCOME 13164 11272 PROFIT BEFORE DEPRECIATION & 1563 1346 INTREST 137 171 INTRESET 271 299 DEPRECIATION 1155 876 PROFIT BEFORE TAX 414 290 INCOME TAX 741 586 PROFIT AFTER TAX 497 575 BALANCE B/F 1238 1161 SURPLUS AVAILABLE FOR APPROPRATION TO: 173 144 DIVIDENT 24 20 TAX ON DIVIDENT 500 500 TRANSFER TO GENERAL RESERVE 541 497 BALANCE CARRIED FORWARD LORVEN EDUCATIONAL CENTRE 43
  • 44. ANALYSIS OF FINANCIAL WEALTH V.S.T. TILLERS TRACTORS LTD Market share: The stock exchange or the Securities Exchange Board of India (SEBI) and / or any other statutory authority have not imposed any strictures / penalties on the company on any matters relating to capital market during the last three years Market Price Data: Month Highest Lowest Month Highest Lowest price(Rs). Price(Rs). price(Rs) price(Rs) Apr - 05 71.90 66.15 Oct- 05 122.60 91.85 May - 05 106.25 70.00 Nov- 05 113.05 97.75 Jun - 05 121.6 102.05 Dec- 05 114.10 98.60 Jul - 05 145.2 117.55 Jan- 06 116.60 106.25 Aug- 05 128.95 112.55 Feb- 06 110.60 101.30 Sept- 05 152.05 116.55 Mar- 06 105.30 91.75 Competitors: 1. Channies – From China 2. Campco – Kerla 3. Sun Brand 4. Hmt Functional chart LORVEN EDUCATIONAL CENTRE 44
  • 45. ANALYSIS OF FINANCIAL WEALTH V.S.T. TILLERS TRACTORS LTD MANAGEING DGM- DIRECTOR MKV DIRECTOR GM-MK (OPERATION) VP (BUSINESS DEPATMENT) MKS FIA VP (CHARMAN) GM-FI FIC FII DGM-SPS SPS DGM-MF MFA MFM MFP GM-EN ENE /ENE ENP DGM-QA QAC QAV QAM GM-IM DGM-IM ISC IMC/IMD GM-HR HRD HRW PGD / PDS (HR) PDT CE GAF GA GAA GAS Growths and Prospect LORVEN EDUCATIONAL CENTRE 45
  • 46. ANALYSIS OF FINANCIAL WEALTH V.S.T. TILLERS TRACTORS LTD During the year under report, your company has been on a consistent upward path in sales, profit and margins. The turnover increased by 17% from Rs.111 crores in 2004-2005 to an all time high of 130 crores. The operating profit increased by over 16% to 1563 lakhs due to higher realization and lower interest cost. The profit after tax was higher by 26% from 586 lakhs to 586 lakhs. Consequently, earnings per share grew from Rs.10.17 to Rs.13.10 for 2005-2006. On the backdrop of the year with a good financial performance your company is presently dept free. The sale of power tillers increased to 8489 units as against the previous year sales of 7625 units. With respect to Tractors, your company sold 1249 unit as against 933 units an increase of 33%. This improvement in sales has been achieved in line with the overall increase in demand complemented by better government support prices for crops, opening new markets, normal monsoons and availability of finance to farmers. The last factor plays a key role since more then 80% of tractor sales are on credit. The performance of precision components division located continued to be challenging due to lack of consistency in overseas orders. Due to a sudden order cancellation, this division suffered losses on account of underutilization of capacity during the year. In addition, the substantial reduction in DEPB benefits on exports and increase in the price of steel and other input material has had an adverse impact on margins. However a subsequent increase in orders for supply of crankshafts and connecting rods to one of its customers during the year has shored up its revenues thereby achieving optimal production. About VST Group: LORVEN EDUCATIONAL CENTRE 46
  • 47. ANALYSIS OF FINANCIAL WEALTH V.S.T. TILLERS TRACTORS LTD Way back in 1920 the VST Group made a humble start by dealing in petroleum products. Using this strong base, the Group quickly diversified into automotive marketing with after sales service. From this activity grew the network of the Organization throughout the southern states of Karnataka and Tamil Nadu. The VST Group has over 2000 employees and has a turnover of U.S. $500 million p.a. QUALITY POLICY • The Company will supply reliable products at competitive price with improved technology to the satisfaction of customers. • The Company shall ensure prompt and efficient after sales service backed by quality spare parts. • All employees in every function and level shall strive to achieve high quality of work through continuous improvement Guided by global quality system standards. LORVEN EDUCATIONAL CENTRE 47
  • 48. ANALYSIS OF FINANCIAL WEALTH V.S.T. TILLERS TRACTORS LTD • Product costs shall be minimized without lowering quality and sustained efforts shall be made to reduce quality costs at all times Sales and service of product: Over the years, VST Tillers Tractors Ltd., has established an extensive and efficient countrywide sales and after-sales service network backed by easy availability of spare parts. Periodic training programmes for dealers and customers are taken up to keep them constantly updated on improvements in its products. Keeping in line with India's liberalized economic policies and guided by the conviction that quality products are marketable world wide, VST Tillers Tractors Ltd., has successfully launched global marketing of its products. It is marketing Diesel Engines, Power Tillers and Tractors to regions of Asia, Middle East, Africa, Europe and United States of America. SWOT ANALYSIS STRENGTH • During the year review, the Indian economy witnessed a GDP growth rate of 8% with agriculture contributing around 2.4% and is estimated to grow to 3.2%. • The central and state governments continue to give priority to agriculture through various subsidy schemes. • This apart, Banks have promoted farm mechanization by providing timely finance which has generated good demand for power tillers and your company continues to maintain its lead in the power tiller industry in India by delivering a superior value product. LORVEN EDUCATIONAL CENTRE 48
  • 49. ANALYSIS OF FINANCIAL WEALTH V.S.T. TILLERS TRACTORS LTD • The performance is even more satisfying when viewed in the light of the competitive pressure from low cost Chinese brand power tillers. WEAKNESS • In the domestic tractor segment, the industry as a whole grew to 262000 units during 2005-2006 from226000 units in the previous year. • The western and southern states of Maharashtra, Gujarat, AP, Karanataka and Kerala primarily contributed to the above growth. • Your company commands a niche market share in Maharashtra and Gujarat in the smaller HP tractor and sales in this segment are expected and sales in this segment are expected to grow in the coming year. • To cater to newer markets, the manufacturing capacities and aesthetics for tractors are being upgraded that will lead to higher revenue streams for the current year. OPPORTUNITIES • The growth of the power tiller and tractor industry could be direly linked to the GDP growth of the Indian economy. • As mentioned above, the country’s GDP grew by a robust 8% making it one of the faster growing large economies in the world. • Easier and cheaper credit availability to farmer and awareness of the benefits to farmer mechanization provided opportunities for higher sales and optimum utilization of capacities. • The government’s policy on agriculture and the introduction of the Bharat Nirman Programme for creating massive rural infrastructure will directly benefit demand for your company’s product. LORVEN EDUCATIONAL CENTRE 49
  • 50. ANALYSIS OF FINANCIAL WEALTH V.S.T. TILLERS TRACTORS LTD THREATS • Several importers realizing the business potential for power tillers have commenced imports to quickly capitalize on this front. • These tillers are low cost unit and qualify under subsidy schemes that could intensify competition thereby affecting demand in the future various strategies have been planned including a tie up with a Chinese tiller manufacture for marketing power tillers. • Your company is continuing to pursue strategies such as cutting casts, including manufacturing efficiencies, strengthening marketing initiatives and garner greater economies of scale to stay ahead. • During the year, importing duties have been reduced and further reduction in line with WTO obligations may affect demand in this price sensitive may affect demand in this price sensitive market which could bring down price further that may affect the demand pattern. LORVEN EDUCATIONAL CENTRE 50
  • 51. ANALYSIS OF FINANCIAL WEALTH V.S.T. TILLERS TRACTORS LTD RATIO ANALYSIS AND INTERPRETATION TABLE-1 Table showing the Current Ratio of the VST TILLERS TRACTORS LTD for the Years 2003-2004 to 2005-2006 Current Assets Current Ratio = Current liabilities (Rs in Lakhs) Current Year Current liabilities current Ratio Assets 2003-2004 4534.88 2056.55 2.21 2004-2005 5184.93 2094.54 2.48 2005-2006 5088.99 2558.01 1.99 ANALYSIS- The Current ratio of the VST TILLERS TRACTORS LTD for the Year 2003-2004 was 2.21 %, for the Year 2004-2005 was 2.48%, and for the Year 2005-2006 was 1.99%. INFERENCE- 2:1 is considered as standard for the ratio. In all three years, it is far above than the ideal level. The Current Assets of the VST TILLERS TRACTORS LTD for the Year 2004-2005 was 2.48% which much higher when compared other two-year 2003-2004, 2005-2006. LORVEN EDUCATIONAL CENTRE 51
  • 52. ANALYSIS OF FINANCIAL WEALTH V.S.T. TILLERS TRACTORS LTD GRAPH -1 Graph Showing the Current Ratio for the years 2003-2004 to 2005-2006 Current Ratio 3 Ratios 2 1 2.21 2.48 1.99 0 2003-2004 2004-2005 2005-2006 years LORVEN EDUCATIONAL CENTRE 52
  • 53. ANALYSIS OF FINANCIAL WEALTH V.S.T. TILLERS TRACTORS LTD TABLE-2 Table showing the Liquid Ratio of the VST TILLERS TRACTORS LTD for the Years 2003-2004 to 2005-2006 Liquid Assets Liquid Assets to current liabilities Ratio = Current liabilities (Rs in Lakhs) Year Liquid Assets Current liabilities Liquid Ratio 2003-2004 2506.02 2056.55 1.22 2004-2005 3178.15 2094.54 1.52 2005-2006 2926.66 2558.01 1.14 ANALYSIS The Liquid Assets of the VST TILLERS TRACTORS LTD for the Year 2003-2004 was 1.22 %, for the Year 2004-2005 was 1.52%, and for the Year 2005-2006 was 1.14%. INFERENCE The company has maintained its liquidity ratio above the standard level in all the three years 2004-2005 was 1.52% more as compared to the year 2003-2004 and 2005-2006. LORVEN EDUCATIONAL CENTRE 53
  • 54. ANALYSIS OF FINANCIAL WEALTH V.S.T. TILLERS TRACTORS LTD GRAPH -2 Graph Showing the Liquid Assets to Current Liabilities Ratio for the years 2003-2004 to 2005-2006 Liquid Ratio 1.6 1.4 1.2 1 Ratios 0.8 1.52 0.6 1.22 1.14 0.4 0.2 0 2003-2004 2004-2005 2005-2006 years LORVEN EDUCATIONAL CENTRE 54
  • 55. ANALYSIS OF FINANCIAL WEALTH V.S.T. TILLERS TRACTORS LTD TABLE-3 Table showing the Cash Ratio of the VST TILLERS TRACTORS LTD for the Years 2003-2004 to 2005-2006 Cash Ratio = Cash + Marketable Securities Current Liabilities Cash & Bank Balances = Current Liabilities & Provisions [Rupees in lakhs] Year Cash Current liabilities Cash Ratio 2003-2004 363.18 2056.55 0.177 2004-2005 535.18 2094.54 0.255 2005-2006 647.597 2558.01 0.253 ANALYSIS: The above table indicates that the Cash ratio in the year 2003-04 was 0.177 in the year 2004-05 it was 0..255 and in the year 2005-06 it was 0.253. INFERENCE: The Cash ratio of the firm shows decreasing flow in the year 2003-2004 as compared to 2004-2005 and increasing from in the year 2004-05 as compared to 2005-06 LORVEN EDUCATIONAL CENTRE 55
  • 56. ANALYSIS OF FINANCIAL WEALTH V.S.T. TILLERS TRACTORS LTD GRAPH -3 Graph Showing the Cash Ratio for the years 2003-2004 to 2005-2006 Cash Ratio 0.3 0.2 Ratios 0.1 0.255 0.253 0.177 0 2003-2004 2004-2005 2005-2006 years LORVEN EDUCATIONAL CENTRE 56
  • 57. ANALYSIS OF FINANCIAL WEALTH V.S.T. TILLERS TRACTORS LTD TABLE-4 Table showing the Liquid Assets to Total Assets Ratio of the VST TILLERS TRACTORS LTD for the Years 2003-2004 to 2005-2006 Liquid Assets Liquid Assets to Total Assets Ratio = Total Assets (Rs in Lakhs) Liquid Assets to Year Liquid Assets Total Assets Total Assets Ratio (%) 2003-2004 2506.02 7049.85 35.547 2004-2005 3178.15 7991.91 39.767 2005-2006 2926.66 7967.95 36.73 ANALYSIS- The Liquid Assets to Total Assets Ratio of the VST TILLERS TRACTORS LTD for the Year 2003-2004 was 35.54%, for the Year 2004- 2005 was 39.767%, and for the Year 2005-2006 was 36.73%. INFERENCE- The Liquid Assets to Total Assets Ratio of the VST TILLERS TRACTORS LTD for the Year 2004-2005 was 39.767% which much higher when compared other two-year 2003-2004, 2005-2006. LORVEN EDUCATIONAL CENTRE 57
  • 58. ANALYSIS OF FINANCIAL WEALTH V.S.T. TILLERS TRACTORS LTD GRAPH -4 Graph Showing the Liquid Assets to Total Assets Ratio for the years 2003-2004 to 2005-2006 Liquid Assets to Total Assets 42 40 38 36 39.767 34 35.547 36.73 32 2003-2004 2004-2005 2005-2006 years LORVEN EDUCATIONAL CENTRE 58
  • 59. ANALYSIS OF FINANCIAL WEALTH V.S.T. TILLERS TRACTORS LTD TABLE-5 Table showing the Liquid Assets to Total Investments Ratio of the VST TILLERS TRACTORS LTD for the Years 2003-2004 to 2005-2006 Liquid Assets Liquid Assets to Total investments Ratio = Total investments (Rs in Lakhs) Liquid Liquid Assets to Total Year Total investments Assets investments 50.63 2003-2004 2506.02 49.50 62.60 2004-2005 3178.15 50.77 35.03 2005-2006 2926.66 83.54 ANALYSIS: The Liquid Assets to Total Investments Ratio of the VST TILLERS TRACTORS LTD for the Year 2003-2004 was 50.63%, for the Year 2004- 2005 was 62.60%, and for the Year 2005-2006 was 35.03%. INFERENCE- The Liquid Assets to Total Investments Ratio of the VST TILLERS TRACTORS LTD for the Year 2004-2005 was 62.60% which much higher when compared to other two years 2003-2004, 2005-2006. LORVEN EDUCATIONAL CENTRE 59
  • 60. ANALYSIS OF FINANCIAL WEALTH V.S.T. TILLERS TRACTORS LTD GRAPH-5 Graph Showing the Liquid Assets to Total Investments Ratio for the years 2003-2004 to 2005-2006 Liquid Assets to Total Investments Ratio 100 Ratios 50 50.63 62.6 35.03 0 2003-2004 2004-2005 2005-2006 years LORVEN EDUCATIONAL CENTRE 60
  • 61. ANALYSIS OF FINANCIAL WEALTH V.S.T. TILLERS TRACTORS LTD TABLE-6 Table showing the Debt- Equity Ratio of the VST TILLERS TRACTORS LTD for the Years 2003-2004 to 2005-2006 Long Term Debts Debt - Equity Ratio = Share holders Equity (Rs in Lakhs) Year Debt Equity Debt- Equity Ratio 2003-2004 2056.59 3780.86 53.75 2004-2005 2094.54 4193.33 49.94 2005-2006 2558.01 4758.72 53.74 ANALYSIS: Debt Equity Ratio of VST TILLERS TRACTORS LTD for the Year 2003- 2004 was 53.75%, for the Year 2004-2005 was 49.94%, and for the Year 05- 06 was 53.74%. INFERENCE: When the Firm’s Debt-Equity Ratio is high it indicates that the firm has to face difficulty in meeting its fixed obligation. Lower the Ratio it is less difficult to meet its fixed obligation. In the Year 2004-2005 the Debt Equity Ratio of VST TILLERS TRACTORS LTD is 49.94% which much lower when compared to the other two year 2003-2004, 2005-2006. LORVEN EDUCATIONAL CENTRE 61
  • 62. ANALYSIS OF FINANCIAL WEALTH V.S.T. TILLERS TRACTORS LTD GRAPH-6 Graph Showing the Debt Equity Ratio for the years 2003-2004 to 2005-2006 Debt- Equity Ratio 56 54 Ratios 52 50 54.39 53.75 48 49.94 46 2003-2004 2004-2005 2005-2006 years TABLE-7 LORVEN EDUCATIONAL CENTRE 62
  • 63. ANALYSIS OF FINANCIAL WEALTH V.S.T. TILLERS TRACTORS LTD Table showing the Proprietary Ratio of the VST TILLERS TRACTORS LTD for the Years 2003-2004 to 2005-2006 Shareholders Funds Proprietory Ratio = Total Assets (Rs in Lakhs) Share Holders Proprietary Year Total Assets Funds Ratio (%) 2003-2004 3780.86 7099.89 53.25 2004-2005 4193.33 8020.97 52.27 2005-2006 4758.72 8116.95 58.63 ANALYSIS The Proprietary Ratio of the VST TILLERS TRACTORS LTD for the year 2003-2004 was 53.25% the year 2004-2005 was 52.27%, and for the year 2005-2006 was 58.63%. INFERENCE Higher the Proprietary Ratio, Greater the Long Term stability for the Firm, the firms Proprietary Ratio in the year 2005-2006 is 58.63% which is Higher when compared to the other two years 2003-2004, 2004-2005. LORVEN EDUCATIONAL CENTRE 63
  • 64. ANALYSIS OF FINANCIAL WEALTH V.S.T. TILLERS TRACTORS LTD GRAPH-7 Graph Showing the Proprietary Ratio for the years 2003-2004 to 2005- 2006 propretory ratio 60 55 ratios 58.63 50 53.25 52.28 45 2003-2004 2004-2005 2005-2006 years TABLE-8 LORVEN EDUCATIONAL CENTRE 64
  • 65. ANALYSIS OF FINANCIAL WEALTH V.S.T. TILLERS TRACTORS LTD Table showing the Fixed Assets to Net worth Ratio of the VST TILLERS TRACTORS LTD for the Years 2003-2004 to 2005-2006 Fixed Assets Fixed Assets to Networth Ratio = Networth (Rs in Lakhs) Fixed Assets to Year Fixed Assets Net worth Net worth Ratio (%) 2003-2004 2514.98 3780.86 66.52 2004-2005 5184.93 4193.33 123.64 2005-2006 5088.99 4738.72 107.39 ANALYSIS – The Fixed Asset to Net worth Ratio of the VST TILLERS TRACTORS LTD for the year 2003-2004 was 66.52%, for the Year 2004- 2005 was 123.64%, and for the Year 2005-2006 was 107.39%. INFERENCE- The Fixed Asset to Net worth Ratio of the VST TILLERS TRACTORS LTD for the year 2004-2005 was 123.64%, which is higher when compared to other two years 2003-2004, 2005-2006. LORVEN EDUCATIONAL CENTRE 65
  • 66. ANALYSIS OF FINANCIAL WEALTH V.S.T. TILLERS TRACTORS LTD GRAPH-8 Graph Showing the Fixed Assets to Net worth Ratio for the years2003- 2004 to 2005-2006 Fixed Assets to Networth Ratio 140 120 100 80 ratios 60 123.64 107.39 40 66.52 20 0 2003-2004 2004-2005 2005-2006 Years TABLE-9 LORVEN EDUCATIONAL CENTRE 66
  • 67. ANALYSIS OF FINANCIAL WEALTH V.S.T. TILLERS TRACTORS LTD Table showing the Liquid Asset to Net worth Ratio of the VST TILLERS TRACTORS LTD for the Years 2003-2004 to 2005-2006 Liquid Assets Liquid Assets to Networth Ratio = Networth (Rs in Lakhs) Liquid Asset to Year Liquid Assets Net worth Net worth Ratio 2003-2004 2506.02 3780.86 .6652 2004-2005 3178.15 4193.33 1.2364 2005-2006 2926.66 4738.72 1.0739 ANALYSIS- The Liquid Asset to Net worth Ratio of the VST TILLERS TRACTORS LTD for the year 2003-2004 was .6652 Times, for the Year 2004-2005 was 1.2364 Times and for the Year 2005-2006 was 1.0739 Times. INFERENCE- The Liquid Asset to Net worth Ratio of the VST TILLERS TRACTORS LTD for the year 2004-2005 was 1.2364 Times which is much higher when compared to other two year 2003-2004, 2005-2006. LORVEN EDUCATIONAL CENTRE 67
  • 68. ANALYSIS OF FINANCIAL WEALTH V.S.T. TILLERS TRACTORS LTD GRAPH-9 Graph Showing the Liquid Assets to Net worth Ratio for the years 2003-2004 to 2005-2006 Liquid Asset to Networth Ratio 1.4 1.2 1 0.8 ratios 0.6 1.2364 1.0739 0.4 0.6652 0.2 0 2003-2004 2004-2005 2005-2006 Years TABLE-10 LORVEN EDUCATIONAL CENTRE 68
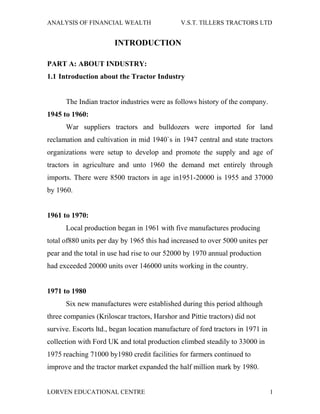
  • 69. ANALYSIS OF FINANCIAL WEALTH V.S.T. TILLERS TRACTORS LTD Table showing the Net Profit Ratio of the VST TILLERS TRACTORS LTD for the Years 2003-2004 to 2005-2006 Net Profit Net Profit = *100 Sales (Rs In Lakhs) Net Profit Ratio Year Net Profit Sales (%) 2003-2004 578.56 10313.75 5.60 2004-2005 585.84 11272.43 5.19 2005-2006 741.66 13164.67 5.633 ANALYSIS- The Net Profit Ratio of the VST TILLERS TRACTORS LTD for the Year 2003-2004 was 5.60%, for the year 2004-2005 was 5.19%, and for the year 2005-2006 was 5.633%. INFERENCE- Net Profit ratio indicates the efficiency of the firm’s. Higher the Net Profit it indicates the firm is Positive and in an advantageous position. The Net Profit Ratio of the VST TILLERS TRACTORS LTD during the year 2005-2006 was 5.633% which much higher when compared to other two years 2003- 2004, 2004-2005. LORVEN EDUCATIONAL CENTRE 69
  • 70. ANALYSIS OF FINANCIAL WEALTH V.S.T. TILLERS TRACTORS LTD GRAPH-10 Graph Showing the Net Profit Ratio for the years 2003-2004 to 2005- 2006 Net profit ratio 5.7 5.6 5.5 5.4 ratios 5.3 5.61 5.6 5.2 5.1 5.19 5 4.9 2003-2004 2004-2005 2005-2006 years . TABLE-11 LORVEN EDUCATIONAL CENTRE 70
  • 71. ANALYSIS OF FINANCIAL WEALTH V.S.T. TILLERS TRACTORS LTD Table showing the Inventory Ratio of the VST TILLERS TRACTORS LTD for the Years 2003-2004 to 2005-2006 Inventory Inventory Ratio = *100 Current Assets (Rs in Lakhs) Current Inventory Year Inventory Assets Ratio in % 2003-2004 2028.86 4534.88 44.74 2004-2005 2006.77 5184.93 38.7 2005-2006 2162.33 5088.99 42.49 ANALYSIS: The above table indicates that the inventory ratio in the year 2003-04 was 44.74%, in the year 2004-05 it was 38.70% and in the year 2005-06 it was 42.49%. INFERENCE: The ratio shows the up and downfall trend. In the year 2003-04, it is recorded the highest (44.74%) and lowest (38.7%) in the year 2004-05. LORVEN EDUCATIONAL CENTRE 71
  • 72. ANALYSIS OF FINANCIAL WEALTH V.S.T. TILLERS TRACTORS LTD GRAPH-11 Graph Showing the Inventory Ratio for the years 2003-2004 to 2005- 2006 Inventory Ratio 50 Ratios 45 40 44.74 42.49 38.7 35 2003-2004 2004-2005 2005-2006 years LORVEN EDUCATIONAL CENTRE 72
  • 73. ANALYSIS OF FINANCIAL WEALTH V.S.T. TILLERS TRACTORS LTD TABLE-12 Table showing Operating Profit Ratio of the VST TILLERS TRACTORS LTD for the Years 2003-2004 to 2005-2006 Gross profit Gross Profit Ratio = *100 Sales (Rs in Lakhs) Operating Year Gross profit Sales Profit Ratio (%) 2003-2004 3717.59 10403.92 35.73 2004-2005 3599.35 11272.43 31.93 2005-2006 21709.17 13164.67 164.91 ANALYSIS- The Operating Profit Ratio the VST TILLERS TRACTORS LTD for the year 2003-2004 was 35.73%, for the year 2004-2005 was 31.93%, and for the year 2005-2006 was 164.91%. INFERENCE The Gross Profit Ratio of the VST TILLERS TRACTORS LTD during the year 2005-2006 was 164.91% which much higher when compared to the other two year 2003-2004, 2004-2005. LORVEN EDUCATIONAL CENTRE 73
  • 74. ANALYSIS OF FINANCIAL WEALTH V.S.T. TILLERS TRACTORS LTD GRAPH-12 Graph Showing the Operating Profit Ratio for the years2003-2004 to 2005-2006 Gross profit ratio 200 150 Ratios 100 164.91 50 35.73 31.93 0 2003-2004 2004-2005 2005-2006 Years TABLE-13 LORVEN EDUCATIONAL CENTRE 74
  • 75. ANALYSIS OF FINANCIAL WEALTH V.S.T. TILLERS TRACTORS LTD Table showing Return on Equity funds Ratio of the VST TILLERS TRACTORS LTD for the Years 2003-2004 to 2005-2006 Profit After Tax Return on Equity Funds = Equity Shareholders fund (Rs in Lakhs) Return on Year Profit After Tax Net worth Equity funds (%) 2003-2004 578.56 3780.86 15.3 2004-2005 585.84 4193.33 13.97 2005-2006 741.66 4738.72 15.65 ANALYSIS- The Return on Equity Ratio of the VST TILLERS TRACTORS LTD for the Year 2003-2004 was 15.3%, for the year 2004-2005 was 13.9%, and for the year 2005-2006 was 15.65%. INFERENCE- The Return on Equity Ratio shows the profit percentage of the Equity shareholders. The investors favor higher Return on Equity Ratio. The Return on Equity Ratio of the VST TILLERS TRACTORS LTD for the Year 2005- 2006 was 15.65%, which is higher when compared to the other two years 2003-2004, 2004-2005. LORVEN EDUCATIONAL CENTRE 75
  • 76. ANALYSIS OF FINANCIAL WEALTH V.S.T. TILLERS TRACTORS LTD GRAPH-13 Graph Showing the Return on Equity funds Ratio for the years2003- 2004 to 2005-2006 Return on Equity funds Ratio 16 15.5 15 Ratios 14.5 15.65 15.3 14 13.5 13.97 13 2003-2004 2004-2005 2005-2006 years . TABLE-14 LORVEN EDUCATIONAL CENTRE 76
  • 77. ANALYSIS OF FINANCIAL WEALTH V.S.T. TILLERS TRACTORS LTD Table showing Earnings Per Share Ratio of the VST TILLERS TRACTORS LTD for the Years 2003-2004 to 2005-2006 Net Profit After Tax Earnings Per Share = Number of Equity Shares (In Rs) Net Profit After No of Equity Earnings Per Year tax Shares Share Ratio (In Rs) 2003-2004 57855631 5759685 10.04 2004-2005 58583878 5759685 10.17 2005-2006 74166443 5759685 12.88 ANALYSIS The Earnings per Share Ratio of the VST TILLERS TRACTORS LTD for the Year 2003-2004 was 10.04 Rs, for the year 2004-2005 was 10.17 Rs, for the year 2005-2006 12.88 Rs. INFERENCE- This Ratio measures the Profitability in terms of the Earnings per share. The earnings per share of the VST TILLERS TRACTORS LTD in the year 2005-2006 was 12.88 which is higher than the other two years 2003- 2004, 2004-2005. LORVEN EDUCATIONAL CENTRE 77
  • 78. ANALYSIS OF FINANCIAL WEALTH V.S.T. TILLERS TRACTORS LTD GRAPH-14 Graph Showing the Earnings per Share Ratio for the years2003-2004 to 2005-2006 Earnings Per Share 14 12 10 8 6 12.88 10.04 10.17 4 2 0 2003-2004 2004-2005 2005-2006 TABLE-15 LORVEN EDUCATIONAL CENTRE 78
  • 79. ANALYSIS OF FINANCIAL WEALTH V.S.T. TILLERS TRACTORS LTD Table showing Return on Assets Ratio of the VST TILLERS TRACTORS LTD for the Years 2003-2004 to 2005-2006 Net Profit after Tax Return on Assets = Total Assets (Rs in Lakhs) Net Profit after Total Assets Return on Year Assets Ratio Tax (%) 2003-2004 578.56 7099.89 8.15 2004-2005 585.84 8020.97 7.30 2005-2006 741.66 8116.95 9.14 ANALYSIS- Return on Assets of the VST TILLERS TRACTORS LTD for the Year 2003-2004 was 8.15%, for the Year 2004-2005 was 7.30%, and for the year 2005-2006 was 9.14%. INFERENCES- The Return on Assets Ratio of the VST TILLERS TRACTORS LTD for the year 2005-2006 was 9.14% which much higher when compared to other two year 2003-2004, 2004-2005. LORVEN EDUCATIONAL CENTRE 79
  • 80. ANALYSIS OF FINANCIAL WEALTH V.S.T. TILLERS TRACTORS LTD GRAPH-15 Graph Showing the Return on Assets Ratio for the years 2003-2004 to 2005-2006 Return on Assets Ratio 10 8 6 9.14 4 8.15 7.3 2 0 2003-2004 2004-2005 2005-2006 Years SUMMARY OF FINDINGS AND CONCLUSION FINDINGS LORVEN EDUCATIONAL CENTRE 80