
Empfohlen
Empfohlen
Weitere ähnliche Inhalte
Was ist angesagt?
Was ist angesagt? (11)
Andere mochten auch
Andere mochten auch (13)
Ähnlich wie How to Develop a Response to Intervention Model
Ähnlich wie How to Develop a Response to Intervention Model (20)
Kürzlich hochgeladen
Kürzlich hochgeladen (20)
How to Develop a Response to Intervention Model
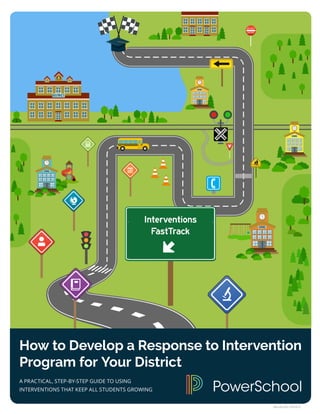
- 1. AN-eb-001-091816 How to Develop a Response to Intervention Program for Your District A PRACTICAL, STEP-BY-STEP GUIDE TO USING INTERVENTIONS THAT KEEP ALL STUDENTS GROWING
- 2. PowerSchool.com | 2 Dr. Sally I’Anson Dr. I’Anson is a PowerSchool thought leader. She has trained educators in curriculum, instruction, and assessment as well as in data-driven educational practices. She has taught at many levels; served as an administrator in private, public, and charter school settings; and consulted with state departments of education. CHAPTER 1 Response to Intervention Basics: What Are They and Why Do They Exist?..........................................................................................................3 • The 10-Point Guide to Develop a Shared Understanding of Your School’s RtI Model.............................................................................................4 • The Three Main Reasons Interventions Were Created....................................... 5 CHAPTER 2 Defining Interventions.................................................................................8 CHAPTER 3 Differentiating the Tiers...........................................................................10 CHAPTER 4 Identifying Student Struggles................................................................11 CHAPTER 5 Identifying Your Research-Based Interventions Resources and Materials......................................................................................................15 CHAPTER 6 Assigning Interventions............................................................................17 • Setting Goals for Interventions.................................................................................17 • Establishing Time of Day for Interventions..........................................................18 • Frequency and Duration of Interventions.............................................................19 CHAPTER 7 Determining Who Will Deliver Intervention Instruction......20 CHAPTER 8 Monitoring Student Progress.................................................................21 CHAPTER 9 Informing Parents of Student Progress...........................................23 CHAPTER 10 Determining Intervention Efficacy..................................................24 RESOURCES...................................................................................................................................25 REFERENCES.................................................................................................................................26
- 3. PowerSchool.com | 3 The purpose of this eBook is to clear up ongoing confusion among educators as to what interventions are and how Response to Intervention is intended to work. A brief history of the interventions regulations that were finalized in 2005 provides insight into some of the reasons they were designed and what they were expected to accomplish in schools. Many educators are still struggling to develop a shared understanding of the RtI model that exists within their own schools. This eBook provides language to describe the existing RtI model so that all school staff can understand how interventions function in the building—and also in the district at large. Also included in this eBook are a variety of visuals and examples to assist readers in mastering RtI terms and processes, as well as clear guidelines and examples explaining key steps to building successful intervention programs. Response to Intervention Basics: What Are They and Why Do They Exist? “RTI is not a program you can buy. It is not a pathway to special education. It is a method of organizing and coordinating school resources to create a more efficient range of options that serve all students in danger of not reaching their potential.” Searle, 2010
- 4. PowerSchool.com | 4 The 10-Point Guide to Develop a Shared Understanding of Your School’s RtI Model In order for interventions to work successfully, principals, teachers, and parents need to fully understand the RtI model in their respective school or district. But before school leadership teams can develop a shared understanding of their school-based RtI program, central office instructional staff must create the district’s RtI plan and share it with principals. Mastering the following 10 topics will help districts develop an RtI model that can then be shared across schools to create a shared understanding for RtI success. Throughout the eBook these topics will be explained in greater detail. After reading this eBook you will be able to: Define what interventions are— and what they are not Set goals and metrics for interventions Articulate the differences in intervention services in Tiers I, II, and III Identify struggling students who are in need of an intervention Assign an intervention to identified students Set the time, frequency, and duration that intervention sessions should last Choose who will administer interventions Monitor and record individual student progress for each intervention Decide when to move students between intervention tiers Determine which intervention materials and resources to use to deliver interventions
- 5. PowerSchool.com | 5 (NCES, 2016) (Coates, 1985) 1 2 Three Main Reasons Interventions Were Created Knowing why and when federal and state interventions rules and regulations were created can help teachers develop a deeper understanding of the purpose behind the school or district’s RtI model and allow them to make better sense of it in their own minds. The No Child Left Behind Act of 2001 required states to collect a wide range of data on subgroups of students, and this mandate revealed several unwelcome education trends. For example, the percentage of students receiving special education services rose from 1.8 percent in 1975 to a record high of 13.8 percent in 2004-2005.1 Perhaps the most significant factor that contributed to the swift demand for intervention services was the Education for Handicapped Children (EHA) legislation, also referred to as Public Law-94-142, which “establish[ed] and protect[ed] the right to education for all handicapped children and provid[ed] assistance to the States in carrying out their responsibilities” prescribed by the United States Constitution to give all children equal access to education.2 While no one can debate that virtue of this legislation, the practical application of this legislation led to numerous financial and ethical quandaries for schools, parents, and students. The federal Department of Education reacted to this and several other trends by establishing regulatory requirements designed to mitigate or reverse them. Three of the most troublesome education issues evident during the last three decades of the 20th century were the over-identification of students referred for special education services, the achievement gap between low-income students and their more affluent peers, and low on-time graduation rates. Each issue is explained in greater detail in the following pages. The ultimate goal is to empower school leaders and teachers with the knowledge they need to marshal resources to create options for struggling students.
- 6. PowerSchool.com | 6 (NCES, 2016) (APA, 2012) 1 2 Across the country, students struggling in school have been over-identified for needing special education services. The occurrence of students requiring special education services across the general population of all students is now roughly 12 percent.1 Response to Intervention programs require schools to provide at least two levels of additional support and regularly monitor student progress at these levels before referring a student for special education services. This ensures that a student struggling with a particular skill or skill set, behavioral issue, or social-emotional challenge for a finite period of time does not become inappropriately placed in an education program that is unnecessarily restrictive. Unfortunately, many students struggle in school due to factors associated with race/ethnicity and poverty. Paul Barton, in his 2004 study “Why Does the Gap Persist?”, concluded that achievement gaps by race/ethnicity and income mirror inequalities in those aspects of schooling, early life, and home circumstances that research has linked to school achievement. In fact, “students from low-income families dropped out of school five times more than students from high-income families in 2009.”2 RtI programs identify struggling students early and throughout their schooling to address learning deficits before they develop into chronic learning problems that result in grade level or course failures. RtI programs with a structured assessment plan for student identification and focused progress monitoring tools enable teachers, working with critical data on individual students’ learning needs, to provide targeted support to prevent failures. Data from RtI program outcomes can be used by schools to evaluate the effectiveness of their teaching staff and intervention curricula, as well as the amount of time spent on interventions. problem no. 1 Over-Identification of Students Referred for Special Education Services problem no. 2 Disproportionately High Failure Rates for At-Risk StudentsIt is important to note that RtI does not prevent a school leader, teacher, or parent from referring a student for special education services at any time. families dropped out of school five times more than students from high-income families in 2009. Students from low-income
- 7. PowerSchool.com | 7 (Pharris-Ciurej, Hirschman, and Willhoft, 2012)1 In response to studies revealing the national graduation rate to be alarmingly low, the United States Department of Education, under the Elementary and Secondary Education Act (reauthorized in 2001 as the No Child Left Behind Act), required schools to meet certain graduation thresholds in order to achieve accountability benchmarks. High schools throughout the nation developed Early Warning Systems (EWS) to target students who were disengaged academically and/or socially and at risk of dropping out. Students identified by the various EWS were provided additional services designed to keep them in school and help them graduate on time. For instance, scholars have found that addressing the so-called “ninth-grade shock,” a marked decline in academic performance when a student enters high school, can go a long way toward addressing issues of high school attrition.1 An extensive analysis of the best practices for dropout prevention conducted by Dynarski, et al. (2008) points out that both behavioral and psychological components of student engagement ought to be identified and targeted if schools hope to mitigate the problem of adolescent drop-outs. This means that schools need to find ways to monitor and track attendance, class participation, and other “intangibles” like student interest and enthusiasm, as well as a sense of belonging and identification with the school. In many cases, a student’s failure to graduate from high school is the summation of years of academic struggles. Researchers have found that a child’s failure or success at certain development milestones early on in his or her academic career can often predict whether or not the student will later drop out. problem no. 3 Low On-Time High School Graduation Rate
- 8. PowerSchool.com | 8 Somewhat surprising are the wide range of educator interpretations of what the word “intervention” means. Perhaps the best way to explain the term is in the chart below, designed to illustrate what interventions are and are not. Examples of each type of intervention are provided below with information from the work of Andrew M.I. Lee. Defining Interventions Interventions ARE… examples … research-based. Read 180™ is an intervention program recognized by the What Works Clearinghouse as effective for improving adolescent literacy. … a set of steps to help students in an area of weakness. A plan to provide reading comprehension intervention instruction, in a small group setting, two times per week for 30 minutes each. … a way for schools and parents to track student progress. Weekly or biweekly written reports sent home to parents showing student progress on intervention probes or assessments. … intentionally delivered to students identified by a universal screener. Students are identified using a universal screener and assessed throughout the school year using Early Warning System indicators. … specific in the number of weeks or months the intervention will last. The third-grade math basic skills intervention will last for nine weeks. … formal in structure and reviewed at set intervals. Each student’s intervention progress will be reviewed weekly and monthly by the interventions teacher and at the conclusion of the intervention by the principal and intervention team. … implemented with fidelity to the research model specified in the intervention program. Interventions are administered for the indicated amount of time and frequency and employ the materials and assessments as specified. … flexible and changed if not producing expected improvements in learning. Interventions that are showing little or no positive impact on student outcomes should be discontinued and replaced with a different intervention. … delivered during the school day. A mathematics intervention block will occur daily for identified students in grades 3 from 1:15 to 1:45.
- 9. PowerSchool.com | 9 Interventions are NOT… examples … a computer program or application or an instructional kit. Study Island, iExcel, Soar to Success, Accelerated Reader. … solely teacher developed. A collection of worksheets or website materials targeted toward certain standards or skills. … teaching strategies. Interactive notebooks, Venn diagrams, Brain Gym®, buddy reading, or project-based learning. … accommodations (that is, changes in environment to give students equal access to learning). Read-aloud for assessments, untimed testing, use of a calculator. … for all students or subgroups of students based on race, ethnicity, socioeconomic status, or identification as English language learners or special education students. All ELL students are pulled out for additional language instruction. … part of remedial instruction delivered as a result of classroom formative assessment. Common formative assessment data reveals that Mr. Brown’s second-grade students are still struggling with how to subtract two-digit numbers. He plans several corrective instruction lessons designed to ensure they master this skill. … informal, such that progress is not tracked. Teachers provide primarily anecdotal and verbal feedback on students’ progress. … implemented according to school and teacher preferences. The school schedule does not permit a full 30-minute intervention block, so administrators adjust and provide a 22-minute block. … rigid programs delivered without regard for student learning outcomes. Students start on Page 1 of a remedial workbook and the intervention ends when they finish it. … provided when teacher or student has free time (e.g., before or after school or during lunch or recess). Struggling students meet with a teacher for Lunch Bunch in the cafeteria to review multiplication tables.
- 10. PowerSchool.com | 10 In the language of RtI, interventions are categorized into three levels, known as tiers, based on the intensity of the student’s difficulty and the school’s attempt to remedy it. School personnel often struggle with how to determine which students should be placed in Tier I, II, or III interventions. Having a clearly articulated plan for making these determinations is critical to RtI success. Below you will find a summary, taken from the work of Edward Shapiro, of the differences between tiers. The tiers are defined in increasing order of the risk of student failure. Differentiating the Tiers TIER I (Low Risk) TIER II (Some Risk) TIER III (High Risk) • All students receive instruction within an evidence-based, scientifically researched core program • Considered the key component of tiered instruction • Students at some risk for academic failure • All students are administered a universal screener • Students who fall below expected levels of accomplishment (RtI model calls them benchmarks) • Students at high risk for academic failure • Needs identified through standards-specific assessment • Instruction delivered in groups of 3-5 students • Some models use one-to-one instruction (considered special education) • May include children not identified as being in need of special education services but whose needs are at the “intensive level”. If not responsive to intervention, student is referred for special education testing • Interventions focus on specific student’s needs • Assumes high-quality teaching and ongoing professional development for teachers • Instruction provided in small groups of 5-8 students • Instruction is typically synonymous with a core reading or match curriculum aligned with state standards
- 11. PowerSchool.com | 11 (Balfanz and Fox, 2011)1 Identifying Struggling Students Identifying students who have struggled—and who may be likely to continue to struggle in school—is a top priority. Technology now provides educators with student data at their fingertips 24/7. It is hugely helpful to use platforms that compile data from disparate sources (e.g., grades, attendance, discipline, interim assessments, diagnostic assessments, etc.) to target students who are in danger of failing based on academic, behavioral, and/or social-emotional indicators. These interventions systems ensure that students do not fall through the proverbial cracks in the system. Much work has been done in the area of identifying struggling students, and we now know exactly what to look for when identifying students in need of intervention(s). Robert Balfanz, a scholar at Johns Hopkins University, has done extensive research on dropouts and found that middle school is a critical time to identify “red flags” in student attendance, behavior, and academic performance. In fact, “sixth- grade students with one or more of the [primary ‘off-track’] indicators may have only a 10-20 percent chance of graduating from high school on time or within one year of expected graduation.”1 “Sixth-grade students with one or more of the [primary ‘off track’] indicators may have only a 10-20 percent chance of graduating from high school on time or within one year of expected graduation.” Balfanz and Fox, 2011
- 12. PowerSchool.com | 12 An outstanding example of a district RtI plan is the one created by Shelby County Schools, located throughout metropolitan Memphis, Tennessee. Below are several helpful graphics that district administrators use to explain the tiers and assign students to them within their RtI model. The pink arrow in the graphic below presents a significant element of the RtI model that is often misunderstood by many teachers. The goal of RtI is to remediate student weaknesses in Tiers II and III so that students experience success in Tier I. For many years, teachers have been mistakenly pushing students in the opposite direction, in an effort to get struggling and difficult-to-teach students referred for special education services. The result goes back to problem #1: an over-identification of students referred for special education services, which creates a bottleneck for special education services. Instruction Intervention Intervention • All students • Core instruction • Differentiated to meet diverse needs • Universal screening All Tier I instruction + • Skills focused • Targeted to student specific skill deficits • Progress monitoring every other week • 30 minutes intervention time All Tier II instruction + • Intensive to student specific skill deficits • Progress monitoring weekly • 45 minutes intervention timeBecomes more specific & intense GOAL = TIER I
- 13. PowerSchool.com | 13 This graphic from Shelby County Schools shows the intervention process the district uses to assess students for placement into Tiers II and III. Standards-Based Universal Screener (Reading, Math, Science) All Students Students not requiring additional skill-based testing Students identified by the District for possible skills-based deficit Skills-Based Baseline TIER I Provide Enrichment or Tutoring as needed. No further assessment required. Progress Monitoring 10th -24th percentile TIER II Interventions 1st -9th percentile TIER III Interventions Reading (K-8) Intervention Math (K-8) Intervention Secondary Coursework Intervention Teacher-Led Small Group Interventions Others to be determined
- 14. PowerSchool.com | 14 (Allain, 2013) (Harry and Klingner, 2006) 1 2 For districts relatively new to RtI, it can be helpful to understand the percentage of the student population expected to be in each tier. Knowing this information will also help determine if the universal screener is working appropriately for the student population. Fully implementing RtI takes approximately three years. With each year of implementation, the percentage of students in each tier will begin to look closer and closer to those indicated below in the relatively typical representation of the percentages in a district that has had an RtI model in place for at least three years. For districts newer to RtI, the percentage of students in Tier I would more likely be in the range of 55–70 percent. The catch here is that many schools—especially large, urban, high-poverty, and/or majority-minority school districts—have RtI percentages that, if calculated, would look more like an iceberg than a triangle.2 It is functionally impossible for these struggling districts to provide Tier II and Tier III services to 85–90 percent of their students; however, this difficult situation is not uncommon. The solution to the iceberg triangle is grounded in the essential element of RtI: Tier I core instruction in reading and math. Core instruction must evolve to address the needs of the students. Teachers need to be provided with top-quality, intense professional development that helps them to become experts in their field. The Triangle: Expected Percentages for Districts with a Highly Functional RtI Model1 The Iceberg (Inverted Triangle): Expected Percentages for Transitioning RtI Districts Grade-Level Instruction Strategic Intervention Intensive Intervention 3-5% 15% 80% 80% 15% 3-5% TIER I TIER I TIER II TIER II TIER III TIER III
- 15. PowerSchool.com | 15 School district staff should work closely with building staff to put together a comprehensive list of the existing interventions in use in each building. The list should include all of the following information for each research-based intervention: Below is an example of a simple tool used to collect interventions data. • The category (academic, attendance, behavior, social-emotional) • The area (English or mathematics) • The progress monitoring tool or probe used • The frequency of instruction • The duration of instruction as specified in the resources and materials Identifying Your Research-Based Interventions Resources and Materials Math Programs school/grade level ELA Programs school/grade level Science Programs school/grade level Social Studies Programs school/grade level
- 16. PowerSchool.com | 16 The district-comprehensive list of interventions will, in most cases, require pruning to eliminate redundancies and exclude interventions that are, for example, known to be ineffective, too difficult to monitor, require resources that are no longer available, or contain resources that are no longer aligned with standards. The What Works Clearinghouse has a section devoted entirely to interventions. This site provides analytics on the degree to which a specific intervention is likely to have a positive or negative impact on student performance. It could be fruitful to look up your existing interventions to see how they stack up among other similar interventions. Below is an example of the effectiveness of an intervention program called Check and Connect. U.S. Department of Education, Institute of Education Sciences, What Works Clearinghouse. Check & Connect. http://ies.ed.gov/ncee/wwc/interventionreport.aspx?sid=78. Accessed September 9, 2016.
- 17. PowerSchool.com | 17 (Fuchs and Fuchs, 2006) (Smith, 2014) 1 2 Assigning Interventions Discovering what works for individual students and groups of students struggling with specific skills takes time. It also takes money to purchase materials and resources that have been proven to improve student performance. Most experts agree that it costs a school district two or three times more to properly educate a student with disabilities than a student without.1 Districts and schools are likely to find new and promising resources and should use them to replace resources that do not get the expected results. The key is to continually evaluate all of your interventions using data collected by the teachers delivering them. Some districts assign interventions to students based on the interventions resources and materials available, but this is misguided. The RtI model and the federal regulations require that districts provide students with specific and targeted instruction based on the students’ learning needs2 —not based on what is in the teachers’ supply closet, book repository, district shared drive, or apps loaded onto the devices in the computer lab. Students should be assigned to interventions that will meet the specific and identified learning needs that were identified through a secondary screener (assessment). There should be clear and obvious links between the student’s skill gaps and the focus of the intervention instruction designed to remedy them. The main purpose for setting an intervention goal for each student is to let the teacher, school, and district—as well as the student and parent—know if the intervention was successful in remediating the knowledge or skill gap it was chosen to eliminate. As reknown educational psychologist Robert Mager aptly stated, “If you’re not sure where you’re going, you’re liable to end up someplace else. If you don’t know where you’re going, the best made maps won’t help you get there.”3 Four Characteristics of Good Goals: 1. Specific and measurable 2. Tied to the progress monitoring tool 3. Attainable during the assigned time period 4. Understandable to the student Setting Goals for Interventions (Mager, 1997)3
- 18. PowerSchool.com | 18 Federal regulations require that interventions must occur during the regular school day. Therefore, providing interventions before or after school, on Saturdays, or during school breaks is not appropriate. There are many ways to design a school schedule to incorporate intervention blocks. Below is an example of an elementary school’s RtI schedule informed by the work of Burns and Gibbons in 2008. When creating or modifying the intervention block in the school schedule, it is critically important to remember that Tier II and Tier III interventions are in addition to Tier I instruction. Students must remain in their classrooms and learning amid their peers during Tier I instruction. In other words, Tier II and Tier III are supplemental instructional services and must not replace high-quality Tier I teaching. Educators should pay attention to the prescribed time for Tier II interventions and remember that every intervention must be research-based. This research scientifically determined the desired amount of time students should spend on interventions, so educators should adhere to the research guidelines and recommendations as closely as possible. (This adherence is referred to in the RtI model as “fidelity of implementation.”) The more closely you follow guidelines for implementing the intervention, the more likely it is that students will show the expected performance gains. Establishing Time of Day for Interventions ‘Floating RTI’: Gradewide Shared Schedule. Each grade has a scheduled RtI time across classrooms. No two grades share the same RtI time. Advantages are that outside providers can move from grade to grade providing push-in or pull-out services and that students can be grouped by need across different teachers within the grade. Grade K 9:00-9:30 9:45-10:15 10:30-11:00 12:30-1:00 1:15-1:45 2:00-2:30 Grade 1 Grade 2 Grade 3 Grade 4 Grade 5
- 19. PowerSchool.com | 19 The appropriate and exact frequency and duration of an intervention are derived from an analysis of four factors: 1. Research-based intervention implementation guidelines 2. Time allocated in the schedule for interventions 3. RtI tier 4. Student needs The frequency and duration of interventions are directly tied to the intensity of intervention services. The level of intensity increases from Tier I to Tier II to Tier III. The graphic below is from a table summarizing the findings from a 2014 study by Harlacher, Sanford, and Walker (2014). Frequency and Duration of Interventions Organizational Factors Tier II Tier III Time allotted for instruction 30 minutes, 3-5 days/week 45-120 minutes, 5 days/week Instructional grouping 5-8 students 1-3 students Duration of intervention 8-15 weeks, <20 weeks 20+ weeks Interventionist facilitating group General education teacher, intervention specialist Intervention specialist, content specialist, special education teacher FACTOR TIERS OF INSTRUCTIONAL SUPPORT A summary of research-based factors that illustrates the differences between Tier II and Tier III.
- 20. PowerSchool.com | 20 (Shapiro, 2011)1 Determining Who Will Deliver Intervention Instruction Deciding who will be responsible for delivering or monitoring the instruction and tracking each student’s performance is all about allocating human resources. Some school leaders and intervention teams are better at doing this than others, so this is one area in which sharing best practices across schools in a district has huge returns. When assigning staff to interventions, it is important to keep in mind that Tier I instruction is of paramount importance. High-quality classroom instruction is the backbone of successful schools. Some districts schedule Tier I instruction (e.g., 90 minutes of reading and 90 minutes of math daily) in order to protect it. Administrators should avoid the mistake of shortening Tier I instruction to accommodate Tier II or Tier III small-group instruction. Many advocates of RtI say that “around 75-80 percent of children should, theoretically, be expected to reach successful levels of competency through Tier I delivery.”1 Similarly, schools should not “borrow” general education teachers to provide Tier II or Tier III instruction during their Tier I instruction. Instead, administrators should take a hard look at every adult in the building who could or would be an asset to the RtI model. For example, how could school specialists be utilized to deliver interventions? Here is a list of possible specialists who could serve well within the RtI model: • Title I reading and math specialists • Instructional coaches • Data coaches • Retired teacher volunteers • Teaching assistants • Student teachers • Assistant principals There are, of course, federal, state, and district guidelines that will inform decisions to use staff and volunteers to deliver interventions. Administrators should challenge themselves to be creative and innovative, and they should view the school schedule as an opportunity to maximize human resources to provide as many learning options as possible for all learners. Below is an example of a schedule of available staff for administering interventions: K & 1st Grade Classroom Teachers Support Persons Max # of Groups 9 13 11 1 Reading Specialist 1 Instructional Support Teacher 2 ESL Teachers 1 Reading Specialist 1 Instructional Support Teacher 2 ESL Teachers 1 Reading Specialist 1 Instructional Support Teacher 1 Special Education Teacher 1 Librarian 2 ESL Teachers 1 Special Education Teacher 1 Librarian 2nd & 3rd Grade 4th & 5th Grade ms. h mrs. b mrs. a mr. l mr. j mrs. gms. s mrs. d mr. f mrs. n ms. w mr. p mrs. v mr. q ms. r mr. m k teachers 1st grade 2nd grade 4th grade 5th grade 3rd grade EXAMPLE OF STAFF AVAILABILITY
- 21. PowerSchool.com | 21 (OECD, 2015)1 Monitoring Student Progress Before the advent of technology platforms designed to assess, monitor, and track student progress, the collection of student data was idiosyncratic at best and haphazard at worst. For example, some teachers kept plastic milk crates loaded with hanging file folders. These hanging folders were filled with manila folders that were stuffed with what was considered evidence of student learning as a result of intervention instruction. This evidence was shared with staff and parents through teacher notes or copies of formative assessments. Although this paper-centric method served its purpose, it left much to be desired, as it was extremely time intensive and tedious for teachers. A recent study by the Organization for Economic Development and Cooperation found that teachers around the world spend, on average, half of their working hours engaged in non-teaching tasks.1 By employing the many available technology platforms that perform these data collection and organizational functions, school leaders allow teachers to devote their time to working directly with students. Some schools have tried tasking a Title I specialist, data coach, or technology teacher with maintaining the documentation for all interventions in the building. However, that usually creates confusion rather than clarity on student progress. Ideally, every classroom teacher is involved in the RtI data collection process. In the end, though, districts and schools put their RtI programs at risk if they lack an efficient way to manage RtI data collection. An example of an interventions progress monitoring tool:
- 22. PowerSchool.com | 22 To determine if an intervention is having a positive impact on student performance, student progress must be periodically measured using valid and reliable assessments. These formative assessments are typically referred to, when used within the RtI model, as progress monitoring tools or probes. Several resources on progress monitoring tools can be found at the website for the Center on Response to Intervention. Data from these tools is used to inform the intervention teacher, the classroom/course teacher (if different), the school leader, and the parents of individual student progress. Districts or schools should decide how and how often intervention progress will be reported to parents. An example of a helpful visual showing student progress toward their intervention goal (red line). Each dot denotes a formative assessment or probe result.
- 23. PowerSchool.com | 23 (Anderson and Minke, 2007)1 Informing Parents of Student Progress Parents of struggling students are the best advocates for student success, but often these parents are frustrated and tempted to blame the schools for their child’s weaknesses. Unfortunately, some teachers are tempted to blame the parents for the child’s struggles. It is critical that both parents and teachers stop the “blame game,” focus on the facts, and work together to improve student progress. Educators must remember that parents want to do all that they can to get their child back on a path to success. Keeping parents in the loop and informed of their student’s progress (or lack thereof) creates a partnership between the school and parents whose sole focus is student success. Numerous studies have shown that parent involvement is correlated heavily with student achievement. Regardless of the parents’ educational or financial resources or even the parents’ self-efficacy as educational advocates, parents who are positively and actively involved in their children’s schooling are more likely to see their own children succeed.1 Several technology solutions are available that allow teachers to quickly and easily record dates of parent phone calls, emails, and written correspondence to ensure that parents are included in their child’s intervention plan.
- 24. PowerSchool.com | 24 (Nellis, 2012)1 Determining Intervention Efficacy Data teams are essential components of a successful RtI program.1 Why? The goal is not simply to look at test scores and track performance numbers, but to transform this statistical information into actionable RtI research practices. In order to accomplish this, team members must be confident and comfortable with the use of data in all its forms. Annually, schools spend a significant portion of their budget on intervention personnel and resources. Taking the time once or twice a year to conduct a comprehensive review of the school’s intervention program is essential to ensure that it is supporting struggling students in a financially responsible way. An analysis of intervention data can help a school identify areas for improvement, such as teacher training needs and problems with fidelity of implementation. The goal of the comprehensive interventions review is to continue programs that are effective and eliminate those that are not. Burns, et al. (2008) found that school data teams often do not reliably and consistently monitor student progress or evaluate the effectiveness of interventions, instead relying on intuition and instinct based on their professional experience. Schlechty (2009) cautions against this phenomenon, as it nullifies our attempts to innovate the culture of learning in our schools and create change. Checklist for Intervention Efficacy Analyze data from each intervention to determine the percentage or number of students who met the following criteria: FF Student met intervention goal FF Student showed progress toward intervention goal FF Student showed improvement on district benchmark assessments FF Student improved report card grade FF Student passed state summative assessment An example of an intervention efficacy report:
- 25. PowerSchool.com | 25 Resources Edutopia: http://www.edutopia.org/blog/what-matters-most-student-academic-intervention-rebecca-alber i-Ready: http://www.curriculumassociates.com/products/iready/diagnostic-instruction.aspx Frontline RTI: https://www.rtimdirect.com EdInsight RTI Software: http://www.onhandschools.com/products/response-intervention-software-rti-rtii- software PowerRTI: https://www.poweriep.com/products/powerrti/ Center on Response to Intervention: http://www.rti4success.org/resources RTI Classification Tool and Resource Locator: http://www.rtictrl.org National Center on Intensive Intervention: http://www.intensiveintervention.org/content/implementation- examples-field
- 26. PowerSchool.com | 26 References Allain, J. (2013, April 13). RtI Reality: Practical Application of Research (Part II). Sopris Learning. Anderson, K. & Minke, K. (2007). Parent Involvement in Education: Toward an Understanding of Parents’ Decision Making. Journal of Educational Research, 100(5), 311-323. Annie E. Casey Foundation. (2010). Early Warning! Why Reading at the End of Third Grade Matters. Balfanz, R. & Fox, J. (2011). Early Warning Systems: Foundational Research and Lessons from the Field. Presentation at the National Governors Association. Barton, P. (2004). Why Does the Gap Persist? Educational Leadership, 62(3). Burns, M. & Coolong-Chaffin, M. (2006). Response to Intervention: The Role of and Effect on School Psychology. School Psychology Forum: Research in Practice, 1(1), 3-15. Burns, M. K., Peters, R. & Noell, G. H. (2008). Using Performance Feedback to Enhance Implementation Fidelity of the Problem- Solving Team Process. Journal of School Psychology, 46(5), 537-550. Burns, M. K. & Gibbons, K. A. (2008). Implementing Response-to-Intervention in Elementary and Secondary Schools: Procedures to Ensure Scientific-Based Practices, Second Edition. New York, NY: Routledge. Coates, K. M. (1985). The Education for All Handicapped Children Act Since 1975. Marquette Law Review, 69(1). Dynarski, M., Clarke, L., Cobb, B., Finn, J., Rumberger, R. & Smink, J. (2008). Dropout Prevention: A Practice Guide (NCEE 2008- 4025). Washington, DC: National Center for Education Evaluation and Regional Assistance, Institute of Education Sciences, U.S. Department of Education. Fuchs, D. & Fuchs, L. S. (2006). Introduction to Response to Intervention: What, Why, and How Valid Is It? Reading Research Quarterly, 41: 93-99. doi:10.1598/RRQ.41.1.4. Harlacher, J. E., Sanford, A. K. & Nelson, N. J. (2014, May 15). Distinguishing Between Tier 2 and Tier 3 Instruction in Order to Support Implementation of RTI. RTI Action Network Monthly Newsletter. Harry, B. & Klingner, J. (2006). Why Are So Many Minorities in Special Education? Understanding Race and Disability in Schools. New York, NY: Teachers College Press. Hilt-Panahon, A. & Gischlar, K. L. Implementing RTI: Developing Effective Schedules at the Elementary Level. National Center on Response to Intervention. Keith, T. Z. (2002). Best Practices in Applied Research. In A. Thomas & J. Grimes (Eds.), Best Practices in School Psychology IV (91- 102). Bethesda, MD: National Association of School Psychologists. Mager, R. F. (1997). Preparing Instructional Objectives: A Critical Tool in the Development of Effective Instruction, Third Edition. Atlanta, GA: The Center for Effective Performance. Nellis, L. M. (2012). Maximizing the Effectiveness of Building Teams in Response to Intervention Implementation. Psychology in the Schools, 49(3), 245-256. doi:10.1002/pits.21594. Pharris-Ciurej, N., Hirschman, C. & Willhoft, J. (2012). The 9th Grade Shock and the High School Dropout Crisis. Social Science Research, 41(3), 709-730. Schlechty, P. (2009). Leading for Learning: How to Transform Schools into Learning Organizations. San Francisco, CA: Jossey-Bass. Searle, M. (2010). What Every School Leader Needs to Know About RTI. Alexandria, VA: ASCD. Shapiro, Edward. (2011). Tiered Instruction and Intervention in a Response-to-Intervention Model. RTI Action Network. Smith, K. C. (2014). Two Ethnographic Case Studies of Response to Intervention. PhD diss., University of Tennessee. U.S. Department of Education, Institute of Education Sciences, What Works Clearinghouse. Check & Connect. http://ies.ed.gov/ncee/wwc/interventionreport.aspx?sid=78. Accessed September 9, 2016. U.S. Department of Education, National Center for Education Statistics. (2016). Digest of Education Statistics, 2014 (NCES 2016– 006), Table 204.30.