Customer satisfaction and brand loyalty in the hotel industry
25716 1
1. Examining the effect of customer experience on service brand evaluation.
ABSTRACT
In the context of services, where perceived risk and uncertainty is often high, brands play a
particularly important role to consumers. However, in many cases, evaluation of the service
brand cannot be truly orchestrated until the consumer has had first-hand experience with the
brand. Therefore, the customer’s actual experience with the service firm becomes a key issue in
service brand evaluation as is clearly evidenced in Berry’s (2000) Service-Branding Model.
Using Berry’s (2000) framework as a foundation for the theoretical model of this study we
examine the effect of customer experience in service brand evaluation. Data collected from 268
self-report surveys reveals significant differences between the brand evaluations of consumers
who have experienced the service brand as opposed to consumers who have not had first-hand
experience with the service brand.
LITERATURE
Recognising the importance of brand development in services, given the difficulty of
differentiating products that lack physical presence and the intense competition within service
markets, Berry (2000) proposed a theoretical model that illustrates the service brand from the
consumer's standpoint. Given Berry’s (2000) argument that the customer’s experience with the
brand has primary impact on brand meaning (as opposed to the secondary impact of the
company’s presented brand and external brand communications) and that brand meaning then has
primary impact on brand equity (as opposed to the secondary impact of brand awareness), it
could be suggested that the customer’s experience with the brand is a key element of his model.
It is on this basis, that the issue of consumer experience within the realm of services branding
warrants further investigation and, in order to further explore this issue, the theoretical model of
this study is further discussed.
In essence, Berry's (2000) service-branding model is parsimonious in nature and depicts the
relationships between six key constructs, i.e., company's presented brand, external brand
communications, customer experiences, brand awareness, brand meaning and brand equity. In a
similar vein to that of Keller's (1998) Brand Knowledge Model, Berry (2000) advocates that
brand equity is influenced by both brand awareness and brand meaning (referred to as brand
image in Keller's (1998) model). According to Berry’s (2000) model the primary source of brand
awareness is the company’s presented brand, i.e., the company’s controlled communications
(Berry, 2000). In other words, it is the communications that purvey the identity and purpose of
the brand and its conceptualisation and dissemination is controlled within the service
organisation. Further, Berry (2000) argues that such communication can be conveyed via the
firm's advertising or promotional materials, service facilities, the appearance of their service
employees, the company's name and logo and symbolic associations. The next key construct in
Berry's (2000) model is that of external brand communications. This refers to the information
2. that consumers gather about the service brand from uncontrolled sources, i.e. word-of-mouth
communications and publicity. Due to the intangible nature of services, word-of-mouth
communications, in particular, are commonly used for information acquisition by consumers
(Berry, 2000). Perceived by consumers to be largely un-biased and experience-based, word-of-
mouth communications are often a major influence in the pre-purchase decision making stage,
especially when the consequences of the purchase decision are severe (e.g., choice of doctor,
lawyer, automobile mechanic, child care provider) (Berry, 2000).
Finally, Berry (2000) advocates that a customer’s experience with a service company is the
primary source of brand meaning. In fact, on examining Berry’s (2000) model it is evident that
customer experience is a key variable. This is so because the customer’s experience is shown to
have primary impact on brand meaning whereas the impact of company’s presented brand and
external brand communications on brand meaning is secondary. Furthermore, brand meaning is
shown to have primary impact on brand equity, over and above brand awareness whose impact is
secondary. Given that customer experience is purported to be a key component in service brand
evaluation, surprisingly the effect of customer experience has received little empirical attention to
date. It is on this basis that the significance of this research resides and the following research
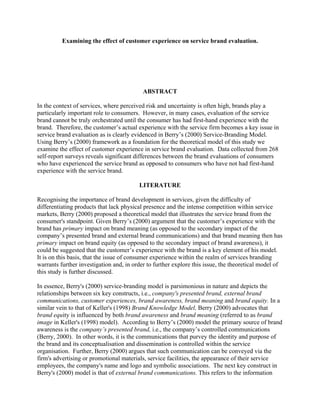
question is posed. To what extent do the paths within the theoretical model (Figure 1) differ for
consumers who have directly experienced the service brand as opposed to those consumers who
have not directly experienced the service brand.
Presented P3
Figure 1. Brand P2
Brand P1 Brand
Awareness Equity
P4
External Brand P5
Communications
RESEARCH DESIGN
The measurement instrument was a self-report survey that used existing scales to measure the
constructs of interest. For example, brand equity was measured via 4 items from Yoo and
Donthu’s (2001) overall brand equity (OBE) scale and brand awareness was measured via 2
items adopted from Mackay (2001). The company’s presented brand was measured using 4
items from Walker and Baker’s (2000) scale to measure tangibles and Holbrook and Batra’s scale
was adapted to measure advertising/promotions (similar to that also used by Grace, 2002). In
terms of external brand communications, word-of mouth was measured via 5 items originating
from Bansal and Voyer (2000) and used by Grace (2002) and adapted for this study. Similarly,
publicity was also measured using 5 items from Bansal and Voyer’s (2000) and Grace (2002) but
adapted in the context of publicity rather than word-of-mouth. Brand stimuli for the survey
consisted of nine well-known local and international hotel brands (eg., Holiday Inn, Marriott,
Sheraton, Conrad, Hyatt Regency, InterContinental, Hilton, Best Western and Ritz Carlton
Hotels). Although all questions in the survey were identical, one survey began by asking
respondents to select from the list (nine brands) a hotel brand they had used before, while the
other survey asked respondents to chose from the list a hotel brand that they had not used before.
1
3. Upon selecting their chosen brand, all respondents were then asked to use that hotel brand as a
frame of reference when responding to all of the survey questions. Data was collected via mall-
intercept in an inner capital city shopping mall in Australia. This location was chosen due to high
traffic flow and the close vicinity of the some of the major hotels listed in the survey. A total of
268 usable questionnaires were collected with approximately 50% (135) of respondents
completing the “experience with brand” survey, while 50% (133) completed the “no experience
with brand” survey.
RESULTS
Preliminary Analysis. The item-to-item correlations within each of the scales were then
inspected prior to the factor analysis and all correlations fell within an acceptable range of .30
and .90 (Tabachnick and Fidell, 1996), for factor analysis to proceed. Principal Components
factor analysis was conducted on each of the scales which produced uni-dimensionl factor
structures with eigenvalues greater than 1 and communalities greater than the recommended level
of 0.4 (Hair, Jr., et al., 1998; O’Leary-Kelly & Vokurka, 1998; Shi & Wright, 2001). Factor
loadings of items to individual scales were strong and ranged from .83 to .94. In addition,
variance explained for each of the scales was high and these ranged from 73% to 88%. Reliability
analysis was then conducted via Cronbach’s alpha and all scales exhibited good reliabilities
ranging from .86 to .94. Having determined that the items for each construct were valid and
reliable indicators of the scale, composite scores were then computed using a mean score
calculation.
Partial Least Squares (PLS) is used in the analysis of structural equation modelling and is a
multivariate technique that allows for the estimation and examination of paths between latent
variables that are measured via multiple indicators. The strength of this analysis lies it is ability
to cope with small sample sizes and the abatement of the hard assumptions of multivariate
normality (Bontis, 1998; Kroonenberg, 1990). The computer program, PLS-Graph, as developed
by Chin and Fry (2000) was used to evaluate the theoretical model thus enabling the hypotheses
of this study to be addressed. The evaluation of the model, as recommended by Fornell and Cha,
(1994), involves a systematic examination of multiple indices which include R2, average variance
accounted for (AVA), path coefficients and bootstrap critical ratios.
Results – “Experience” Model
Table 1. shows the path coefficients between the exogenous and endogenous variables for the
“Experience” model along with the R2 and critical ratios and the average variance accounted for
(AVA). The R2 values relating to the endogenous variables, brand equity and brand awareness
were .55 and .40 respectively which were greater than the recommended level of .10 (Falk &
Miller, 1992) and, as such, it is appropriate to examine the significance of the paths associated
with these variables. An inspection of the bootstrap critical ratios show paths P1, P2 and P4
exceed the criterion of greater than 1.96 (Chin, 1998 a,b) and the AVA is .48. Based on these
results, paths P1, P2 and P4 were significant and P3 and P5 are not significant.
Results – “No Experience” Model
Table 1 also shows the results for the “No experience” model. The R2 values relating to the
endogenous variables, brand equity and brand awareness were .38 and .17 respectively which
were greater than the recommended level of .10 (Falk & Miller, 1992) and, as such, it is
appropriate to examine the significance of the paths associated with these variables. An
inspection of the bootstrap critical ratios show all paths exceed the criterion of greater than 1.96
2
4. (Chin, 1998 a,b) and the AVA is .28. In summary, all paths within the “no experience” model
were significant and positive.
Table 1. Results of PLS Analysis
“Experience” Group “Non-Experience” Group
Path Coef. t-value Path Coef. t-value
P1 Brand Awareness to Brand .66 7.62* .37 4.79*
Equity
P2 Presented Brand to Brand .43 6.30* .22 2.15*
Awareness
P3 Presented Brand to Brand .10 1.38 .32 3.37*
Equity
P4 Ext. Brand Com. to Brand .36 5.20* .30 3.09*
Awareness
P5 Ext. Brand Com. to Brand .06 0.92 .16 1.99*
Equity
AVA .48 AVA .28
* Significant p< .01
Results - Comparison of Models (Experience vs No Experience)
In order to address the research question of this study, a comparative analysis of the results
pertaining to the “Experience” model and the “No Experience” Model was undertaken. To begin,
the significance of corresponding paths between the two models were visually inspected for
compatibility. While all paths were significant for the “no experience” model, paths P3 and P5
were not significant for the “experience” model. Initially, this indicates that the two models differ
on the basis of these two paths, however, to further test for differences in the models, an
examination of the differences in the strengths of the remaining paths was warranted. In order to
test for such differences, a procedure equivalent to a t-test procedure, as recommended by Chin
(2002), was undertaken. The results conducted via one-tailed t-tests revealed show that all paths
tested (P1, P2 and P4) were significantly different i.e. the t-values were greater than 1.64 (refer
Table 5). More specifically, the strength of the paths associated with P1, P2 and P4 were all
significantly higher for the “experience” group. On this basis, it appears that the models do differ
significantly in both significance and strength.
Table 2 Comparison of path coefficients via t-tests
Experience No Exper.
Path Path SE Path SE t value Result
P1 .66 .09 .37 .04 33.99 Significantly stronger “experience group”
P2 .43 .07 .22 .05 28.22 Significantly stronger “experience group”
P3 Not Sign. Significant Only significant “no-experience group”
P4 .36 .07 .30 .03 9.09 Significantly stronger “experience group”
P5 Not Sign. Significant Only significant “no-experience group”
DISCUSSION
3
5. However, on comparing the model across consumers who have directly experienced the brand
and those who have had no direct experience, the relationships between the brand dimensions
(eg. company’s presented brand and external brand communications) and brand awareness and
brand equity is somewhat different. For example, when consumers have not experienced the
brand, the brand dimensions show positive relationships with both brand awareness and brand
equity. This being the case, in the absence of experience, these brand dimensions do indeed play
an important role in establishing not only brand awareness but also brand equity. Therefore, the
tangibles and communications of the brand can influence the degree to which the consumer
positively or negatively evaluates the brand prior to usage and may, in fact, dictate whether the
customer chooses to experience the brand at all. Thus, at this point of the consumer/brand
relationship these brand dimensions need to be strategically designed to reinforce a strong
positive equity position thus enhancing the chances of brand experience occurring. However,
once the consumer has experienced the brand, these brand dimensions appear to take on a
secondary role whereby they are still instrumental in enhancing brand awareness but they no
longer have a direct influence on brand equity. The arguments of Krishnan (1996), Padgett and
Allen (1997), Berry (2000) and others are, therefore, substantiated by the findings here which
clearly indicate that, where service brands are concerned, experience overrides all brand
dimensions in the brand equity race. Furthermore, the findings would suggest that the evaluation
of service brands is based on different criteria at different times. For example, this study clearly
shows that consumers rely on the tangibles and communications of the service brand prior to
purchase and it is upon these dimensions that consumer-based brand equity may be formulated at
this stage. However, upon purchase (consumption) of the service brand, a new set of criteria
based on the direct experience with the brand (which can include many intangible elements such
as interpersonal interaction, noise, temperature, feelings etc) is used to evaluate the brand and,
thus, the pre-consumption brand equity position is no longer of relevance as the post-
consumption brand equity position takes precedence. Therefore, at separate points in time brand
evaluation may, in fact, change dramatically not because the brand has changed but because the
evaluative framework (criteria) of the consumer has changed.
LIMITATIONS
Firstly, as data collection was conducted at one shopping mall it could be suggested that
generalisability of the findings beyond this region may be problematic. However, the mall chosen
for data collection was made on the basis of high traffic flow and central location within a major
capital city, thus ensuring a good cross-section of respondents. Secondly, the brand stimuli used
in the surveys included only hotel brands and thus the generalisability of the findings may be
limited to this service type.
CONCLUSION
In conclusion, this study has enhanced our understanding of service brands from the consumer’s
standpoint. By utilising Berry’s (2000) framework of service branding as a basis upon which to
model and compare relationships, we have come closer to understanding how consumers interact
with service brands. The key focus of this paper has been centered on the effect of customer
experience in service brand evaluation and the results clearly confirm that this is an important
aspect of brand evaluation. As such, this should be a major consideration in the development and
maintenance of strong service brands.
4
6. REFERENCES
Berry, L.L., 2000. Cultivating service brand equity. Journal of the Academy of Marketing
Scienec. 28(1),128-137.
Bansal, H.S. and Voyer, P.A., 2000. Word-of-mouth processes within a services purchase
decision context. Journal of Service Research, 3(2), 166-177.
Bontis, N., 1998. Intellectual capital: An exploratory study that develops measures and models.
Management Decision, 36(2), 63-76.
Chin, W.M., 1998(a). Issues and opinion on structural equation modeling. MIS Quarterly, 22(1),
vii-xvi.
Chin, W.M., 1998(b). The Partial Least Squares approach for structural equation modeling. In
G.A. Marcoulides (Ed.). Modern Methods for Business Research. Laurence Erlbaum Associates,
295-336.
Chin, W.M., March 2002. Multigroup Analysis with PLS. [WWW document]. URL http://disc-
nt.cba.uh.edu/chin/plsfaq/multigroup.htm.
Chin, W.M. and Fry, T.A., 2000. PLS-Graph 3.0 Build 176. Department of Decision and
Information Science, University of Houston; Houston, Texas.
Falk, R.F. and Miller, N.B., 1992. A Primer for Soft Modeling. University of Akron Press;
Akron, Ohio.
Fornell, C. and Cha, J., 1994. Partial Least Squares. In R.P. Bagozzi (Ed.), Advanced Methods of
Marketing Research. Basil Blackwell Ltd: Oxford.
Grace, D., 2002. Exploring the dimensions of service brands: The Service Brand Verdict (SBV)
Model. Doctoral Dissertation. Griffith University: Gold Coast, Australia
Hair, J.F., Jr, Anderson, R.E., Tatham, R.L. and Black, W.C., 1998. Multivariate Data Analysis
5th Edition. Prentice Hall: Upper Saddle River, NJ.
Holbrook, M.B. and Batra, R., 1987. Assessing the role of emotions as mediators of consumer
responses to advertising. Journal of Consumer Research, 1 (December), 404-420.
Keller, K.L., 1998. Strategic Brand Management. Prentice Hall: New Jersey.
Kroonenberg, P.M., 1990. Review of Latent variable modeling with Partial Least Squares by Jan-
Bernd Lohmöller, Journal of the American Statistical Association, (September), pp. 909-910.
Krishnan, B., 1996. Characteristics of memory associations: A consumer-based brand equity
perspective. International Journal of Research in Marketing, 13, pp. 389-405.
Mackay, M.M., 2001. Application of brand equity measures in service markets. Journal of
Services Marketing, 15(3), 210-221.
O’Leary-Kelly, S.W. and Vokurka, R.J., 1998. The empirical assessment of construct validity,
Journal of Operations Management, 16, 387-405.
Padgett, D. and Allen, D., 1997. Communicating experiences: A narrative approach to creating
service brand image. Journal of Advertising, 26(4), 49-62.
Shi, X. and Wright, P.C., 2001. Developing and validating an international business negotiator’s
profile. Journal of Managerial Psychology, 16(5), 364-389.
Tabachnick, B. and Fidell, L.S., 1996. Using Multivariate Statistics 3rd Edition. Harper Collins
College Publishers: New York
Walker, J. and Baker, J., 2000. An exploratory study of a multi-expectations framework
of Services. Journal of Services Marketing, 14(5), 411
Yoo, B. and Donthu, N., 2001. Developing and validating a multidimensional consumer-
based brand equity scale. Journal of Business Research, 52(1), 1-14.
5