The Fail Trail: Analyzing the impact of a PR Crisis
•
3 gefällt mir•1,285 views

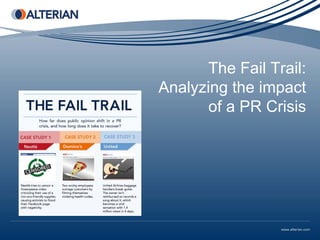
What happens to a brand’s reputation when they face a PR nightmare that plays out on social media? Alterian analyzed three case studies -Nestle, United Airlines and Dominos - to measure the effect a crisis has on a brand. How severe was the public’s reaction? How long did it take for the brand’s reputation to return to their pre-crisis average? How varied was the impact for each of these slightly different cases? Does the way a brand responds impact the severity of the crisis? Check out our analysis of what happens when a PR nightmare strikes.

Empfohlen
Empfohlen
Weitere ähnliche Inhalte
Andere mochten auch
Andere mochten auch (20)
Ähnlich wie The Fail Trail: Analyzing the impact of a PR Crisis
Ähnlich wie The Fail Trail: Analyzing the impact of a PR Crisis (20)
Mehr von Alterian
Mehr von Alterian (20)
Kürzlich hochgeladen
Kürzlich hochgeladen (20)
The Fail Trail: Analyzing the impact of a PR Crisis
- 1. The Fail Trail: Analyzing the impact of a PR Crisis
- 2. Introduction Crisis Management Theory – Proactive Reputation Monitoring • Looking to understand the significance of, and if actively listening can decrease the severity of a crisis – Proactive Reputation Management • Understanding if a brands initial reputation can decrease severity of crisis – Proactive Reputation Response • Determining if a follow-up response and action affects the opinion of the brand during a crisis • Search Setup • Identified three global brands • Historical data over 6 month period • Each a different example of a crisis • All well known PR disasters
- 3. Domino’s • Example of crisis: Employees “Caught in Act” • Employees post video on YouTube of health violations. • Domino’s responded with apology video and legal actions against employees. • We set up historical social search to go back and look at data from 1/16/2009 to 7/16/2009. That is 3 months prior to the crisis and 3 months following.
- 4. United • Example of crisis: “Bad Customer Service” • United breaks Passengers guitar and doesn’t pay for it. • Musician’s song about it goes viral. • We went back and looked at conversations from 4/06/2009 to 10/06/2009.
- 5. Nestle • Example of crisis: “Brand Hijacking” • Nestle tries to censor campaign against them regarding deforestation. • Facebook page gets taken over with negative posts. • We went back and looked at conversations from 4/06/2009 to 10/06/2009.
- 6. Overall Analysis Average Net Positive Pre-Crisis Net Positive Sentiment Dominos PC United PC Nestle PC Dominos United Nestle Average Average Average 7.56% 6.93% 24.89% 10.94% 0.00% 14.57% 9.99% 1.69% 19.49% 13.37% -4.07% 18.42% 5.64% -0.97% 17.14% 17.29% 1.07% 12.63% 3.28% 4.44% 18.85% 13.27% 4.80% 19.75% -0.28% 4.61% 17.77% 12.30% 2.03% 26.43% 13.02% -0.75% 20.51% 10.08% 2.73% 18.60% 13.43% -0.57% 24.34% -16.72% -9.02% 21.51% -6.80% -9.78% -11.24% 10.00% -5.54% 1.78% 2.87% -11.51% 13.01% 7.78% -7.88% 18.72% 12.24% 1.16% 11.97% • Net positive sentiment percentage is defined as the percentage of positive 12.80% 4.09% 20.60% conversations minus the percentage of negative conversations. 17.70% -5.91% 19.92% 17.28% 0.00% 22.04% • Prior to the crisis, Nestle had the greater average percentage of overall positive 11.61% 0.79% 15.47% 8.87% 1.02% 15.25% conversations while United had the fewest. 11.55% 1.44% 16.27% 16.29% 52.39% 21.66% • Each crisis happened at week 13 and took four to six weeks to return to the pre- 18.10% 7.54% 18.38% crisis average.
- 7. Domino’s Analysis Dominos Dominios Average DFA 9.99% -2.43% 9.99% 0.95% 9.99% 3.38% 9.99% -4.35% 9.99% 7.30% 9.99% -6.71% 9.99% 3.28% 9.99% -10.27% 9.99% 2.31% 9.99% 3.03% 9.99% 0.09% 9.99% 3.44% -0.58% -26.71% -0.58% -16.79% -0.58% 0.01% -0.58% -7.12% -0.58% -2.21% • There was a large spike in the distance from average when the crisis 14.05% 2.25% immediately occurred. 14.05% 2.81% 14.05% 7.71% 14.05% 7.29% • Post-crisis, Domino’s average positive sentiment actually increased from 14.05% 1.62% 9.99% (prior to the crisis) to 14.05%. This could be attributed to what experts 14.05% -1.12% called immediate response to the crisis and the video apology they issued. 14.05% 1.56% 14.05% 6.30% 14.05% 8.11%
- 8. United Analysis United United Average DFA 1.69% 5.24% 1.69% -1.69% 1.69% -5.76% 1.69% -2.66% 1.69% -0.62% 1.69% 2.75% 1.69% 3.11% 1.69% 2.92% 1.69% 0.34% 1.69% -2.44% 1.69% 1.04% 1.69% -2.26% -7.38% -10.71% -7.38% -11.47% -7.38% -7.23% -7.38% -13.20% • The plunge in sentiment when the crisis occurred wasn’t as drastic as the -7.38% -9.57% other brands. This could be due to the already low sentiment surrounding the -7.38% -0.53% 6.95% 2.40% United Brand. 6.95% -7.60% 6.95% -1.69% • Following the crisis the average positive sentiment was actually greater than 6.95% -0.90% it was prior as well. This is due to the giant spike in conversations towards 6.95% -0.67% 6.95% -0.25% the end of our 6 month search range, around a Starbuck gift card giveaway 6.95% 50.70% on all domestic flights on United. 6.95% 5.85%
- 9. Nestle Analysis 30.00% Nestle Nestle Average DFA 25.00% 19.49% 5.40% 19.49% -4.92% 20.00% 19.49% -1.07% 15.00% 19.49% -2.35% Nestle 19.49% -6.86% 10.00% 19.49% -0.64% Nestle PC Average 19.49% 0.26% 5.00% 4 per. Mov. Avg. (Nestle) 19.49% -1.72% 0.00% 19.49% 6.94% 19.49% 1.02% ‐5.00% 19.49% -0.89% 19.49% 4.85% ‐10.00% 9.29% 2.02% ‐15.00% 9.29% -30.73% 9.29% -17.71% 9.29% -6.48% 9.29% -0.77% • Nestle had the greatest drop in positive sentiment from the average at the 9.29% -7.52% time of the crisis. Fittingly, Nestle also had the highest overall positive 17.95% 1.11% sentiment and thus the “furthest to fall.” 17.95% 0.43% 17.95% 2.55% 17.95% -4.02% • After the crisis Nestle’s brand returned to nearly the same average as it was 17.95% -4.24% prior to the crisis. The difference could be attributed to the lasting affect that 17.95% -3.22% 17.95% 2.17% the crisis had on some brand supporters. 17.95% -1.11%
- 10. Domino’s vs. Nestle Analysis • Nestle and Domino’s are very similar in their sentiment pattern. • Possible reasons could be that they are both in the food industry and have a positive average sentiment prior to the crisis. • United has a more stable, but lower sentiment percentage, thus the percentage doesn’t move as much when a crisis occurs.
- 11. Insights • Monitoring – If a brand is monitoring the conversations surrounding sentiment, they may be more likely to take action on a crisis in a positive manner by learning from experiences. – An example is United defending their customer service and increasing positive sentiment by issuing Starbucks gift cards on flights. • Management – It seems as though a brand’s initial reputation and average sentiment does have an effect on the crisis, but in an inverted fashion. – Both Nestle and United had a greater positive sentiment and dropped further. United, on the other hand, didn’t drop as much during the crisis because people expected this from the brand. • Response – Initial response is not necessarily a good thing, and interaction can influence an audience’s perception of the brand. – An example is Nestle and how they attempted to defuse a growing social situation by censoring content and going back and forth with commenters on their Facebook page. This is not an ideal way to respond to a crisis.
- 12. Future Analysis Areas for Future Investigation: – Does the brand’s industry affect the impact of the crisis (similar patterns with Domino's and Nestle)? – Does the public’s sentiment about a brand *before* a crisis affect the negative impact of a PR Crisis? – Can a brand’s response lessen the long term impact of a PR Crisis?
- 13. THANK YOU! Please contact us with any questions Steve True: steve.true@alterian.com @steventrue UK/EU: +44 (0) 117 970 3200 | US: +1 312 704 1700 | Asia/Pac: +61 (2) 9968 2449 Web: www.alterian.com | Blog: www.engagingtimes.com | Twitter: @Alterian Slideshare: Alterian | YouTube: engagingtimeslive | Facebook: The Real Alterian
- 14. info@alterian.com www.alterian.com www.EngagingTimes.com Stay Connected… www.youtube.com/user/EngagingTimesLive @Alterian www.slideshare.net/Alterian LinkedIn Groups: Alterian www.facebook.com/AlterianFB