
Empfohlen
Weitere ähnliche Inhalte
Was ist angesagt?
Was ist angesagt? (20)
Ähnlich wie Technology R&D Theme 2: From Descriptive to Predictive Networks
Ähnlich wie Technology R&D Theme 2: From Descriptive to Predictive Networks (20)
Mehr von Alexander Pico
Mehr von Alexander Pico (17)
Kürzlich hochgeladen
Kürzlich hochgeladen (20)
Technology R&D Theme 2: From Descriptive to Predictive Networks
- 1. TRD 2: PREDICTIVE NETWORKS – PROJECT SUMMARY A major promise of genomics is to enable precision medicine, through use of a patient's genome and physiological state to improve treatment efficacy and outcome. Routine use of genomics data in clinical research still faces major barriers, however, including some very important challenges posed by ‘Big Data’. First, modern genomic datasets are typically so large and complex that most biomedical researchers or clinicians have neither the computational infrastructure nor data mining expertise to cope with them. Handling even a few hundred patients requires the ability to store, access, process, and analyze petabytes (1012 bytes) of genomic data. Second, although mainstream computer scientists and information technology companies are becoming very astute at data mining, understanding big biomedical data is likely to require a depth of understanding in physiology, biotechnology, and cellular and molecular mechanism that mainstream data analysts simply do not have. Rather, encouraging preliminary results from the NRNB and several other groups indicate that an effective way to address the challenge of Big Biomedical Data is to integrate and interpret these big data sets against appropriate representations of biological, physiological, and clinical knowledge. Biological network models at multiple scales are increasingly recognized as a natural way to represent and visualize knowledge about biological mechanisms and relationships. While the field of Network Biology has focused mostly on descriptive models of network structure, there is increasing evidence that network knowledge can also be used to guide biological and clinical predictions. In some cases, these network-guided approaches have yielded predictions of higher accuracy and / or robustness with less input or training data than traditional ‘black-box’ machine learning methods. In this TRD project, we will pursue novel methodology for using biological network information to predict the outcome of therapy in a given patient, to identify which networks and pathways are affected by mutations conferring risk of a disease, and to predict drug response and identify novel drug targets. The major deliverable is a bioinformatic framework to integrate patient molecular and clinical data with biological network information, with the goal of making clinically-relevant diagnoses and predictions about an individual based on their genomic information.
- 2. TRD 2: PREDICTIVE NETWORKS – PROJECT NARRATIVE Analysis of personalized human genomic data promises major medical advances. However, the routine use of genomics data in medical research is in its infancy, due mainly to the challenges of working with highly complex ‘Big Data’. Use of biological networks promises to help organize, analyze and integrate these data into models that can be used to make clinically relevant diagnoses and predictions about an individual.
- 3. TRD 2: PREDICTIVE NETWORKS – SPECIFIC AIMS Network Biology has traditionally focused on defining descriptive models of biological systems, for instance mapping all known protein-protein interactions for an organism. These networks have been very useful for identifying modular structures and for improving our understanding of gene function. As network models become more complete and detailed, and as genomics continues to accumulate mountains of data relevant to human physiology and disease, we are poised to transition Network Biology from a descriptive discipline towards a paradigm based largely on predictive outcomes. Through the Specific Aims of this TRD, we explore and further develop two fundamental and complementary means by which networks can impact predictions of patient status, based on networks of patient similarities (Aim 1) and networks of molecular interactions (Aim 2), respectively. We also invest in efforts to make these and other methods generally accessible, through software infrastructure for processing and analyzing genetic variants using networks (Aim 3). By embedding the available collection of network knowledge in routine analysis of patient data, we will seek to enable medically-relevant prognosis and prediction tasks such as which cancer subtype a patient belongs to, whether their tumor will metastasize or not, and what drug should be chosen to treat them. Aim 1: Develop patient similarity networks as a major resource for predicting clinical outcome. We will develop patient similarity networks as a major platform for predicting patient outcome (e.g., breast cancer risk, response to therapy). Using patient similarity networks, we will first develop supervised methods to predict patient outcome using and, second, we will pursue unsupervised analysis to stratify patient populations into more homogeneous groups with better correlation to outcome. We will also develop technology to visually superimpose a patient’s genomic profiles on these patient networks, highlighting features that are informative for patient classification and outcome prediction, while simultaneously relating patient history and treatment response from other patients with meaningfully similar profiles. Aim 2: Supervised learning of patient response using multi-modal data integration on molecular networks. As exemplified by The Cancer Genome Atlas, many large patient ‘omics projects are now underway that span not just one but many layers of information, including genomes and single nucleotide variants, copy number changes, genome rearrangements, epigenetic changes, and RNA and protein abundances and modifications. Effective use of such multimodal datasets remains an important challenge that may benefit significantly from the use of network-encoded prior knowledge. We will address this challenge by extending existing methodology to operate in this regime, leveraging gene and protein networks in multiple ways. First, networks will be used as a means of extracting/generating robust network features. Second, we will extend regularization methods to consider directional or weighted networks (e.g. that capture stimulatory versus inhibitory interactions). Third, we will use networks to detect changes in correlation structure across data layers. This aim strongly leverages databases (e.g. GeneMANIA, cBioPortal) and methods (Network-Based Stratification) previously developed by NRNB personnel. Aim 3: Develop Cytoscape Apps for accessible network analysis of genetic variant data. We will develop software tools for accessing, modeling and annotating variant data, and for performing network analysis of the processed variants. Focusing on approaches that best leverage NRNB expertise and serve our DBPs, we will implement the following analytical methods as Cytoscape Apps: 1) Pathway analysis of Genome-Wide Association Studies (GWAS); 2) Network-Based Stratification (NBS); and 3) Detection of Mutual Exclusivity Modules in Cancer (MEMo). We will build the data structures and services needed to support variant data analysis in Cytoscape, including user data modeling, dynamic mapping and annotation services. This work will streamline access, annotation and analytics for variant data in the context of networks. The goal is to put these tools in the hands of diverse researchers and thereby enable broad exploratory and confirmatory analysis.
- 4. TRD 2: PREDICTIVE NETWORKS – RESEARCH STRATEGY Overview. Advances in genomics are allowing for an ever-finer resolution mapping of complex cellular state, holding great promise for major medical advances. In particular, genomics is enabling precision medicine, the use of a patient’s genomic, cellular, and physiological state to improve therapeutic efficacy and outcome1 . For instance, DNA sequencing technology has quadrupled the rate of identification of rare disease-causing genes in the past two years2 which enables earlier and more accurate diagnosis. In a second illustrative example, a pediatric neurologist, over the span of a mere two years, used genomics to discover the causative mutation of a rare brain disease, affecting multiple children in the same family, and based on this mutation found an existing drug to effectively treat the patients3 . The big data problem. While compelling anecdotes of precision medicine abound, the systematic use of genomics data in medical research still faces major barriers, including some very important challenges posed by ‘Big Data’. Collectively, these data are heterogeneous, requiring an understanding of many aspects of experimental biology and medicine to correctly process and interpret; noisy, both with systematic artifacts that must be removed and with random noise requiring statistical validation of results; and complex with non-linear signal patterns and interrelationships that must be considered to maximize the signal-to-noise ratio. As an example of heterogeneity, a modern ‘omics dataset might include data on whole genome/exome sequences, gene transcript and protein expression, splicing, chromatin structure, molecular interaction, transcription factor, methylation and metabolite profiles as well as rich patient phenotypes (e.g. imaging, biopsy, blood tests). Data size is also an issue, as individual researchers may need to handle petabytes of information (e.g. whole genome data from a few hundred patients), which is challenging to store and analyze locally and prohibitive to transmit using standard internet protocols. These challenges, coupled with the observation that sequencing capacity outgrows ‘Moore’s law’, implies that advances in computing will not resolve these challenges in the foreseeable future. Inevitably as sequencing cost is reduced, most people who see a doctor will likely have their germ-line and somatic genomes sequenced, perhaps starting at birth4 . Thus, a fundamental challenge facing the field of genomics is to organize, analyze and integrate these data into models that can be used to make clinically relevant diagnoses and predictions about an individual, while maintaining patients’ rights to privacy and confidentiality. Towards this challenge, encouraging preliminary results from NRNB and several other groups indicate that an effective way to address the challenge of Big Biomedical Data is to integrate and interpret these big data sets against appropriate representations of biological, physiological, and clinical knowledge5,6 . Using networks to make clinically important predictions. Network models at multiple scales are increasingly recognized as a natural way to integrate patient clinical and molecular data, as well as prior knowledge about patient and molecule relationships, in a common framework for use in sub- categorizing disease, diagnosis, prognosis and drug target prediction. A number of examples have shown that using a network-based approach is more accurate and functions well with smaller amounts of input or training data compared to traditional approaches. For instance, we and others have previously advanced the concept of ‘network biomarkers’, connected subnetworks of gene and protein interactions whose genes show genetic variation or differential expression that can explain and predict phenotypes or clinical outcomes7-17 . Such network biomarkers are often more robust readouts than individual genes or proteins, and networks derived from prior knowledge of molecular mechanism and pathways are more biologically meaningful than arbitrary sets of genes. In a complementary example, the recently developed Similarity Network Fusion (SNF) method18 integrates diverse genomic and clinical data using a very different type of network – patient-patient similarity networks. It shows that patient similarity networks can identify clinically-relevant patient subtypes with impressive survival prediction across five different cancer types. In this project, we will explore the use of network information of both types (patient similarity and
- 5. molecular networks) to improve the accuracy with which we can predict the outcome of therapy in a given patient, identify which networks and pathways are affected by mutations conferring risk of a disease, as well as predict drug response and identify novel drug targets. We acknowledge that clinical use of the computational methods we develop has many requirements that will not likely be met during the course of this grant19 . However, our activities will nonetheless progress significantly towards this goal and have immediate benefits for medical research, as we will work with leading clinician-scientist collaborators within Driving Biomedical Projects. We will also investigate application of our methods in collaboration with James Fowler to use social network information to predict behavioral and disease outcomes and to guide selection of novel intervention mechanisms, i.e. which individuals should be targeted for weight loss or smoking cessation. 2.1 DEVELOP PATIENT SIMILARITY NETWORKS AS A MAJOR RESOURCE FOR PREDICTING CLINICAL OUTCOME Project Leader: Gary Bader (University of Toronto) Overview. In this project, we will develop patient similarity networks as a major platform for predicting patient outcomes such as breast cancer risk or response to therapy. Recently, work has shown that analyzing patient networks, wherein nodes represent patients and edges some measure of patient similarity, is useful for identifying predictive patient subgroups18 . Using patient similarity networks, we will first develop supervised methods to predict patient outcome using and, second, we will pursue unsupervised analysis to stratify patient populations into more homogeneous groups with better correlation to outcome (a well tested phenomenon in multiple disease areas like cancer20 ). We will also develop technology to visually superimpose a patient’s genomic profiles on these patient networks, highlighting features that are informative for patient classification and outcome prediction, while simultaneously relating patient history and treatment response from other patients with meaningfully similar profiles. In our preliminary work to predict the response to methotrexate therapy in rheumatoid arthritis patients with collaborators at Sage (DBP) and Dr. Kathy Siminovitch (CSP), we have found that this type of approach increases prediction accuracy. The new technology developed in this TRD will be applied to clinical data sets made available as community challenges by SAGE/DREAM and studied by our collaborators (e.g. rheumatoid arthritis and breast cancer risk). Background and Significance. Subdividing patients into subgroups homogeneous with respect to biology, disease progression and response to treatment enables “precision medicine”. Although it is a new term, precision medicine is simply traditional medicine that considers more detailed patient data. In the next few years, these new data will include much more detailed patient genotypes, such as whole genome sequences, and phenotypes, such as concentrations of thousands of molecules (RNA, proteins, metabolites) in blood and other bodily fluids. Historically, improvements in the depth of patient data have led to a substantial improvement in patient care – before autism spectrum disorder was defined in 1971 based on improved phenotyping, it was considered the same disease as schizophrenia21 – and new large-scale phenotype data are already leading to more precise care: breast cancer is now treated by subtype (e.g. ER+, HER2+, triple negative) using targeted drugs that outperform the older one-size-fits-all therapies22 . Recent precision medicine successes have required computational methodology to analyze large data sets. Generalizing to even more detailed data and diseases not yet studied using genomics will require substantial, concerted, and expert effort in algorithm development to automatically organize the genotype-phenotype landscape6 and relate the results to patient outcomes. Motivating Collaborations. The following three DBP / CSP projects provide ample motivation for pursuing this technology development: Rheumatoid arthritis treatment prediction (Sage Bionetworks DBP, Siminovitch CSP). Rheumatoid arthritis is a common immune disorder that often causes painful swelling in joints. An important challenge in RA treatment is choosing effective therapy. The current standard approach
- 6. (methotrexate) yields no or poor response in ~35% of cases, at which point alternate therapy (e.g. anti-TNF) is prescribed, which are effective in ~60% of these cases. Pharmacogenetic research implicates genetic polymorphisms in treatment response23 . The challenge is to predict which treatment will be effective based on genomic and clinical information collected upon initial presentation to the clinic (Task 1 below). Sage Bionetworks ran a public challenge in this area to crowd-source solutions (https://www.synapse.org/#!Synapse:syn1734172). The input is SNP and WES mutations and clinical data; the output will be prediction of response to methotrexate or anti-TNF therapy. We are also collaborating with Kathy Siminovitch, MD, at Mount Sinai Hospital in Toronto who has SNP genotype data on ~1000 RA cases and 500 controls with measured methotrexate response. Pediatric brain cancer outcome prediction (ICGC DBP, Goldenberg CSP). Michael Taylor, MD, PhD, at The Hospital for Sick Children in Toronto, is leading a study of pediatric medulloblastoma (a rare and serious brain tumor) as part of the International Cancer Genomics Consortium (ICGC) led by Tom Hudson (DBP collaborator). The Taylor lab has collected WES, SNP chips, DNA methyl chips, miRNA-Seq and RNA-Seq for >1000 samples and WGS for 300 samples. A major challenge is to molecularly dissect medulloblastoma to identify subtype-specific diagnostic and therapeutic targets20 . Already, four subtypes with distinct outcomes have been defined based on gene expression data and these will likely lead to improved treatment protocols for patients. For instance, the WNT signaling enriched subtype has a substantially better prognosis than other subtypes, thus it may be possible to reduce brain damaging radiation and chemotherapeutic treatment in these individuals. The Taylor lab has developed a gene expression-based signature aimed at the clinic to subtype tumors. Recent evidence has shown that other genomics data, such as DNA methylation, may be more accurate at subtype classification. It is hypothesized that using all available genomic data will lead to the best achievable classifier. In collaboration with SNF developer Anna Goldenberg (CSP), we will develop the SNF Cytoscape app to analyze this genomic data to improve accuracy of medulloblastoma subtyping, as defined by survival outcome (Task 2 below). Breast cancer genetic risk prediction (Simard CSP). Breast cancer is the most common cancer in women in the US and over 40,000 people die per year from the disease. The lifetime risk of developing breast cancer in women is over 10%. There is wide variation in breast cancer susceptibility, due to genetic and other identifiable factors. Mammographic surveillance of all women aged 50-74 is recommended, but early detection and prevention of breast cancer can be improved by stratification of women according to risk, targeting of screening on the basis of risk and use of additional preventative strategies (e.g. MRI screening) for higher risk women. At present, only a third of the overall genetic variation in breast cancer risk is accounted for, the identification of the missing inherited susceptibility is a critical step to improve the predictive power of risk models. Our collaborator Jacques Simard (University of Laval, Quebec City) is leading a multi-investigator $10M project to genotype 78,000 breast cancer patients and 200,000 controls on a 530k custom single nucleotide polymorphism chip as part of the NIH NCI funded OncoArray Consortium and the international Breast Cancer Association Consortium. Our role in the project is to use network and pathway information to help interpret SNPs associated with breast cancer and to help predict breast cancer risk from genotype (Task 1 below). Preliminary Results and Progress Report. The use of patient similarity networks, especially those that consider multiple types of genomic, phenotype and clinical data is very recent. In fact, we are aware of only a few papers on the subject18,24 . However, we have been actively working in this area and have developed an initial version of our GeneMANIA based predictive patient similarity network method (Task 1 below). Preliminary results using this tool for the Siminovitch rheumatoid arthritis data set described above show that we can predict good and poor methotrexate response from genotypes and clinical data. Genes and pathways relating to immunological function and metabolism of methotrexate were most informative in our model and enabled us reach up to 90% accuracy. Methods. Our aim is to develop methods for using patient similarity networks to improve prediction accuracy of clinical outcome in a range of disease areas. We have factored this aim into three tasks:
- 7. 1. Predict outcome (e.g. breast cancer risk, response to therapy) based on supervised machine learning analysis of patient similarity information based on genotype, phenotype and clinical information. Patients that are similar in certain, potentially hidden features will be more likely to be similar in their outcome. Machine learning methods will be designed to identify the informative features and use them for prediction. This task is useful to answer directed clinical questions, such as “Will a patient respond to treatment or not?” 2. Develop methods for unsupervised clustering of patient networks to stratify patient populations, based on molecular network and pathway features. It is expected that patient clusters that are more homogeneous will better predict clinical features, such as disease outcome or survival. This task is useful for exploratory analysis of new large and diverse data sets to identify possible subgroups. 3. Develop patient similarity network visualization technology, simultaneously showing both patients and informative features for patient classification and outcome prediction. This task supports interpretation of the results of the first two tasks and will be useful to communicate the results to non-specialists in computational biology, such as clinical collaborators. Task 1: Predict outcome based on supervised machine learning analysis of patient similarity information. We will develop a novel decision support system for precision medicine, implemented using powerful computational and statistical analysis methods we previously developed, which will enable clinician-researchers to mine large amounts of clinical and genomic data to identify patterns that are predictive of outcome. We will define “patient phenotype similarity” based on all patient genetic variants and any associated clinical and molecular data. To enable clinical decision support, we will adapt a machine learning method previously developed for the GeneMANIA gene function prediction system we created and implemented in Cytoscape25,26 . Instead of working with genes and their functional similarities, the system will work with patients and their clinical-genomic similarities. The system will identify types of similarities among patients (e.g. gene variants) that uniquely define their subgroup, such as ‘treatment responders’. It will then use these features to predict additional patients likely to be in that subgroup (scored using label propagation27,28 ). Clinical and genomic data will be converted to patient similarity networks, in which nodes represent patients and links (or edges) represent patient similarities. Each clinical or genomic variable under study, or dimensionality reduced versions, or relevant combinations, will be used to create a separate network or feature, such that each represents similarity in a particular aspect such as age, smoking status or genotype (possibly broken down into common, disease-associated, or rare variants). We will also explore ontology, clinical database and electronic medical record-based similarity measures as available. For instance, we will use the Human Phenotype Ontology29 to formally describe clinical symptoms and compute patient phenotypic similarities30 . Our approach has numerous advantages: it is fast; has built in redundancy reduction (regularization) to simplify input data and reduce chances for over-fitting; handles missing data (omits a given edge between patients); and has an intuitive representation of the data used to make a prediction, mirroring the process of diagnosis by similarity to historical cases that many clinicians implicitly use. Exposing a human readable representation of the data is likely to be far more interpretable by clinician users than black box machine learning approaches. The major work involved will be to define and optimize patient similarity measures and indices, to evaluate the system on multiple DBP data sets, and explore feature-combining functions, to see if modeling non-linear interactions improves performance. We will also explore ways to integrate pathway information and the millions of functional gene-gene interactions from GeneMANIA to improve sensitivity for patient data that may not be very informative alone, but would become so when they are combined based on prior information (e.g. mutations within the same pathway or in genes co-expressed in disease-relevant tissues). We will accomplish this by relating patients based on affected pathways and gene interaction neighborhoods, and modifying the label propagation algorithm to boost patient similarity based on prior data. This may require implementation of newer, but established methods31 to speed prediction calculations. The
- 8. system’s user interface will present evidence supporting its recommendation, illustrating how a new patient is similar to previous patients, alongside relevant outcome data (see Task 3 below). Task 2: Unsupervised clustering of patient networks to stratify patient populations, based on molecular network and pathway features. As mentioned above, the recently developed Similarity Network Fusion (SNF) method integrates diverse genomic and clinical data using patient similarity networks and identifies clinically relevant patient subtypes with better survival prediction than other widely used methods18 . Briefly, SNF uses network diffusion theory to combine diverse patient networks into a single network that reflects patterns across all of the integrated data types and then clusters the results to obtain patient subtypes. SNF is robust to various kinds of noise and is powerful even on small sample sizes (e.g. less than 100 patients). We will work with SNF developer Anna Goldenberg (CSP) to implement it as a Cytoscape App and apply it to pediatric medulloblastoma data from Michael Taylor’s lab (DBP). Task 3. Develop visualization methods for patient similarity networks, simultaneously showing both patients and informative features for patient classification and prediction. Patient similarity networks draw from patient similarity in clinical data (e.g. age, smoking status), molecular profile (e.g. similar gene expression profile), genetic (e.g. similar SNPs), or cellular systems information (e.g. similar molecular network or pathway alterations). These networks are naturally visualized in Cytoscape using standard file formats and visualization options. However, to interpret the results of the predictive and classification networks in Tasks 1 and 2, it is important to understand which of many patient similarity features are most informative for prediction and classification performance. The machine learning methods of Task 1 involve feature selection, which will identify which patient network types and which aspects of those networks (e.g. which genes in a gene expression profile) contribute most to the prediction performance. We will develop a visualization method in Cytoscape to show these informative features in the context of patient networks. Each patient node will be graphically represented as a chart showing the informative features associated with that patient. For instance, instead of showing a 20,000 long gene expression vector for each patient, we will show a vector including a few top genes that contribute most to the correlation. Similarly, for pathway correlation vectors, we will show the genes that contribute most to performance. We will coordinate work with multi-scale modeling and visualization technology development in TRD3 to share and re-use technology as needed. 2.2 SUPERVISED LEARNING OF PATIENT RESPONSE USING MULTI-MODAL DATA INTEGRATION ON MOLECULAR NETWORKS Project Leader: Trey Ideker (UCSD) Overview. Many large patient ‘omics projects are underway that span not just one but many layers of information. Effective use of such multimodal datasets remains an important challenge that may benefit significantly from the use of network-encoded prior knowledge. We will explore this idea by extending existing methodology for regression and classification to leverage gene and protein networks in multiple ways. First, networks will be used as a means of extracting/generating robust network features. Second, we will extend regularization methods to account for directional or weighted networks (e.g. that capture stimulatory versus inhibitory interactions). Third, we will use networks to detect changes in correlation structure across data layers. This aim strongly leverages databases (Pathway Commons) and methods (Network-Based Stratification) previously developed by NRNB. Background and Significance. Predicting aspects of complex human traits, such as disease progression and the response to pharmaceutical treatment, remains a major challenge in biology and medicine. Presently a wealth of measurements is being generated using a variety of technologies and tools. For example, a growing number of global consortia, such as The Cancer Genome Atlas32 , the Cancer Cell Line Encyclopedia33 , and ENCODE34 , all produce datasets that span not just one but many layers of ‘omics information, including genomes and single nucleotide variants, copy number
- 9. changes, genome rearrangements, epigenetic changes, and RNA and protein abundances and modifications. These data are all too often analyzed separately, using simple approaches seeking to connect single features with biological conditions of interest. This aim will further advance the use of networks in integrated interpretation of heterogeneous biological data. Supervised machine learning methods and molecular networks encoding prior biological knowledge are the key tools we propose to use for making progress on this front. Within the supervised learning field, regression analysis is perhaps the most common statistical method for association of heterogeneous inputs with continuous phenotypic traits. Both the Cancer Cell Line Encyclopedia and the Genomics of Drug Sensitivity in Cancer projects have successfully applied a regularized regression analysis, known as elastic net, for the reconstruction of drug activity profiles as a weighted sum of genomic features33,35,36 . Towards network-based regression, some work has been conducted to develop regularization methodology that makes use of known interactions among input features37-39 . These methods have been used to identify features relevant to glioblastoma survival time and the identification of age-dependent molecular modules in human brains. One limitation of this work has been its restriction to a relatively small number of features (<2000 genes). The work proposed here will enable a marked expansion of features to be analyzed by using network information and leveraging resources developed by the NRNB, including GeneMANIA and Pathway Commons. Motivating Collaborations. Several our Driving Biomedical Projects are excellent proving grounds for technology development under this aim. We will be driven by three DBPs in particular – The Cancer Genome Atlas (Stuart), the Colorectal Cancer Subtyping Consortium (Sage Bionetworks), and the NCI drug response prediction project (Pommier) – all of which center on prediction of cancer outcome from multi-modal ‘omics datasets. For example, Yves Pommier’s lab at the National Cancer Institute has been systematically screening ~20,000 publicly available compound drug screening library of the NCI-60 cancer cell lines made available by the National Cancer Institute as part of the Development Therapeutics Program. One fundamental challenge is that off-target effects of many drugs are not well understood and as a result, development of novel pharmaceuticals brought to market has declined sharply in recent decades. Pommier’s interest is to use network biology to increase the efficacy of drug compounds, while minimizing their side effects, by creating a greater understanding for the factors involved in drug response. We will also investigate application of new technology we develop in liposarcoma treatment (White, MIT) and the Wrensch Glioma DBP. Preliminary Results and Progress Report. In prior work, NRNB investigators have developed a number of network-based prediction methods relevant to this aim. In Chuang et al. we used protein- protein interaction networks to detect modules of RNA expression that were predictive of CLL progression14 . Using a greedy search heuristic, a protein interaction network was mined to identify connected subnetworks for which the genes had an aggregate expression level predictive of CLL progression. These subnetworks were validated in two other independent patient cohorts, illustrating the robustness of using network extracted features. Later, this method was improved using the technique of network-guided random forests17 . Random forests use sampling with an iterative tree based classifier to result in robust and accurate classifiers. By adding a network constraint to this method, we were able to identify complex ‘logic-circuit’ relationships among perturbations in gene expression with implication to cancer outcome and tissue differentiation. This work showed that use of a network constraint resulted in coherent biologically meaningful predictive functions (as opposed to ‘black-box’ results from standard random forest approaches, which are typically difficult to interpret). Most recently we introduced the method of Network-Based Stratification (NBS), which integrates somatic tumor genomes with gene networks using network propagation40 (Figure 1). Network propagation is a feature transformation method that uses a random-walk-like procedure to integrate a measurement (in this case gene mutations) with local network topology, generating a new feature space of network activity profiles. We found this approach could be used in an unsupervised
- 10. framework allowing for stratification of cancer into informative subtypes, by clustering together patients with mutations in similar network regions. NBS has been demonstrated in ovarian, uterine, and lung cancer40 and, more recently, thyroid cancer cohorts41 from The Cancer Genome Atlas. For each tissue, NBS identifies clear subtypes that are predictive of clinical outcomes such as patient survival or response to therapy, and it identifies network regions characteristic of each subtype. The work proposed here will further develop these network-based approaches in combination with interaction networks and other information available in GeneMANIA26,42 , Pathway Commons43 and cBioPortal44 , three databases that were created by our team. Methods. Our development of network-based supervised learning methods centers on three synergistic tasks: 1. Methods for feature extraction spanning multiple data types. We will extend current methods for network propagation and network influence to efficiently compute network level features integrating measurements spanning multiple molecular level data types. 2. An integrated framework for network-guided regression across multiple data types. We will draw on existing methods for network regularized regression to develop methods for network regularized classification and regression of data features from multiple data types, considering covariation and dependence patterns across the data layers. 3. Integration of molecular network directionality and context-specific network edge weighting. We will extend the two above methodologies to benefit from directed networks, capturing gene repression and activation relationships, and condition-specific reweighting of network links. We will also explore methods for using genomic data to predict condition specific edge weighting and directionality. Task 1: Methods for feature extraction spanning multiple data types. We will extend methods for feature transformation and extraction using a network propagation based approach. The key advance over earlier work will be to effectively integrate information from both multiple molecular networks and multiple types of molecular measurement data. Briefly, we will jointly perform network propagation of perturbed measurements from different data sources, by considering this as a propagation task on a Figure 1. Network based stratification of somatic tumor mutations. (A) Co- clustering matrices comparing NBS to standard consensus clustering. (B) Ovarian cancer: Association of NBS subtypes with patient survival time. (C) Kaplan-Meier survival plot for NBS ovarian cancer subtypes (k = 4). (D) Network view of genes with high network smoothed mutation scores in subtype 1 relative to other subtypes. Subtype 1 has the lowest survival and highest platinum resistance rates amongst the four recovered subtypes. Node size shows smoothed mutation scores. Node color corresponds to functional classes of interest. Thickened node outlines indicate genes that are known cancer genes included in the COSMIC cancer gene census.
- 11. meta-network with nodes for every measured value in the input. The meta-network includes edges between nodes representing values of the same type. Performing propagation using the standard approach and this meta-network is equivalent to independent propagation of each data type. This framework will be extended to capture complex structure among the data types, however. For example, adding an edge between corresponding nodes in different data layers (e.g. a somatic mutation in gene X and a copy number deletion in the same gene X), causes the propagation of values in network regions across the different data types. Similarly, we will explore more complex relationships among different data types, e.g. by adding to the meta-network an edge linking gene X of one data type to a related gene Y in a different data type. These cross data layer relationships can be mined from prior knowledge or separate experiments (e.g. trans eQTL relationships, TF- downstream target) or these may be learned directly from the data using simple information theoretic approaches as was recently demonstrated45 . The above approach can be extended to be jointly performed on multiple input networks mitigating the effects of missing edges or noise in any single network. Furthermore, we will also explore performing inference of missing edges across data types, resulting in an expectation maximization-like procedure able to further highlight putative cross-data- type network relationships. Task 2: Develop an integrated framework for network guided classification and regression across multiple data types. We are currently extending the use of a network-based regularized regression analysis37 . In this framework, two penalty terms are combined, one introduced by a LASSO result in a sparse regression function using a small number of features. The second added network regularization term encourages solutions that ‘respect’ edges in the input network, penalizing large differences between the regression coefficients of network-connected features. Here, we will use the GeneMANIA gene interaction network database for this second regularization term, which has the ability to weight gene interactions according to the strength of evidence for that interaction across multiple data sources. The relative influence of each of these penalty terms will be balanced using an additional parameter as in the elastic net regression method36 . These resulting predictors are expected to be more biologically informative than classical ‘black box’ regression because they link to interpretable biological concepts. Several immediate challenges will need to be addressed as part of this work. First, as highlighted by Li and Li46 , the above regularization scheme may not perform well when network-linked predictors have opposite signs in their regression coefficients38 . Second, Li and Li developed their approach for expression measurements only; the appropriate normalization and scaling of data types and the specification of prior knowledge networks relating predictors of heterogeneous data is less clear. Furthermore, biological network knowledge is incomplete, and may include errors. As part of our work we will seek to understand the robustness of network-constrained regression methods in the face of missing and/or erroneous data. Finally, the idea for cross data type integration using a global meta- network presented above (Task 1) naturally extends to the regularization framework described here. Task 3: Improve performance of biological system response prediction by integration and prediction of network directionality and context specific network edge weighting. The methodology introduced above (Tasks 1 and 2) may further benefit from explicit modeling of the directionality of molecular interaction (e.g. repression vs. activation) and types of interaction beyond simple protein-protein interactions (e.g. TF-target binding, kinase-signaling, metabolic process links). Furthermore, in the same way the genome is not uniformly expressed, we have no reason to assume that molecular networks operate uniformly across conditions. A trivial but illustrative example is to consider that any gene not expressed in a certain condition or tissue will have no role in the interaction network for that condition. Thus, developing advanced methods for inferring the condition-specific importance of network links is central to the above discussed tasks. We propose to accomplish this task through information theoretic approaches for capturing changes in the dependence and correlation of measurements in different conditions (e.g., coherent links in the networks which become less coherent should be scaled down, and vice versa).
- 12. 2.3 TECHNOLOGY FOR NETWORK ANALYSIS OF GENETIC VARIANT DATA Project Leader: Alexander Pico (Gladstone Institutes) Overview. Recently, we and others have shown that network information is useful for predicting causal variants from the background of many variants potentially associated with disease5 . In this project, we will focus on end-user software technology for network analysis of genetic variant data, such as SNPs and somatic mutations, associated with human disease. We will develop a variant data resource accessible from within Cytoscape that will facilitate frequent variant analysis workflows. This technology development will be driven by an ongoing and long-standing DBP with the Wrensch lab at UCSF on identifying causal variants in glioma, a devastating brain cancer. With an emphasis on making a suite of tools that are accessible to the broader research community, we will also coordinate with the DREAM Challenges DBP with Sage Bionetworks and Gustavo Stolovitzky. Co-organizing a challenge around cancer subtyping, for example, would drive network methodology development in the field. And the winning methods would help prioritize which methods–beyond those listed below– we should include in our variant analysis technology suite. Objectives. The major tasks of this aim are to develop software tools for: 1) performing network analysis on variant data; and 2) accessing, modeling and annotating variant data. Together, these tasks will produce technologies to enable geneticists, epidemiologists, and clinicians to work with and visualize variant data in new and powerful ways. The first task will focus on both common and recent methodologies not yet broadly available for variant data visualization and analysis using biological networks. In many cases, these methods have only been implemented in a localized computer environment to produce the proof-of-concept needed to publish and have not been more widely distributed in any form. In other cases, they are distributed for only specialized users and environments, e.g., command-line. By supporting these methods in Cytoscape, we will produce tools that can be more widely distributed and adopted, leveraging the generic and powerful Cytoscape platform as well as its associated ecosystem. Given the potentially large size and scope of gene-disease association study datasets, the second task addresses a non-trivial data management challenge. Network-based variant analysis will necessitate a query-and-selective-data-import approach, rather than a single import into in-memory data structures. Developed for just this reason, the ADAM format and processing patterns are useful for interactively working with these genetic variant data47 . In terms of annotating variant data, there exist dozens of resources providing a wide range of annotations from structural to functional and from reference to predictive. Given our prior work in this area with the SNPLogic project48 , and the preliminary work on MyVariant.info, we aim to greatly expand the accessibility and improve the maintenance of a JSON-based web service dedicated to variant annotations. We will then develop a Cytoscape app to access this general service, bringing up-to-date variant annotations to user variant datasets. Background and Significance. As yet, most inherited variation influencing complex diseases is likely still unknown, including the causative mutations of over 3500 rare monogenic diseases2 . A key distinguishing feature of disease-causing, versus other less severe mutations, is that they disrupt normal cellular and biochemical mechanisms. Current mutation assessment tools, such as Polyphen249 , SIFT50 and MutationAssessor51 , generally focus on structured protein coding regions and evaluating damage to protein function based on amino acid conservation, physicochemical properties and splice sites. However, a reasonable hypothesis is that knowledge of biochemical mechanisms and networks will substantially improve our ability to interpret mutations across the genome6 . Over the past 24 years, Dr. Wrensch and colleagues have studied cohorts of UCSF patients with devastating brain cancers, including adult glioma, focused on etiology and genetic variant
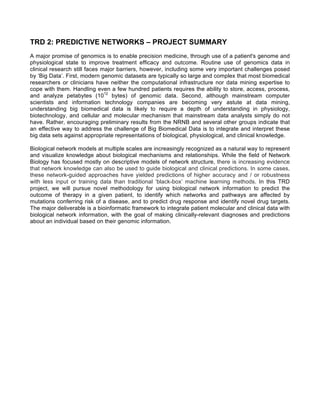
- 13. associations (see Wrensch DBP). We have worked with the Wrensch lab since 2008 to analyze and interpret data she has collected48,52-57 . A persistent challenge in this work relates to identifying the set of causal variants that are responsible for heritable variation for a given disease risk. These variants are informative for mechanistic models, diagnostics and drug development programs. In some cases, the causal variants may be a subset of associated variants or perhaps be in linkage disequilibrium (LD) with them. Modern imputation methods and expanded sequencing coverage can help in these cases. But, in other cases the causal variants may simply be too rare in frequency to be detected with significance. This is where molecular networks and pathways provide a biologically meaningful context for working with variant data, as well as for integrating expression, proteomics, environmental or practically any other data types that can be mapped to genes, proteins and interactions. Combinations of variants in a given individual are responsible for conferring a risk threshold or for bypassing protective redundancies in biological processes for complex diseases. Different combinations of variants can be responsible for the same disease, affecting convergent processes, while simultaneously conferring different subtypes, survival rates and treatment efficacy rates. Ultimately, it is the direct and indirect interactions among a set of variants that produces phenotype. This perspective of variant interactions is not new, but a recent and impressive surge in network analytical methods applicable to variants is promising new approaches and insights. Over the past 18 months, there have been an unprecedented number of papers relevant to this topic, spanning pathway curation and association, random forest and inference approaches, network-based stratification and a variety of integrative analyses40,58-81 . There has also been a recent burst of published activity on the combined topic of network analysis and GWAS (genome-wide association studies), independent of the publishing trends for either topic alone (Figure 2). Preliminary Results and Progress Report. We have previously developed variant data management and annotation tools relevant to this aim and the challenges faced by our Wrensch DBP. The Variation app for Cytoscape was a prototype many years in the making that Dr. Pico contributed through NRNB and GSoC collaborations (http://apps.cytoscape.org/apps/variation). In this work, we identified the initial requirements for a variant data import app and solved some of the major initial roadblocks regarding file formats and access via ADAM formats and patterns47 . This prototype has allowed us to enable basic VCF file import and visualization in a robust way starting from any network annotated with gene or protein identifiers. The work proposed below will build upon this foundation and greatly expand the access, analysis and visualization potential. Another relevant prototype project is MyVariant.info (http://myvariant.info/). Arising from a recent Network of Biothings hackathon attended by the Pico group, this resource is modeled off the MyGene.info resource developed by Andrew Su’s group at Scripps82 . MyVariant.info is currently a proof of concept with a handful of annotation types, but the foundation exists for developing the most up-to-date and programmatically- friendly variant annotation resource available, as described in the Methods below. This aim also leverages the work of Drs. Sander, Ideker and Bader as co-investigators of the NRNB. Dr. Sander's work on MEMo generates network models that characterize tumor subtypes83 , while Dr. Figure 2. Normalized publication counts per year for PubMed search terms. The number of results for the search ["network analysis" gwas] more than doubled in 2013 relative to 2012 (from 14 to 31), shown in red. This burst is not seen in either ["network analysis"] search results, which are fairly linear, nor [gwas] results, which doubled in 2008 and 2009 and have since plateaued, nor in their additive relative results (gray dashed line). 0 0.2 0.4 0.6 0.8 1 2013 2012 2011 2010 2009 2008 2007 2006 ["network analysis"] + [gwas] ["network analysis" gwas]
- 14. Ideker's work on network-based stratification (NBS) classifies tumors based molecular markers in the context of networks40 . Dr. Bader's patient network visualization work in aim 1 of this TRD will also be used here to help visually identify important variants in a large network context. Preliminary work in this regard includes the Circos-styled custom graphics support added to Cytoscape core84 by another NRNB staff member, Dr. Morris and work on general node charts by the Bader group. Methods. To enable broad adoption of network methods in the analysis of variant data, this aim focuses on two main tasks: making new variant analysis technologies more accessible, and streamlining the import and annotation of variant data. Task 1: Accessible tools for variant analysis with associated visualization. This task will enable a powerful genetic variant pathway analysis workflow that leverages NRNB technology and expertise and serves our DBP and broader research community needs: Pathway analysis of GWAS identified genes. We will port two recently-published approaches to Cytoscape apps as part of a set of GWAS-specific pathway analysis tools. First, Evangelou et al. presented novel hierarchical-based pathway analysis methods optimized for genome-wide association studies66 . These methods are available in an R package and we will make them accessible to Cytoscape via the existing bridge85 . Second, Bakir-Gungor et al. developed PANOGA, a web server for pathway analysis of GWAS data68 . We will develop a Cytoscape app to interface with this web service and make the analysis available in Cytoscape. The interaction network and pathway-based results from both tools are ideally suited for visualization in Cytoscape. Combined with access to richly annotated variant data, described in the next aim, these tools will enable GWAS-specific pathway analysis workflows needed by our DBP in Cytoscape. Network based patient population stratification. The recent availability of molecular profile data has improved accuracy of cancer subtype classification into clinically-relevant groups, compared to using traditional features, such as from histology. Identification of these groups helps improve diagnosis, prognosis and treatment planning. Also, accurate groupings help characterize the mechanisms underlying the etiology and progression of a tumor. As an NRNB-supported project, Dr. Ideker's group developed a novel cancer classification method using networks and a topology-based smoothing algorithm to address issues with otherwise sparse and indirectly associated molecular markers40 . Although the student code for the project is available, this network-based stratification (NBS) method has yet to be developed as a robust tool for community use. Dr. Pico will collaborate with Dr. Ideker's group to port this functionality into the Cytoscape environment. This aspect of the work will focus on making the method accessible to Cytoscape users and specifically for use cases relevant to Dr. Wrensch's DBP. Integrative analysis with MEMo. Complementary to the NBS approach, Dr. Sander's group developed a method to infer gene network modules that exclusively characterize tumor subtypes based on molecular markers and reference pathways and networks83 . This method, called Mutual Exclusivity Modules (MEMo), is currently available as a distributed Java-based command line tool. Dr. Pico will collaborate with Dr. Sander's team to make MEMo analysis available to variant data from within Cytoscape. This effort will put this technology in the hands of our DBP and other researchers, making it a routine matter to apply to available data. Task 2: Tools for accessing variant data and annotations. To enable the analytical and visualization approaches described above, variant data must be properly modeled and annotated in Cytoscape. Import and annotation of variants into Cytoscape will also facilitate the development of variant analysis workflows by the Cytoscape app development community (over 200 apps by 460 app developers to-date; see Dissemination Core). Many tools exist to perform gene-to-variant identifier mapping, including scandb.org and our own SNPLogic.org, and a prototype of this feature is available in the Cytoscape Variation app. However, these tools are limited to considering a few of the useful
- 15. methods to map variants to genes, including considering proximity outside of a gene and variants that predict gene expression (eQTLs). Thus, we will expand this functionality by developing intelligent mappings that will consider the proximity of neighboring genes, regions of conservation, regulatory sites and haplotype blocks. Once a set of variants are loaded into Cytoscape, we will facilitate the query and import of relevant variant annotations. These span a wide range, including general annotations (e.g., major allele frequency), characteristics (e.g., exonic or intronic), and predictions (e.g., affects protein structure or binding sites). We will port our SNPLogic48 sources for variant annotations over to the prototype MyVariant.info platform, which is more amenable to programmatic access. We will then be able to develop a relatively simple Cytoscape app to retrieve annotations from this extensible resource. Finally, we will facilitate the adoption of ADAM formatting to enable programmatic query and import of standardized variant data for individuals and large cohorts. We will store user-provided sample data distinct from background population data within the Cytoscape data model and also support the labeling of samples as patient or control. Support for distinct sets of variant data (i.e., background, control, and per patient) will make possible several analytical and visualization options described in the previous aim.
- 16. TRD 2: PREDICTIVE NETWORKS – BIBLIOGRAPHY AND REFERENCES CITED 1. Katsnelson, A. Momentum grows to make 'personalized' medicine more 'precise'. Nature medicine 19, 249 (2013). 2. Boycott, K.M., Vanstone, M.R., Bulman, D.E. & MacKenzie, A.E. Rare-disease genetics in the era of next-generation sequencing: discovery to translation. Nature reviews. Genetics 14, 681- 91 (2013). 3. Rilstone, J.J., Alkhater, R.A. & Minassian, B.A. Brain dopamine-serotonin vesicular transport disease and its treatment. The New England journal of medicine 368, 543-50 (2013). 4. Olson, M.O., Dundr, M. & Szebeni, A. The nucleolus: an old factory with unexpected capabilities. 10, 189-196 (2000). 5. Ideker, T., Dutkowski, J. & Hood, L. Boosting signal-to-noise in complex biology: prior knowledge is power. Cell 144, 860-3 (2011). 6. Carter, H., Hofree, M. & Ideker, T. Genotype to phenotype via network analysis. Curr Opin Genet Dev 23, 611-21 (2013). 7. Chuang, H.Y., Lee, E., Liu, Y.T., Lee, D. & Ideker, T. Network-based classification of breast cancer metastasis. Mol Syst Biol 3, 140 (2007). 8. Taylor, I.W. et al. Dynamic modularity in protein interaction networks predicts breast cancer outcome. Nature biotechnology 27, 199-204 (2009). 9. Dao, P. et al. Inferring cancer subnetwork markers using density-constrained biclustering. Bioinformatics 26, i625-31 (2010). 10. Pinto, D. et al. Functional impact of global rare copy number variation in autism spectrum disorders. Nature (2010). 11. Northcott, P.A. et al. Subgroup-specific structural variation across 1,000 medulloblastoma genomes. Nature 488, 49-56 (2012). 12. Witt, H. et al. Delineation of two clinically and molecularly distinct subgroups of posterior fossa ependymoma. Cancer Cell 20, 143-57 (2011). 13. Liu, J.C. et al. Seventeen-gene signature from enriched Her2/Neu mammary tumor-initiating cells predicts clinical outcome for human HER2+:ERalpha- breast cancer. Proceedings of the National Academy of Sciences of the United States of America 109, 5832-7 (2012). 14. Chuang, H.Y. et al. Subnetwork-based analysis of chronic lymphocytic leukemia identifies pathways that associate with disease progression. Blood 120, 2639-49 (2012). 15. Lee, E., Chuang, H.Y., Kim, J.W., Ideker, T. & Lee, D. Inferring pathway activity toward precise disease classification. PLoS Comput Biol 4, e1000217 (2008). 16. Bilal, E. et al. Improving breast cancer survival analysis through competition-based multidimensional modeling. PLoS Comput Biol 9, e1003047 (2013). 17. Dutkowski, J. & Ideker, T. Protein networks as logic functions in development and cancer. PLoS Comput Biol 7, e1002180 (2011). 18. Wang, B. et al. Similarity network fusion for aggregating data types on a genomic scale. Nature methods 11, 333-7 (2014). 19. McShane, L.M. et al. Criteria for the use of omics-based predictors in clinical trials. Nature 502, 317-20 (2013). 20. Remke, M., Ramaswamy, V. & Taylor, M.D. Medulloblastoma molecular dissection: the way toward targeted therapy. Current opinion in oncology 25, 674-81 (2013). 21. Meyer, U., Feldon, J. & Dammann, O. Schizophrenia and autism: both shared and disorder- specific pathogenesis via perinatal inflammation? Pediatric research 69, 26R-33R (2011). 22. den Hollander, P., Savage, M.I. & Brown, P.H. Targeted Therapy for Breast Cancer Prevention. Frontiers in oncology 3, 250 (2013). 23. Davila, L. & Ranganathan, P. Pharmacogenetics: implications for therapy in rheumatic diseases. Nature reviews. Rheumatology 7, 537-50 (2011).
- 17. 24. Bauer-Mehren, A. et al. Network analysis of unstructured EHR data for clinical research. AMIA Joint Summits on Translational Science proceedings AMIA Summit on Translational Science 2013, 14-8 (2013). 25. Zuberi, K. et al. GeneMANIA prediction server 2013 update. Nucleic acids research 41, W115- 22 (2013). 26. Mostafavi, S., Ray, D., Warde-Farley, D., Grouios, C. & Morris, Q. GeneMANIA: a real-time multiple association network integration algorithm for predicting gene function. Genome Biol 9 Suppl 1, S4 (2008). 27. Zhou, D., Bousquet, O., Lal, T.N., Weston, J. & Schölkopf, B. Learning with local and global consistency. NIPS 16, 321-328 (2004). 28. Zhu, X., Ghahramani, Z. & Lafferty, J. Semi-supervised learning using gaussian fields and harmonic functions. in International Conference on Machine Learning (ICML) Vol. 3 912-919 (Washington, DC, 2003). 29. Kohler, S. et al. The Human Phenotype Ontology project: linking molecular biology and disease through phenotype data. Nucleic Acids Res 42, D966-74 (2014). 30. Girdea, M. et al. PhenoTips: patient phenotyping software for clinical and research use. Human mutation 34, 1057-65 (2013). 31. Mostafavi, S., Goldenberg, A. & Morris, Q. Labeling nodes using three degrees of propagation. PLoS ONE 7, e51947 (2012). 32. Cancer Genome Atlas Research, N. et al. The Cancer Genome Atlas Pan-Cancer analysis project. Nat Genet 45, 1113-20 (2013). 33. Barretina, J. et al. The Cancer Cell Line Encyclopedia enables predictive modelling of anticancer drug sensitivity. Nature 483, 603-7 (2012). 34. Consortium, E.P. et al. Identification and analysis of functional elements in 1% of the human genome by the ENCODE pilot project. Nature 447, 799-816 (2007). 35. Yang, W. et al. Genomics of Drug Sensitivity in Cancer (GDSC): a resource for therapeutic biomarker discovery in cancer cells. Nucleic Acids Res 41, D955-61 (2013). 36. Zou, H., Hastie, T. Regularization and variable selection via the elastic net. J. R. Statist. Soc. B 67, 301-320 (2005). 37. Li, C. & Li, H. Network-constrained regularization and variable selection for analysis of genomic data. Bioinformatics 24, 1175-82 (2008). 38. Li, C. & Li, H. Variable Selection and Regression Analysis for Graph-Structured Covariates with an Application to Genomics. Ann Appl Stat 4, 1498-1516 (2010). 39. Johannes, M., Frohlich, H., Sultmann, H. & Beissbarth, T. pathClass: an R-package for integration of pathway knowledge into support vector machines for biomarker discovery. Bioinformatics 27, 1442-3 (2011). 40. Hofree, M., Shen, J.P., Carter, H., Gross, A. & Ideker, T. Network-based stratification of tumor mutations. Nat Methods 10, 1108-15 (2013). 41. Giordano, T.J. & The Cancer Genome Atlas Research Network. Integrated Genomic Characterization of Papillary Thyroid Carcinoma. Cell (In press). 42. Zuberi, K. et al. GeneMANIA prediction server 2013 update. Nucleic Acids Res 41, W115-22 (2013). 43. Cerami, E.G. et al. Pathway Commons, a web resource for biological pathway data. Nucleic Acids Res 39, D685-90 (2011). 44. Gao, J. et al. Integrative analysis of complex cancer genomics and clinical profiles using the cBioPortal. Sci Signal 6, pl1 (2013). 45. Jerby-Arnon, L. et al. Predicting Cancer-Specific Vulnerability via Data-Driven Detection of Synthetic Lethality. Cell 158, 1199-209 (2014). 46. Li, C.Y. & Li, H.Z. Variable Selection and Regression Analysis for Graph-Structured Covariates with an Application to Genomics. Annals of Applied Statistics 4, 1498-1516 (2010). 47. Massie, M.N., FA; Hartl, C; Kozanitis, C; Schumacher, A; Joseph, AD; Patterson, D. ADAM: Genomics Formats and Processing Patterns for Cloud Scale Computing. (University of California at Berkeley, 2013).
- 18. 48. Pico, A.R. et al. SNPLogic: an interactive single nucleotide polymorphism selection, annotation, and prioritization system. Nucleic Acids Res 37, D803-9 (2009). 49. Adzhubei, I.A. et al. A method and server for predicting damaging missense mutations. Nat Methods 7, 248-9 (2010). 50. Kumar, P., Henikoff, S. & Ng, P.C. Predicting the effects of coding non-synonymous variants on protein function using the SIFT algorithm. Nat Protoc 4, 1073-81 (2009). 51. Reva, B., Antipin, Y. & Sander, C. Predicting the functional impact of protein mutations: application to cancer genomics. Nucleic Acids Res 39, e118 (2011). 52. Chang, J.S. et al. Pathway analysis of single-nucleotide polymorphisms potentially associated with glioblastoma multiforme susceptibility using random forests. Cancer Epidemiol Biomarkers Prev 17, 1368-73 (2008). 53. Jenkins, R.B. et al. A low-frequency variant at 8q24.21 is strongly associated with risk of oligodendroglial tumors and astrocytomas with IDH1 or IDH2 mutation. Nat Genet 44, 1122-5 (2012). 54. Rice, T. et al. Inherited variant on chromosome 11q23 increases susceptibility to IDH-mutated but not IDH-normal gliomas regardless of grade or histology. Neuro Oncol 15, 535-41 (2013). 55. Walsh, K.M. et al. Analysis of 60 reported glioma risk SNPs replicates published GWAS findings but fails to replicate associations from published candidate-gene studies. Genet Epidemiol 37, 222-8 (2013). 56. Walsh, K.M. et al. Genetic variants in telomerase-related genes are associated with an older age at diagnosis in glioma patients: evidence for distinct pathways of gliomagenesis. Neuro Oncol 15, 1041-7 (2013). 57. Wrensch, M. et al. Variants in the CDKN2B and RTEL1 regions are associated with high-grade glioma susceptibility. Nat Genet 41, 905-8 (2009). 58. Gu, Y. et al. Network analysis of genomic alteration profiles reveals co-altered functional modules and driver genes for glioblastoma. Mol Biosyst 9, 467-77 (2013). 59. Jia, P. & Zhao, Z. Network.assisted analysis to prioritize GWAS results: principles, methods and perspectives. Hum Genet 133, 125-38 (2014). 60. Chung, R.H. & Chen, Y.E. A two-stage random forest-based pathway analysis method. PLoS One 7, e36662 (2012). 61. Juraeva, D. et al. Integrated pathway-based approach identifies association between genomic regions at CTCF and CACNB2 and schizophrenia. PLoS Genet 10, e1004345 (2014). 62. Chen, Q.R. et al. Multi-SNP analysis of GWAS data identifies pathways associated with nonalcoholic fatty liver disease. PLoS One 8, e65982 (2013). 63. Kim, J., Kwon, J.S. & Kim, S. Gene set analyses of genome-wide association studies on 49 quantitative traits measured in a single genetic epidemiology dataset. Genomics Inform 11, 135-41 (2013). 64. Jia, P., Liu, Y. & Zhao, Z. Integrative pathway analysis of genome-wide association studies and gene expression data in prostate cancer. BMC Syst Biol 6 Suppl 3, S13 (2012). 65. Dharuri, H. et al. Automated workflow-based exploitation of pathway databases provides new insights into genetic associations of metabolite profiles. BMC Genomics 14, 865 (2013). 66. Evangelou, M., Dudbridge, F. & Wernisch, L. Two novel pathway analysis methods based on a hierarchical model. Bioinformatics 30, 690-7 (2014). 67. Martini, S. et al. Integrative Biology Identifies Shared Transcriptional Networks in CKD. J Am Soc Nephrol (2014). 68. Bakir-Gungor, B., Egemen, E. & Sezerman, O.U. PANOGA: a web server for identification of SNP-targeted pathways from genome-wide association study data. Bioinformatics 30, 1287-9 (2014). 69. Peng, C.H. et al. Causal inference of gene regulation with subnetwork assembly from genetical genomics data. Nucleic Acids Res 42, 2803-19 (2014). 70. Chen, L. et al. Integrative network analysis to identify aberrant pathway networks in ovarian cancer. Pac Symp Biocomput, 31-42 (2012).
- 19. 71. Hwang, T.H. et al. Large-scale integrative network-based analysis identifies common pathways disrupted by copy number alterations across cancers. BMC Genomics 14, 440 (2013). 72. Network, T.C.G.A.R. Comprehensive molecular portraits of human breast tumours. Nature 490, 61-70 (2012). 73. Brennan, C.W. et al. The somatic genomic landscape of glioblastoma. Cell 155, 462-77 (2013). 74. Wang, W., Baladandayuthapani, V., Holmes, C.C. & Do, K.A. Integrative network-based Bayesian analysis of diverse genomics data. BMC Bioinformatics 14 Suppl 13, S8 (2013). 75. Sertbas, M., Ulgen, K. & Cakir, T. Systematic analysis of transcription-level effects of neurodegenerative diseases on human brain metabolism by a newly reconstructed brain- specific metabolic network. FEBS Open Bio 4, 542-53 (2014). 76. Kunkle, B., Yoo, C. & Roy, D. Discovering gene-environment interactions in glioblastoma through a comprehensive data integration bioinformatics method. Neurotoxicology 35, 1-14 (2013). 77. Hiersche, M., Ruhle, F. & Stoll, M. Postgwas: advanced GWAS interpretation in R. PLoS One 8, e71775 (2013). 78. Farber, C.R. Systems-level analysis of genome-wide association data. G3 (Bethesda) 3, 119- 29 (2013). 79. Leiserson, M.D., Eldridge, J.V., Ramachandran, S. & Raphael, B.J. Network analysis of GWAS data. Curr Opin Genet Dev 23, 602-10 (2013). 80. Hicks, C., Miele, L., Koganti, T. & Vijayakumar, S. Comprehensive assessment and network analysis of the emerging genetic susceptibility landscape of prostate cancer. Cancer Inform 12, 175-91 (2013). 81. Duan, S., Luo, X. & Dong, C. Identification of susceptibility modules for coronary artery disease using a genome wide integrated network analysis. Gene 531, 347-54 (2013). 82. Wu, C., Macleod, I. & Su, A.I. BioGPS and MyGene.info: organizing online, gene-centric information. Nucleic Acids Res 41, D561-5 (2013). 83. Ciriello, G., Cerami, E., Sander, C. & Schultz, N. Mutual exclusivity analysis identifies oncogenic network modules. Genome Res 22, 398-406 (2012). 84. Morris, J.H.K., A.; Ferrin, T.E.; Pico, A.R. enhancedGraphics: a Cytoscape app for enhanced node graphics. F1000Research 3(2014). 85. Goncalves, E. & Saez-Rodriguez, J. Cyrface: An interface from Cytoscape to R that provides a user interface to R packages. F1000Res 2, 192 (2013).