SlideShare ist ein Scribd-Unternehmen logo
1 von 25
Downloaden Sie, um offline zu lesen
Journal of Economics and Sustainable Development                                                        www.iiste.org
ISSN 2222-1700 (Paper) ISSN 2222-2855 (Online)
Vol.4, No.3, 2013

          Application of Contingent Valuation Method (CVM) in
Determining Demand for Improved Rainwater in Coastal Savanna
                                Region of Ghana, West Africa

                              Anthony Amoah1and Clement Dorm-Adzobu2
Abstract

Coastal regions of Ghana are characterized by low annual rainfall ranging from 800mm to 900mm. This
has contributed to water scarcity for domestic and agricultural use. In order for Ghana to meet the
Millennium Development Goal of eradicating extreme poverty and hunger, alternative water sources
must be exploited for domestic uses. This study uses the CV method as a valuation technique for
non-marketed goods to estimate demand for clean rainwater for domestic use. In addition, the ordered
probit model was used to determine the various factors that can influence respondents’
willingness-to-pay for clean rainwater. The study found that about 93.2% of respondents are willing to
pay GH¢0.025 daily for a 34cm container of clean rainwater and this amount was observed to be
influenced by some socioeconomic factors. Government involvement is therefore recommended in the
provision of the modern rainwater harvesting facilities because of the incidence of poverty within the
coastal savanna areas of Ghana. It is also recommended that more education on the modern method of
harvesting rainwater should precede the application of any rainwater harvesting strategy in Ghana.

Key words: Willingness-to-Pay, Rainwater Harvesting Technology, Ordered Probit, Marginal Effects.


1.0 Introduction
Water plays a significant role in the life of all living things. Without water there would be no
life for living things. Clean water is essential for human survival and satisfaction because
human health depends on the provision of safe, adequate, accessible and reliable drinking
water supplies (Porto, 2004). Gleick (1996) has indicated that the minimum total
recommended basic water requirement in litres per person per day is 50. Health experts also
consider clean water to be crucial for human health (Batmanghelidj, 2009).

As global population rises global market for water also keeps on increasing. In 2006, global
water demand rose above the estimated value of $400 billion per year (Black, 2007). Water
occupied an increasingly important place on the international agenda since 1992; with
questions about the impact of climate change on water resources, the possibility that disputes

1
  Amoah, Anthony (corresponding author) is a Lecturer in the Dept. of Economics, Central University College, P.O Box DS
2310, Dansoman-Accra. Email:aamoah@central.edu.gh
2
  Dorm-Adzobu, Clement (Professor) is the Dean of the Faculty of Arts and Social Sciences, Central University College,
P.O Box DS 2310, Dansoman-Accra.
                                                           1
Journal of Economics and Sustainable Development                                                              www.iiste.org
ISSN 2222-1700 (Paper) ISSN 2222-2855 (Online)
Vol.4, No.3, 2013
about access to water might exacerbate regional tensions, and whether large-scale planning
projects are the best way to meet future needs, emerging as key issues (Love, 1999).One
important goal of the Millennium Development Goals (MDGs) is to eradicate extreme
and hunger globally. Poverty and hunger issues cannot be discussed in isolation without
consideration of potable water. International community through the United Nations
Millennium Declaration of 2000 has pledged to halve by 2015 the proportion of people who
unable to access safe drinking water. As at two thousand and one (2001), almost half the
population of Sub-Sahara Africa was struggling to survive on $1 per day or less, the same
proportion as in 1990. The Ghana Poverty Reduction Strategy (2003-2005) targets improved
access to water as very critical for the country (Ghana). Provision of adequate clean water for
human consumption is important in fulfilling global and national goals for poverty reduction.

In the developing world, rainwater harvesting for potable use is important both from the
standpoint of water supply and health (Melby, 2006). The Virginia-US Rainwater Harvesting
Manual compiled by The Cabell Brand Center in 2007 stated that rainwater can offer a
sustainable alternative potable water source. Rainwater harvesting has again been recognized
at the 2006 Climate Change Convention held in Nairobi-Kenya as an alternative option in
addressing current water needs and provides water security against future droughts especially
in African countries (Mashood et al., 2011).

Rainwater harvesting means capturing the rain where it falls or capturing the runoff and
taking measures to store that water for domestic use and other purposes (Mashood et al.,
2011). Generally, all fresh water resources come from rainwater, either surface water or
ground water and, therefore rainwater can thus be said to be the source of all water sources.
Rainwater harvesting technology can be inferred as the oldest man-made technology that
provides potable water for domestic, agricultural and industrial use. In Ghana, rainwater
harvesting started at the household level where small water storage containers were used to
collect and store rain during storms (Siabi et al., 2008). The British colonists in Ghana
introduced advanced methods of harvesting rainwater in their houses, public institutions
among others. Ironically, some areas in Ghana, particularly houses with thatched roofing
systems are still using pre-independence if not pre-colonial methods of harvesting rain.

The study used the Contingent Valuation Method (CVM) as a valuation technique for
non-marketed goods to estimate how much people would be willing to pay for a good
in a hypothetical market or under an imaginary circumstance. It also determines the factors
collectively or individually influenced the respondent’s decision either to be willing to pay or
otherwise. Some studies in the 1980’s have found that, ‘when the CVM is used to estimate the
use of goods and services with which the individuals are familiar….CV surveys that are
carefully designed and administered can yield accurate and useful information on households’
preferences’ (Cummings et al., 1986). This study therefore used the CVM to determine how
much respondents would pay for 3clean or improved rainwater as harvested from a modern
rainwater system in the coastal savanna regions of Ghana in West Africa. It also determines
socioeconomic factors that influenced respondent’s decision.
3
  Clean or improved rainwater as used it this context means the water has been filtered to possess the following qualities:
clourless, not sour or acidic or salty, odourless, potable without negative health implications.
                                                              2
Journal of Economics and Sustainable Development                                  www.iiste.org
ISSN 2222-1700 (Paper) ISSN 2222-2855 (Online)
Vol.4, No.3, 2013
Statement of the Problem
The Coastal Savannah Region of Ghana stretches from Winneba in the Western Region
through the Central and Greater Accra regions respectively to Keta in the Volta Region of the
country. It is described as the driest part of Ghana compared to the other ecological zones of
the country because it receives between 800mm to 900mm of rains annually depicting an
average of 850mm annually. In spite of this challenge, less effort has been done on the part of
government to expedite the process of introducing modern rainwater harvesting systems into
Ghana’s building code after the drafted rainwater strategy was introduced. Residents have
also not invested enough in upgrading their traditional methods of harvesting rainwater to
make it more potable for domestic use.

Formerly, water shortage was a national crisis especially during the dry season however water
shortage in Ghana now is independent of the season. The total amount of water needed in the
capital city of Ghana (Accra) alone is about 150 units however 90 units is produced and out of
the 90 units produced, 45% of the water is lost through defective pipes and other equipments,
and stealing (Asante, 2009). Since 2006 with its severity peaking from the first three months
of 2010, people of Ghana without an exception to the coastal areas of Accra where the seat of
government is located have been confronted with drinking water crisis until today.

Donor aid to economic services and infrastructure represents a substantial proportion of total
expenditure of which water in 2001 is estimated as 76%. This level of donor support for
poverty reduction and growth represents an unsustainable situation in the long term (GPRS,
2003-2006). The issue of growth and development can be envisaged in our policy framework
if both the short term and long term effects are promising. Depending on donors for the
provision and maintenance of rainwater harvesting systems can be envisaged to be
unsustainable.
The general objective of the study is to determine how much Ghanaian households within the
coastal savannah areas will be willing to pay (WTP) for improved rainwater as well as
establishing the possible factors affecting their WTP. This is achieved by using the
Contingent Valuation Method (CVM) which in recent years is commonly used in developing
countries to elicit the individuals’ preferences for the basic infrastructural projects such as
water supply and sanitation (Whittington, 1998; Merrett, 2002).

2.0 Empirical Literature
Shutz and Lindsay (1990) also estimated WTP for ground water in New Hampshire. The
WTP was influenced by factors such as gender, age, the educational level, income level and
number of settlement years in New Hampshire. These variables were statistically significant

Asenso-Okyere et al., (1997) applied the CVM to determine the WTP for health insurance by
the informal sector in Ghana. The study adopted the ordered probit model for the estimation.
The study found that over 90% of respondents are willing to join the scheme and up to 63.6%
respondents were willing to pay a premium of about 5000 old cedis or $3.03 a month for a
household of five persons. Again, the study revealed that the amount that households are


                                                   3
Journal of Economics and Sustainable Development                                   www.iiste.org
ISSN 2222-1700 (Paper) ISSN 2222-2855 (Online)
Vol.4, No.3, 2013
willing to pay is influenced by income, sex, dependency ratio, health care expenditure and
education.

According to Khorshiddoust (2004), one of the earliest researchers who adopted the CVM
was Gramlich (1977). He adopted CVM for the estimation of public participation in an
extraction of demand curve for fresh and clean water in Boston Metropolitan Area in USA.
The primary objective of Gramlich’s study was to calculate the amount of WTP. He applied
statistical models for his estimation after collating data through questionnaire administration
on a hundred and sixty five respondents. The findings of the study revealed appreciable WTP
amounts showing a high demand for fresh and clean water in Boston.

Birol et al. (2007) employed the Contingent Valuation Approach to estimate farmers’ demand
for recycled wastewater in Cyprus. The study used a random sample of 100 respondents
located in the Akrotiri aquifer area in Cyprus, a common-pool water resource with rapidly
deteriorating water quality and quantity. The results reveal that farmers (93.8%) are willing to
adopt this new water resource, and they derive the highest economic values from a recycled
wastewater use program, which provides high quality recycled wastewater, and high water
quantity in the aquifer.

Asfaw, et al. (2008) formulated two‐stage probit econometric model following the log-
likelihood function of Cameron and Quiggin(1994) and Haab (1998). The primary objective
the model was to determine the willingness to pay for health insurance and hence the potential
market for new low-cost health insurance product in Namibia, using the double bounded
contingent valuation (DBCV) method. The results of the study showed that 87% of the
uninsured respondents were willing to join the proposed health insurance scheme and on
average were willing to insure 90% of the average family size. On the average respondents
were willing to pay NAD 484 per capita per month and respondents in the poorest income
quintile were willing to pay up to 11.4 percent of their income. They concluded that private
voluntary health insurance schemes may be able to serve as a reliable income flow for health
care providers considering the vulnerability of the poor.
Also, Mashood et al. (2011) at the 3rd Ghana Water Forum held in Accra-Ghana submitted a
paper on ‘Rainwater Harvesting (RWH) as a Complementary Approach to Improving Water
Supply in Ghana’. The paper sought to find out the reason(s) why rainwater harvesting has
been recognized at the 2006 Climate Change Convention held in Nairobi-Kenya as an
alternative option in addressing current water needs and that, rainwater also provides water
security against future droughts especially in African countries but it has not received the
required support for adoption and expansion in Ghana. The study observed that initial capital
investment is relatively high however given the lifespan, and operation and maintenance cost
the rainwater harvesting storage tank and the borehole or hand dug well, the rainwater
harvesting storage tank is cheaper in the long term. Other reasons for the low level of
of rainwater harvesting technology included limited demonstration facilities, the perception
that rainwater quality is suspect as compared to groundwater and treated surface water


4
    Note: At the time of the study, exchange rate was NAD 7.20 to US$1.00.
                                                   4
Journal of Economics and Sustainable Development                                  www.iiste.org
ISSN 2222-1700 (Paper) ISSN 2222-2855 (Online)
Vol.4, No.3, 2013
inadequate financing and inadequate building regulatory framework to support rainwater
harvesting.

Quartey (2011) at the 3rd Ghana Water Forum held in Accra-Ghana on the theme Water and
Sanitation Services Delivery in a Rapidly Changing Urban Environment, submitted a paper on
“Towards a Sustainable Allocation of Potable Water in Ghana: Evidence from Kumasi”. The
primary objective of the paper was to assess the sustainability of urban water distribution
using the CVM. The willingness-to-pay values were obtained through the bidding game
format by means of an administered questionnaire. The study revealed that consumers would
be willing to pay about 300% to the main urban water distributor (Ghana Water Company
Limited) in the form of an increase in tariffs once their water needs were going to be met. The
degree of demand for potable water revealed a sizeable consumers’ surplus which make
buyers susceptible to extortion by water vendors. The study recommended an urgent
government intervention to save consumers from undue extortion and possible return to
unwholesome water consumption with its accompanying health implications to consumers
and the nation at large.

Based on the literature reviewed on the models, determinants, CV methodology and WTP in
various countries with different projects, it can be inferred that the CVM is a recommended
approach for investigating the economic benefits of the provision of non-marketed goods such
as rainwater in the Coastal Savannah areas of Ghana.
3.0 Methodology
Environmental Economics methodology describes six phases in the practical application of
the CVM. These are the market description, elicitation, calculation, estimation, aggregation
and validation phases (Bateman and Turner, 1995; Quartey, 2011).

3.1 Sources of Data
The study employed both primary data and some secondary data were used in this research.
The primary data were collected through the use of questionnaire, observation and interview.
The secondary data were also collected through reports, bulletins, articles and journals.

A team of five researchers were put together to constitute the interviewers who administered
the questionnaire. Interviews were carried out to encourage respondents to tell their own
stories in their own words. The team leaders of the interviewers have also lived in Accra and
were abreast of the people’s cultural values and behavior, it helped them do the observation,
interpretation and reported accordingly. Interviewers also helped the interviewees to
understand any question they found difficult to comprehend on their own. This was intended
to help the respondents answer all the questions enumerated by the researcher. Data collection
for this survey requires that the market must first be described.

3.2 The Hypothetical Market
Demand for product warrants the existence of a market however, not a conventional market
because values expressed by people are contingent upon their preferences. A key element of
the contingent valuation approach involves specifying the target commodity. A hypothetical
market is one in which the researcher asks respondents to indicate what they think they would
                                                   5
Journal of Economics and Sustainable Development                                    www.iiste.org
ISSN 2222-1700 (Paper) ISSN 2222-2855 (Online)
Vol.4, No.3, 2013
do under a particular imaginary situation. Again, it describes the services that could be made
available and at what market value. An estimation of the demand for improved rainwater is
contingent upon the existence of a hypothetical market. Willingness-to-pay by respondents in
the study area was based on how the market was described. In this study, the researcher
created a hypothetical market for the respondents to reveal their maximum WTP for the
demand of improved rainwater.

 Generally, hypothetical markets are intended to place the respondents in a real world
market-like situation to be able to purchase the targeted products by expressing their
preference for the good in question. In this regard, the purpose of the hypothetical market was
to set up a market for the provision of improved rainwater. This is to serve the Coastal
Savanna areas of Ghana, particularly Greater Accra Region- 5 Dangbe East and Volta
Region-South Tongu districts respectively. The target commodity, that is improved rainwater
was hypothetically described- ‘Assuming the modern rainwater harvesting technology or
system has been installed for your household or neighbourhood with the principal
characteristics as follows: having a filter, modern gutters, sizeable storage facility (say a
polytank with pipe) for the house, the colour of the harvested water is like any clean or
potable water, it is odour free, it is good for any domestic use’. A picture of the scenario was
also shown to the respondents with the intention of helping them get a visual representation of
the hypothetical market that has been orally described. These oral and pictorial descriptions
explained the services that could be made available in real terms to the community and helped
the respondents to reveal how much they were willing to pay for the improved rainwater.

The study observed from the pretest that, some respondents tend to appreciate the
hypothetical market in picture form and some also appreciated the oral description without
pictures. Respondents also found it difficult to believe in the possibility of having clean
rainwater as they are used to the unfiltered traditional method of harvesting rainwater. In
addition, it was realized that, if the oral description of the market is not properly done, the
respondents will either understate or over state their value for the improved rainwater. For this
reason, the study combined both the oral description method as well as the picture6 method in
this survey.

The question asked for the iterative bidding game was, “suppose you are supplied with a
modern rainwater harvesting technology as orally and pictorially described, how much would
you be willing to pay to fetch a bucket of water from the system?”

3.3 Obtaining Bids and Bidding Mechanism
Among the options available to the study, person to person (thus in-person or personal
interview or face to face) was adopted in this study. The use of interactive computer medium,
mail questionnaire with follow ups, and telephone interview would not be appropriate for this
work as the illiteracy rate as well as the incidence of poverty amongst the people in the area
will not permit an excellent use of these other methods of eliciting information. The
advantages of the face to face method used include increasing engagement and awareness of

5
    Dangbe East has now been divided into Ada East and Dangbe East
6
    see appendix 3 for pictorial description
                                                           6
Journal of Economics and Sustainable Development                                   www.iiste.org
ISSN 2222-1700 (Paper) ISSN 2222-2855 (Online)
Vol.4, No.3, 2013
the respondent or interviewee, simplicity, reduces misunderstanding and makes spontaneous
questions and answers possible.

There are several bidding mechanisms or elicitation mechanisms in determining willingness
to pay. The ‘bidding game iterative method’ was employed by the study in this empirical
work. According to Bateman et al. (1995) the iterative bidding game format and dichotomous
choice CV surveys are of high priority relative to the open ended format which has a high
level of uncertainty. They reiterated that, respondents experience significant uncertainty in
answering open-ended questions and may exhibit free-riding or strategic overbidding
tendencies (although this is less certain) hence the choice of the iterative bidding game format
in this study.

 This method asks the respondent a sequence of questions until the maximum bid is found.
This method was applied by quoting higher amounts to the respondents until the maximum
amount they were willing to pay was reached. However, it may suffer from starting point
bias, and fatigue effects. The weaknesses of this bidding mechanism used by the study have
been taken care of, as a pilot survey was undertaken by the study. A clear amount to start with
was obtained as most of the respondents under the pilot survey gave GH¢0.05 (5 pesewas) as
their starting point amount hence stultifying the problem of starting point biases. The team of
interviewers made the questionnaire administration quite simple and straight forward. This
minimized the severity of fatigue effects on the part of both the interviewer and the
interviewee as this did not influence the validity of the data.


The bidding game iterative method with a starting point amount of GH¢0.050 per 34cm
bucket was used. If the respondent’s answer is ‘yes’ to the bid of GH ¢0.05, then the question
is repeated with a higher bid; if the answer is ‘no’, the question is repeated with a lower bid.
This continues until the respondent’s maximum WTP is reached. Also, ‘Pay as you fetch’
was the bid-vehicle or mode of payment majority of the household heads preferred to express
their WTP when the Iterative Bidding Game Method was applied. It is obvious that these bid
vehicle(s) would best prevent free riders under the method.

3.4 Sample size and Sampling Frame
In order for the respondents to give a true picture of their WTP, the study focused on two
regions with a district each characterized by potable water problems. Based on the relatively
high potable water challenge in the study area, twenty communities which yielded a sample
size of 309 household heads or respondents were used for the study. The communities namely
Tsopoli, Dawa, Sege, Tofluokpo, MatseKope, Hwakpo, Addokope, Kasseh Ada, Ada Foah,
Tojeh, Kpotame, Vume, Tefle, Koji, Sokpoe, Sogakope, Hlevi, Alesikpe, Dabala were
sampled from the districts based on the non proportional stratified sampling method. The
coastal regions were put into strata of four namely Greater Accra, Central, Volta and Western
regions. However, due to the water demands and the incidence of poverty of the districts,
Volta (South Tongu) and the rural/peri-urban part of Greater Accra (Dangbe East) were
selected for the survey. The random sampling within the selected strata was done on-site as
the study sought to avoid pre-selected respondents who may probably not be available at the
                                                   7
Journal of Economics and Sustainable Development                                    www.iiste.org
ISSN 2222-1700 (Paper) ISSN 2222-2855 (Online)
Vol.4, No.3, 2013
time for the administration of the questionnaire by the interviewer. The on-site sampling was
done in houses, offices, shops and markets.

3.5 Model Specification
3.5.1 Ordered Probit (Oprobit) Model
According to Maddala (1983) and Green (2008) responses generated from a survey may not
necessarily be the maximum WTP and that the true WTP may perhaps lie between the
maximum value expressed by the respondent and the next possible highest value. This
suggests that the oprobit model is preferred to multinomial probit model because the former
accounts for the statistical significance between the dependent and the independent variables as
well as the ordinal characteristic of the dependent variable (Duncan et al., 1998).

Lemieux (2012) listed the most common cases of limited dependent variable models, along
with the popular estimators used to estimate these models. Inferring the structural model from
the economic and econometric point of view, the oprobit model is stated as
    y* = α + X 1β1 + ........ X k β k + e …………………………………………….... (5)

The latent variable (WTP*) can therefore be specified as WTPi * = α + X i β + ei . ………….

(6) Where α is the constant parameter,“ X i = X i' ” is a vector showing features of the

household and attributes of the proposed improved rainwater harvesting system, β is the
vector representing the model’s parameters, and ei is error term in the model.


According to Wooldridge (2002), assuming WTP* is the ordered responses taking on the
values {0, 1, 2, 3.......... J }, we can derive the ordered probit as follows: Let R1, R2, ……, RJ

represent the ‘j’ prices which divide the range of willingness to pay space into ‘J+1’
categories and let WTPi be the categorical variable such that;

WTPi = 1 if WTP *i ≥ R1 …………………... (7)


WTPi = 2 if < WTP *i ≥ R2 ………………... (8)


WTPi = 3 if < WTP *i ≥ R3 ………………… (9)

.

.


J + 1 = 1 if R J < WTP *i . …………………… (10)
                                                   8
Journal of Economics and Sustainable Development                                                                           www.iiste.org
ISSN 2222-1700 (Paper) ISSN 2222-2855 (Online)
Vol.4, No.3, 2013
Now WTPi* can be equated to ‘j’, if we assume j=1, 2, 3…, J+1. Therefore

R j −1 < WTP *1 ≤ RJ . ……………………….. (11)

Equation (5) can be substituted into equation 11, to yield

R j −1 < α + X 1β + e1 ≤ RJ . ……………………….. (12).


This can be statistically manipulated to generate series of equations such as
Rj−1 −α< Xiβ +ei ≤Rj −α or            Rj−1 −α − Xiβ <ei ≤ Rj −α − Xiβ .


According to Wooldridge (2002), given that we have J+1 categories, the probability of
household ‘i’ choosing category ‘j’ (=1, 2, 3..., J+1) it can be represented as follows

Pi (1) = Pr(WTPi = 1) = Pr(WTPi * ≤ R1 ) = Pr( X 1β + e ≤ µ1 ) = Pr( ei ≤ µi − X i β )
      = Φ ( µi − X i β )...................................................................................................................(13)

Pi (2) = Pr(WTP = 2) = Pr(R1 < WTP* ≤ R2 ) = Pr(ei ≤ µ2 − X i β ) − Pr(ei ≤ µi − X i β )
               i                  i

       = Φ(µ2 − X i β ) − Φ(µ1 − X i β ).....................................................................................................(14)

Pi (3) = Pr(WTP = 3) = Pr(R2 < WTP* ≤ R3 ) = Pr(ei ≤ µ3 − X i β ) − Pr(ei ≤ µ2 − X i β )
              i                   i

        − Pr(ei ≤ µ1 − X i β ) = Φ( µ3 − X i β ) − Φ( µ2 − X i β ) − Φ(µ1 − X i β ).........
                                                                                           ..........
                                                                                                    .......... 15)
                                                                                                             ......(

Pi ( J ) = Pr(WTP = J ) = Pr( RJ −1 < WTP * ≤ RJ ) = Φ( µ J − X i β ) − Φ( µJ −1 − X i β )..............................(16)
                 i                       i


Pi ( J + 1 ) = Pr( WTP i = J + 1 ) = Pr( WTP i * > R J ) = 1 − Φ ( µ J − X i β )......... .......... ...( 17 )

Given that Φ ( a ) = 1 − Φ ( −a ) , because the normal distribution is symmetric and

µ J = threshold parameters

To obtain ‘β’ and the ‘j’ parameters we maximize the log likelihood function to yield

ln L = 1[WTP = 1] ln[Φ(µ1 − Xβ ) + 1[WTP = 2] + 1[WTP = 3]1n[Φ(µ3 − X i β ) ln[Φ(µ2 − X i β ) − Φ(µ1 − Xβ )] + ...
           i                           i            i

        + 1[WTP = J + 1]1n[1 − Φ(µ j − X i β )]........
              i                                       ..........
                                                               ..........
                                                                        ..........
                                                                                 ..........
                                                                                          ..........
                                                                                                   ..........
                                                                                                            ..........
                                                                                                                     ..........
                                                                                                                              .......... 18)
                                                                                                                                       ....(

                      N J +1
In sum, ln L = ∑∑WTPiJ ln[Φ ( µ j − X i β ) − Φ ( µ j −1 − X i β )]........................................(19)
                      i =1 j =1


3.5.2 Marginal Effect of Ordered Probit Model


                                                                     9
Journal of Economics and Sustainable Development                                                                  www.iiste.org
ISSN 2222-1700 (Paper) ISSN 2222-2855 (Online)
Vol.4, No.3, 2013
The differential of dependent variable WTP with respect to the vector “X” (which shows the
features of the household and attributes of the proposed improved rainwater harvesting
system) presents the marginal effects. The marginal effects show how the probability of each
outcome changes with respect to changes in the explanatory variable.

∂ Pr ob(WTPi = 1 | X)
                      = -Φ ' ( µ1 - X ' β ) β ...........................................................(20)
        ∂X i


∂ Pr ob(WTPi = 2 | X)                  '                    '
                      = [Φ ' ( µ1 - X i β ) − Φ ' ( µ2 − X i β )]β ..............................(21)
        ∂X i


∂ Pr ob(WTPi = 3 | X)                  '                     '                    '
                      = [Φ ' ( µ1 - X i β ) − Φ ' ( µ 2 − X i β ) − Φ ' ( µ3 − X i β )]β ...........(22)
        ∂X i


∂ Pr ob(WTPi = J | X)                     '                     '
                      = [Φ ' ( µ J-1 - X i β ) − Φ ' ( µ J − X i β )]β ....................................(23)
         ∂X i


∂ Pr ob(WTPi = J + 1 | X)                   '
                          = [Φ ' ( µ J - X i β )]β ..........................................................( 24)
         ∂X i

3.5.3 Functional Form of the Model
Binam et al. (2003) indicated that in literature, some authors have concluded that the
willingness-to-pay is influenced by economic characteristics, socio-demographic
characteristics and the characteristics of the good itself (Whittigton et al., 1990; Flores and
Richard, 1997; Bloom and Shenglan, 1999; Atim, 1999; Criel et al., 1999). Binam et al.
(2003), added variables such as age, the level of education, the gender, religion, the family
size, marital status in estimating WTP for community health prepayment scheme in
Cameroon. The model used by Briscoe et al. (1990) in a CV study in Brazil was:

 U ij = α 0 + α1C + α 2V + α 3Y + α 4 Z + ξij ............................................................( 25)

Where U= Utility, C= Monetary costs of obtaining water, V= perceived water quality,
Y= Household income, Z= a set of socioeconomic variables used as proxies for the families
tastes, ξ = the error term. Following the models adopted from Briscoe et al. (1990), and

Binam et al. (2003), WTP depended on some economic and socio-demographic independent
variables. This paper also adopted socio-economic variables based on the environmental good
in question, the kind of people and how they live.

The valuation function used in this research is based on the consumer demand theory.
Therefore, the functional form of the model to be determined is expressed as:
                                                              10
Journal of Economics and Sustainable Development                                                                                          www.iiste.org
 ISSN 2222-1700 (Paper) ISSN 2222-2855 (Online)
 Vol.4, No.3, 2013
   MWTP          = f ( MS , G , Mi , E , Occ                                 , Y , Urwdu               , Pfmt         )........(           26 )

   MWTP            = β   O       + β     1   Ms     + β       2   G    + β     3   Mi    + β       4   E + β      5   Occ          + β       6   Y   +
                   β 7 Urwdu                 + β   8   Pfmt           + µ ..........         ..........    ..........          ....(       27 )

 Where β 0 denotes the constant term in the model, β1 , β 2 , β 3 , β 4 , β 5 ……..and β13 are

 parameter estimates to be estimated using the ordered probit method of estimation. The error
 term ( µ ) is added to the function because the researcher does not observe all components of

 WTP for improved rainwater (Mcfadden, 1974). The WTP is the dependent variable used in
 the model. This deals with the amount that the respondents are willing-to-pay to be
 beneficiaries of clean rainwater. The fundamental principle of WTP is that the preferences of
 individuals must serve as base of evaluation for gains and losses of non-market goods and
 services.
Table 1: Model Variables and their Description
 Variable     Marital         Gender          Occupation of              Educati            Usage of            Preference             Monthly           Household
              Status               of         Respondent by                 on of        Rainwater              of Modern               Income           Population
                   of        Respond                Sector               Respon         for Domestic            Rainwater              Levels of         below 18
              Respon               ent                                      dent        Purpose by              Technique              Respond           Years
                  dent                                                                  Respondent                    by               ent (Gh¢)
                                                                                                            Respondent
Abbreviati    Ms             G                Occ                       Edu             Urdu                Pmrt                        Income           Minors
   ons                                                                                                                                     (Y) in
                                                                                                                                            Gh¢
Description   Dummy          Dummy            Dummy                     Dummy           Dummy               Categorical                Continuo          Categorical
                                                                                                                                            us
Code          Married        Male=1,          Unemployed=               Educate         User=1,             Preferred=1,               Min=0             Min=1
              =1,Othe        Female=          0,                        d =1,           Otherwise=0
              rwise=0        0                Employed=1,               Otherwi                             Otherwise=0                Max=25            Max=5
                                                                        se=0                                                           00
Apriori       +              +/-              +                         +               +                   +                          +                 +/-


 4.0 Analysis of Results
 This section presents the results of the field survey as generated by both the statistical
 software(s) (STATA 11.0 & PASW 18) and researcher’s computation. The descriptive
 statistics show that about 78% of the respondents are willing to harvest rainwater if it should
 rain. About 22% were not interested in rainwater with some giving reasons as they have
 adequate water from the pipe system, their companies supply them pipe water constantly and
 improper roofing sheets like thatched, dirty roof because of excessive dust in the areas and
 asbestos roofs.

 Again, 99% of those who were willing to harvest preferred modern rainwater techniques with
 filters to the old method without filters. Unfortunately, 1% of the respondents were still
                                                                          11
Journal of Economics and Sustainable Development                                   www.iiste.org
ISSN 2222-1700 (Paper) ISSN 2222-2855 (Online)
Vol.4, No.3, 2013
interested in their old method explaining that they are used to the old method and do not know
any possible negative aspect of the modern method. Furthermore, 80% were willing to pay for
the modern method whilst 20% declined willingness to pay citing financial constraints as their
main reason. The factors that determine the respondents’ willingness to pay are presented in
section 4.1.

4.1 Ordered Probit Regression Results

The formulated ordered probit model was able to identify certain socio economic variables
associated with the WTP for improved rainwater.
Table 4.0: Regression Results
Ordered probit regression                                    Number of obs    =          307
                                                             LR chi2(8)       =       153.86
                                                             Prob > chi2      =       0.0000
Log likelihood = -168.68569                                  Pseudo R2        =       0.3132


                 wtp      Coef.     Std. Err.           z   P>|z|    [95% Conf. Interval]

      gender           -.2401295     .184282       -1.30    0.193   -.6013156      .1210566
          ms            .1963758    .1856867        1.06    0.290   -.1675634      .5603151
      minors            .1016446    .0625263        1.63    0.104   -.0209048       .224194
   education           -.3403554    .1928214       -1.77    0.078   -.7182785      .0375676
occupation~y            -.422118    .1851842       -2.28    0.023   -.7850723     -.0591637
      income           -.0010561    .0518607       -0.02    0.984   -.1027012      .1005889
       urwdu           -.6265431    .2513638       -2.49    0.013   -1.119207     -.1338791
        pfmt            2.675478    .2735347        9.78    0.000     2.13936      3.211596

           /cut1       -.1664413    .3318117                        -.8167804      .4838978
           /cut2        3.044125    .3496137                         2.358895      3.729355
           /cut3        3.287359    .3514048                         2.598619        3.9761
           /cut4        3.636773    .3657474                         2.919921      4.353624


Several diagnostic tests were conducted on the model to ascertain the authenticity and
predictive justification of the model. The model presents the log likelihood value of 168.697
which is statistically significant at 1% significance level, suggesting that, model is correctly
specified.

The Likelihood Ratio Index or Pseudo R2 tests the goodness-of-fit of the model. A pseudo R2
value of 0.31 shows how the model explains 31% of variations in the dependent variable. By
this we say the model fits the set of observations. Amoah (2011) explained that “According to
Mitchell and Carson (1989), the R2 of 31% is quite reasonable in that, the reliability
(reproducibility and stability) of CVM can be tested most easily by obtaining a respectable
coefficient of determination (thus R2 ≥0.15 or 15%). This shows how the WTP variable is
influenced by set of independent variables (Arlinghaus and Mehner, 2004)”.

The study also tested for the existence of multicollinearity using the spearman’s correlation
test. The presence of one or more large bivariate correlations with rho coefficient of 0.8 and
0.9 are commonly used cutoffs which indicates strong linear associations, suggesting
collinearity may be a problem (Mason and Perreault, 1991). The results as displayed in
appendix 2b ruled out the presence of severe multicollinearity in the model as the coefficients
of correlation (rho or ρ ) were below the established rule ( ρ <0.8 and 0.9) for all other


7
    Rounded up
                                                   12
Journal of Economics and Sustainable Development                                                 www.iiste.org
ISSN 2222-1700 (Paper) ISSN 2222-2855 (Online)
Vol.4, No.3, 2013
variables. Again, the VIF8 calculation also justified the absence of severe multicollinearity in
the model. Now, the model from the perspective of an entire bundle of independent variables
as well as individual independent variable demonstrates its ability to predict the outcome
variable.

From table 4.0, except marital status (ms) and number of household population under
eighteen years (minors); all the other variables had negative signs. In the results, preference
for modern technology (pfmt) and users/usage of rainwater for domestic purposes (urwdu)
were significant at 1%, occupation was also significant at 5% and, minors as well as education
were significant at 10% levels of significance. Income, gender and ms were however not
significant. According to Hamath et al. (1997), since the utility of preference is an ordinal
measure, the relative magnitude of the coefficients is more important than their absolute
magnitude. The marginal effect results with their categories are shown in table 4.19. The
marginal effects show the relative changes in probabilities of the dependent variable to a unit
change in an explanatory variable say income of respondents. In the case of dummy variables,
the marginal effect of a dummy is the change in the predicted probability for a change in the
variable from start value to end value holding all other variables at their sample mean (Long,
1997).
Table 4.1: Marginal Effect of the Ordered Probit Estimates
    Variable      wtp≤Gh¢0.05         Gh¢0.05<wtp≤Gh¢0.10           Gh¢0.10<wtp≤ Gh¢0.15   wtp>Gh¢0.20
MS                   0.0129           0.0059                    0.0053                            0.0046
Gender              -0.0100          -0.0078                   -0.0073                           -0.0066
Education           -0.0088         -0.0118*                   -0.0112                           -0.0105
Occupatio           -0.0083        -0.0149**                 -0.0143**                          -0.0137**
n
Urwdu            0.0112            -0.0249**                 -0.0251**               -0.0264*
Pfmt         -0.1447****          -0.0830****               -0.0759****            -0.0673****
Minors           0.0055              0.0032*                  0.0029*                 0.0026*
Income          -0.0001              -0.0000                    -.0000                -0.0000
****=1%, ***=5%, **≡10%, *≡15% levels of significance respectively.
NB: The results are approximated to four decimal places. wtp=Willingness-to-pay, Gp=Ghana Pesewas
In discussing the results provided in table 4.1, marital status (ms) is positively related to
willingness-to-pay for improved rainwater in the coastal savannah region of Ghana. This
implies that the unmarried are more willing to pay for improved rainwater than the married.
The probability of paying any amount less or equal to GH¢0.05 is 0.0129; greater than
GH¢0.05 but less or equal to GH¢0.10 is 0.0059; greater than GH¢0.10 but less or equal to
GH¢0.15 is 0.0053; greater than GH¢0.20 is 0.0046. The relationship could be attributed to
the fact that, most of the household heads are males (65%), and for the males who are
married, their domestic water supply responsibility depend mostly on their wives and children
hence the unwillingness of husbands or married category to pay. However, because the
burden of ensuring that there is water at home lies directly on individuals who are not

8
    See appendix 2a for Variance Inflation Factor (VIF) calculation.
9
    See appendix 1b for detailed tables as generated by STATA Version 11.
                                                             13
Journal of Economics and Sustainable Development                                     www.iiste.org
ISSN 2222-1700 (Paper) ISSN 2222-2855 (Online)
Vol.4, No.3, 2013
married, they demonstrated their willingness to pay for the improved rainwater. This has been
supported by a study in Bushenyi (Western Uganda) by Wedgwood and Samson (2003) that
male household heads have control over finances in most developing countries however, the
burden of fetching water lies largely on women and children.

Gender is negatively related to willingness-to-pay for improved rainwater in the coastal
savannah region of Ghana. By implication, the probability of men paying some money in their
bid to obtain improved rainwater is higher than women. The probability of paying any amount
less or equal to GH¢0.05 is 0.0100; greater than GH¢0.05 but less or equal to GH¢0.10 is
0.0078; greater than GH¢0.10 but less or equal to GH¢0.15 is 0.0073; greater than GH¢0.20 is
0.0066. This relationship could be based on the fact that, men are economically empowered in
the cultural settings of Ghana hence expressing higher willingness-to-pay. This has been
supported by World Bank study in 1993 suggesting that gender’s influence on
willingness-to-pay depends largely on the specific cultural settings or context.

The results also show an inverse relationship between income and wtp implying that a unit
increase in income has the probability of decreasing the wtp for improved rainwater. This is
confirmed by the first standard policy paradigm which holds that, rural households especially
in developing countries where the incidence of poverty is very high can pay very little or
nothing out of their income for improved water services (World Bank, 1993). Unfortunately,
income, marital status and gender were not statistically significant at all in this study. Similar
findings where socioeconomic factors were not statistically significant is seen in Soto Montes
de Oca et al. (2003) where gender and family size were not statistically significant and
Gwulyani et al. (2005) where only three variables were statistically significant with variables
like household size, income level, gender of respondent, education level of household
respondent, among others were not statistically significant.

Education exhibited an inverse relationship with wtp for improved rainwater. This suggests
that educated people have a higher probability of paying for improved rainwater relative to
the uneducated. It is generally accepted that an educated person who is informed about
polluted water and its health implication will express a higher willingness to pay than an
uninformed or uneducated person. The probability of paying any amount greater than
GH¢0.05 but less or equal to GH¢0.10 is 0.0118 for this category is significant at about 15%
level of significance.

Occupation of the respondent by sector also shows a negative relationship with wtp. This
implies that those employed (Agricultural, Industrial and Services sectors) are more likely to
express their willingness to pay relative to the unemployed. This is because those employed
are financially better off relative to those who are unemployed. The employed can pay for
services that will improve their welfare as compared to the unemployed. The probability of
paying any amount greater than GH¢0.05 but less or equal to GH¢0.10 is 0.0149. This is
significant at 10% level of significance.

Usage of rainwater for domestic purposes (urwdu) as a variable was negatively related to wtp.
It means that those who use rainwater are expressing a higher probability of paying for
improved rainwater relative to those who do not use rainwater for domestic purposes. This
                                                   14
Journal of Economics and Sustainable Development                                  www.iiste.org
ISSN 2222-1700 (Paper) ISSN 2222-2855 (Online)
Vol.4, No.3, 2013
could be attributed to the modern method which provides filtered water to the unfiltered
traditional method whose quality cannot be guaranteed. In addition to the scarcity of water in
the study area, users of rainwater were interested and expressed a higher probability of paying
for improved rainwater because of the new method and its likely positive effects on their
health. The probability of paying any amount greater than GH¢0.05 but less or equal to
GH¢0.10 is 0.0249. Also, the probability of paying any amount greater than GH¢0.10 but less
or equal to GH¢0.15 is 0.0251. These were significant at 10% level of significance. The
amount less or equal to GH¢0.05 was also positive however, it was not significant.

Also, the number of persons in the household that were eighteen years and below (Minors)
exhibited a positive relationship with the dependent variable implying that, a unit increase in
the number of minors in a household has the probability of increasing the wtp for improved
rainwater. This is particularly true for household heads who appreciate the ordeal the minors
and women go through in ensuring that there is potable water at home for use. The probability
of paying any amount greater than GH¢0.05 but less or equal to GH¢0.10 is 0.0031. This is
significant at 15% level of significance.

Respondent’s preference for modern rainwater harvesting technology or method (Pfmt) shows
that those who said they preferred the modern rainwater technology are less likely to pay for
the modern method as compared to those who declined preference for the modern method and
are still comfortable with their traditional method. This ironic result came about simply
because of fear of financial commitment coupled with failure of their crops within the period
under consideration by majority of respondents who are within the agricultural sector. The
probability of paying any amount less than GH¢0.05 is 0.6223; greater than GH¢0.05 but less
or equal to GH¢0.10 is 0.0391; greater than GH¢0.10 but less or equal to GH¢0.15 is 0.0363;
greater than GH¢0.20 is 0.0344. These values were statistically significant at even 1% level of
significance.

In sum, the determinants of wtp in the ordered probit model revealed three major significant
variables namely Occupation, Usage of rainwater for domestic purposes and Respondent’s
preference for modern rainwater technology.


                                                   15
Journal of Economics and Sustainable Development                                                     www.iiste.org
 ISSN 2222-1700 (Paper) ISSN 2222-2855 (Online)
 Vol.4, No.3, 2013
 Table 4.2: TWTP and Expected Revenue for Clean Rainwater in Ghana Pesewas per
 day
Intervals Freq Mid-WT % of Share of Cumulativ          Number of      TWTP                                        Expected
(***GHP             .          P           HH*       Populati             e        Buckets****       per day      Revenue
    )                      (***GHP          *          on             Population   of water used    (***GHP)       per day
                               )                                                   per day by all                (***GHP)
      A            B            C            D            E               F             G=            H=           I=C×G
                                                                                        F×8           C×E
0-0.05            287         0.025         93.2      196,414          210,786       1,686,288       4,910            42,157

0.06-0.10          7           0.08         2.3         4,791           14,372        114,974         383             9,198

0.11-0.15          5           0.13         1.6         3,422           9,581         76,649          445             9,964

0.16-0.20+         9           0.18         2.9         6,159           6,159         49,275         1,109            8,869

TOTAL             308                      100.0     210,786*                        1,927,186       6,847            70,189

*Ghana Statistical Service, 2010 Population Census after adding the two districts, **HH=Household,
***Gp=Ghana Pesewas, ****Average buckets used per day is from the study is 150 litres (8 Buckets) 10 ,
Willingness-to-Pay= WTP , TWTP =Total WTP
 Source: Author’s Computation, 2012.

 The mean willingness-to-pay for improved rainwater in the two districts was determined by
 dividing the TWTP by the share of population. This yields (6,847÷ 210,786)*30= GH¢0.032
 per day, per person. It is evident in table 4.2 that majority of the population representing
 93.2% were willing to pay GH¢0.025 daily for a bucket of improved rainwater. This same
 amount provides the highest expected revenue of GH¢42,157 per day.

 Quartey (2011) indicated that “According to Kauffman and Pérard, 2007, the Freshwater
 Country Profile of Ghana of the United Nations Organization has indicated that it costs Ghana
 US$0.80 per cubic meter to produce, transport and distribute potable water”. Using freshwater
 case as a proxy, given the two district’s population, the cost of efficient production,
 transportation and distribution of improved rainwater for 210,786 people will yield
 US$168,628.8 per cubic meter (equivalent to Gh¢317,022.14411). It can be said that, barring
 the fact that all the eight buckets used for the computation may not be potable water, the mean
 cost per day can be determined as Gh¢317,022.144 divided by 210,786 which yields
 Gh¢1.504. The difference between the mean wtp value and the mean estimated cost value
 results in a net loss of GH¢1.47 per day.

 An Ordinary Least Square linear regression was used to derive the demand function from the
 distribution provided in table 4.2. This is given as equation 24 and subsequently illustrates the
 curvature of the demand curve which is shown in figure 1.


 10
      The bucket used in the field survey had about 18.75 litres per bucket
 11
      Exchange rate used is $1: ¢1.88
                                                                 16
Journal of Economics and Sustainable Development                                                                  www.iiste.org
ISSN 2222-1700 (Paper) ISSN 2222-2855 (Online)
Vol.4, No.3, 2013


Y = 187047                              . 4 − 1222389             X ..........      ..........   24
SE  = ( 74301                              . 7 ) ( 626992         .2 )
t =  [ 2 . 51 ]                                  [ − 1 . 95   ]
    2
R       =          66               %


Figure 1.0: DEMAND CURVE FOR IMPROVED RAINWATER

                                                     Series1, 6159, 0.18
            Willingness-to-Pay in
                 Ghana Cedis


                                                                                  Series1, 9581, 0.13


                                                                                                        Series1, 14372, 0.08

                                                                                                                  Series1, 210,786,
                                                                                                                        0.025
                                                                                 Population

Author’s Field Work (2012)
The demand curve in figure 1, shows the inverse relationship between the dependent variable
and the independent variable as exists in economic theory. The demand curve confirms the
findings of the study that most of the people in the study area are prepared to pay GH¢0.25 for
a 34cm container of improved rainwater. This has been observed to be very high considering
their current cost of pipe-borne water as GH¢0.05 and GH¢0.10 which is mostly unavailable.
The study realized that except for the incidence of poverty in the study area, the bid would
have been higher.

5.0 Conclusion and Policy Recommendations

In order to achieve the MDGs, the water supply crisis confronting the coastal savanna region
of Ghana affecting domestic and agricultural uses need urgent attention since water should not
be trivialized. The problem is central to most economic activities and the livelihood of the
people in the study area. It is recommended that the government intervenes in addressing this
problem since it has a multiplier effect on the national economy.

The improved rainwater harvesting system introduced to the people has been accepted by
majority of the respondents with a very high demand. However, intensive education and
awareness programmes to introduce government policies and plans on rainwater are required
on sustainable basis.

The acceptance of improved rainwater harvesting system should not be seen as an alternative
source of water supply but one which complements the pipe water supply system. This is
because the annual rainfall for the coastal savanna areas is woefully inadequate for absolute
reliance on rainwater.


                                                                          17
Journal of Economics and Sustainable Development                                                     www.iiste.org
ISSN 2222-1700 (Paper) ISSN 2222-2855 (Online)
Vol.4, No.3, 2013
Private direct investment is not strongly recommended for rainwater harvesting in poor areas
like the coastal savanna region of Ghana because the recovery of investment will be very low
due to the incidence of poverty. Some form of government intervention is required to enable
the communities buy into the idea of adopting the new system.

Lastly, existing pipe-borne water supply system imposes additional cost to residents instead
of assisting them. They are made to pay exorbitant prices for water sold to them by a few
unscrupulous people who have monopoly over the existing sources. This situation is unfair,
and the Ghana Water Company must be encouraged to improve the water delivery throughout
the communities to alleviate their suffering.

Acknowledgement: This study was made possible under the Exceed Guest Chair, Professor Dr. Clement
Dorm-Adzobu of ISW-TU Braunschweig through the financial support of DAAD and BMZ in Germany. My

special thanks to Prof. Dr., Ali Müfit Bahadir, Prof. Dr. Haarstrick Andreas, Prof. Dr Ulrich Menzel, Dr Basten Loges

for their support.


References

     1. Amoah, A. (2011) Determinants Of Willingness-To-Pay (Wtp) for The Restoration
        and Maintenance of Korle Lagoon in Accra, Ghana Journal of Business Research, Vol.
        5 Issues 1 & 2, 2011
     2. Arlinghaus and Mehner, (2004), Fisheries Management and Ecology, Blackwell
        Publishing Ltd., Berlin, Germany, pp 61-64.
     3. Asante, K. B. Daily Graphic, 14th December 2009 09:16:15 accessed @
        http://www.graphicghana.com/dailygraphic/page.php?news=5660
     4. Asenso-Okyere, W. K., Osei-Akoto, I. and Appiah, E. N. (1997), ―Willingness to pay
          for Health Insurance in a developing economy. A pilot study of the informal sector of
          Ghana using contingent valuationǁ, Health Policy, Vol. 42, pp. 223-237.
     5. Asfaw, A., Gustafsson-Wright, E. and van der Gaag, J. (2008), ―Willingness to pay
        for Health Insurance: An Analysis of Potential Market for New Low Cost Health
        Insurance Products in Namibiaǁ, AIID RS 08-01/2.
     6. Atim, C., (1999), Social movements and health insurance: a critical evaluation of
          voluntary, non-profit insurance schemes with case studies from Ghana and Cameroon.
          Social Science and Medicine 48, 881-896.
     7. Bateman, I. J., Langford, I. H., Turner, K., Willis, K. G., & Garrod, G. D. (1995).
        Elicitation and truncation effects in contingent valuation studies. Ecological
        Economics, 12, 161-179
     8. Bateman, I.J. and Turner, R.K. (1993) Valuation of the environment, methods and
          techniques: The contingent valuation method, in Turner R.K. (ed.) Sustainable


                                                         18
Journal of Economics and Sustainable Development                                    www.iiste.org
ISSN 2222-1700 (Paper) ISSN 2222-2855 (Online)
Vol.4, No.3, 2013
        Environmental Economics and Management: Principles and Practice, Belhaven Press,
        London, pp120-191.
    9. Bateman, I.J., Willis, K.G. and Garrod, G.D. (1994) Consistency between contingent
       valuation estimates: A comparison of two studies of UK National Parks, Regional
        Studies, 28 (5): 457-474.
    10. Bateman, Ian J. and Turner, R. Kerry. (1995). “Valuation of the Environment,
        Methods and Techniques: The Contingent Valuation Method”, in Turner (ed).
        Sustainable Environmental Economics and Management: Principles and Practice,
        England: J Wiley.
    11. Batmanghelidj F. MD, (2009) accessed at
        http://www.health-benefit-of-water.com/benefit-of-drinking-water.html
    12. Binam Joachim Nyemeck, Nkama Arsène and Nkendah Robertn (2003), ‘Estimating
        the willingness to pay for community health prepayment schemes in rural area’: A
        case study of the use of contingent valuation surveys in centre Cameroon. University
        of Yaoundé II, Faculty of Economic Sciences and Management. pp 1-25.
    13. Birol E, Koundouri P, Koundouri Y(2007) Farmers’ Demand for Recycled
        Wastewater in Cyprus: A Contingent Valuation Approach, Environmental Economy
        and Policy Resaerch, University of Cambridge, Discussion Paper No:24. USA
    14. Birol, E., and Das, S. (2010) Estimating the value of improved wastewater treatment:
        The case of River Ganga, India, Journal of Environmental Management 91 (2010)
        2163-2171
    15. Birol, E.; Das, S. and Bhattacharya, N. R.(2009) Estimating the value of improved
        wastewater treatment: The case of River Ganga, India. Environmental Economy and
        Policy Resaerch, University of Cambridge, Discussion Paper No:43.2009
    16. Black, R (June, 06,2007)Global Demand for Water to Grow, accessed at
        seekingalpha.com/article/37467-global-demand-for-water-expected-to-grow
    17. Bloom, G., Shenglan, T., (1999). Rural Health Prepayment Schemes in China: towards
        a more active role for government. Social Science and Medicine 48, 951-960.
    18. Briscoe, J., Furtado de Castro, P., Griffen, C., North, J., Oslen, O., (1990) Towards
        Equitable and Sustainable Rural Water Supplies: A contingent Valuation Study in
        Brazil, World Bank Economic Review, Vol. 4. no.2. pp:115-134.
    19. Cameron, C. and Trivedi K. P. (2005) Microeconometrics: Methods and Applications,
        Cambridge University Press, New York, United States of America
    20. Cameron, T.A. 1991. Combining Contingent Valuation and Travel Cost Data for the V
        aluation of Nonmarket Goods. Land Economics. 68(3):302‐17.
    21. Criel, B., Van der Stuyft, P., Van Lerberghe, W., (1999). The Bwamanda hospital
        insurance scheme: effective for whom? A Study of Its Impact on Hospital Utilization
        Patterns. Social Science and Medicine 48, 897-911.
                                                   19
Journal of Economics and Sustainable Development                                   www.iiste.org
ISSN 2222-1700 (Paper) ISSN 2222-2855 (Online)
Vol.4, No.3, 2013
    22. Cummings, R. G., Schulze W. D., Gerking, S. D., and Brookshire, D. S. (1986),
        ―Measuring the elasticity of substitution of wages for municipal infrastructure: A
        comparison of the survey and wage hedonic approachesǁ, Journal of Environmental
        Economics and Management, Vol. 13 No. 3, pp. 269-276.
    23. Duncan C. S., Khattak A. J., and Council F. M. (1998), ―Applying the Ordered
        Probit Model to Injury Severity in Truck-Passenger Car Rear-End Collisionsǁ,
        Transportation Research Record, 1635, Paper No. 98-1237.
    24. Flores, N.E. and Richard, T.C. (1997). The Relationship between the Income
        Elasticities of demand and Willingness to Pay. Journal of environment Economics and
        Management 33(3), 287-95.
    25. Ghana Poverty Reduction Strategy (GPRS,2003-2006), Government of Ghana
    26. Gleick, P.H (1996) Basic Water requirements for Human Activities: Meeting Basic
        Needs. Water International, Vol.21, No. 2, pp. 83-92
    27. Gramlich, F.W (1977) The Demand for Clean Water the case of Charles River,
        National Tax Journal 30(2):183-194
    28. Greene, W.H. (2008), Econometrics Analysis, Sixth Edition, New Jersey: Prentice
        Hall.
    29. Gulyani, S. Talukdar, D and Kariuki, M. R. (2005) Water for the Urban Poor: Water
        Markets, Household Demand, and Service Preferences in Kenya, Water Supply and
        Sanitation Sector Board Discussion Paper Series N o. 5
    30. Haab, T.C. 1998. Estimation Using Contingent Valuation Data from a ‘Dichotomous
        Choice with Follow‐Up’ Questionnaire: A Comment. Journal of Environmental
        Economics and Management 35: 190‐94.
    31. Hamath, A.S., M.D. Faminov, G.V. Johnson, and G. Crow (1997), ‘Estimating the
        values of cattle characteristics using an ordered probit model’, American Journal of
        Agricultural Economics 79: 463–476.
    32. Hanley, N. and Spash, C.L., (1993): Cost Benefit Analysis and the Environment.
        Aldershot: Elgar Publishing Limited.
    33. Holden, S.T. and Shiferaw, B. (2002). Poverty and Land Degradation : Peasants
        ‘Willingness to Pay to Sustain Land Productivity. In C. B. Barrett, F. M. Place, and A.
        A. Aboud (eds.), Natural Resource Management in African Agriculture:
        Understanding and Improving Current Practices. CABI Publishing in Association with
        International Centre for Research in Agroforestry, Oxon and New York.
    34. Khorshiddoust, A.M (2004) Contingent Valuation in Estimating the Willingnes to Pay
        for Environmental Conservation in Tabriz, Iran, Environmental Studies
        No.36accesed@ journals.ut.ac.ir
    35. Lancaster, K.J. (1966), ―A New Approach to Consumer Theoryǁ, Journal of Urban
        Economics, Vol. 74, pp. 132-157.
                                                   20
Journal of Economics and Sustainable Development                                  www.iiste.org
ISSN 2222-1700 (Paper) ISSN 2222-2855 (Online)
Vol.4, No.3, 2013
    36. Lemieux, T (May, 2012) Econ 594: Lecture#6, Department of Economics, University
        of British Colombia.
    37. Long, J. S. (1997), Regression Models for Categorical and Limited Dependent
        Variables. Advanced Techniques in the Social Sciences, Vol. 7, California: SAGE
        Publications, Inc.
    38. Love, P(1999)Water Resources: Meeting Future Demand, Foresight Journal        Volume
        1, Issue 3,pg 275-278
    39. Luce, R. (1959), Individual Choice Behavior: a Theoretical Analysis. New York:
        Wiley
    40. Maddala, G. S. (1983), Limited-Dependent and Qualitative Variables in Economics,
        New York: Cambridge University Press, pp. 257-91
    41. Mashood, Jemila; Ampadu-Boakye, Joseph & Nii Odai Anidaso Laryea
        (2011)Rainwater Harvesting (RWH) as a Complementary Approach to Improving
        Water Supply in Ghana, 3rd Ghana Water Forum, Accra, Ghana, 2011;accessed@
        http://ghanawaterforum.org
    42. Mason, H.C. and Perreault, D.W. Jr. (1991) Collinearity, Power, and Interpretation of
        Multiple Regression Analysis, Journal of Marketing Research, Vol. 28, No.3
        (Aug.,1991),270.
    43. McFadden, D. (1974), "Conditional Logit Analysis of Qualitative Choice Behavior."
        Frontiers in Econometrics, ed. by P. Zarembka, Academic Press, New York.
    44. McFadden, D. (1995) Computing Willingness-To-Pay in Random Utility Models,
        Department of Economics, University of California, Berkeley.
    45. Melby, P. (2006), Rainwater Harvesting for Potable Water Use, Department of
        Landscape Architecture. Accessed@
        http://fwrc.msstate.edu/housing/images/potable.pdf
    46. Merrett, S. (2002), ‘Deconstructing Households’ Willingness-to-pay for Water in
        Low-income Countries’, Water Policy 4, 157–172
    47. Mitchell, R.C. and Carson R. T. (1989). Using surveys to value public goods: the
        contingent valuation method. Washington, D.C.: Resources for the Future.
    48. Nsiah-Gyabaah, K(2002), The Looming National Dilemma of Water Crisis in Peri
        Urban Areas in Ghana, accessed at http/www.gg.rhul.ac.uk/kumasi/Project_
        Related_Papers/ Cedar_IRNR/Paper_7/3/3.html
    49. Porto, M (2004) Human Health and Sanitation; Water and Ethics; Vol.:Essay 6,
        United Nations Educational, Scintific and Cultural Organisation, France.
    50. Quartey, J.D. (2011) Towards a Sustainable Allocation of Potable Water in Ghana:
        Evidence from Kumasi Ministry of Water Resources, Works and Housing, Ghana
        Water Journal Forum 1st Edition, Pg 194.


                                                   21
Journal of Economics and Sustainable Development                                  www.iiste.org
ISSN 2222-1700 (Paper) ISSN 2222-2855 (Online)
Vol.4, No.3, 2013
    51. Schmidt, M. and Murphy, K. (2010) Proceedings of the 13th International Conference
        on Artificial Intelligence and Statistics (AISTATS), Chia Laguna Resort, Sardinia,
        Italy. Volume 9 of JMLR: W&CP 9.
    52. Shutz, S.D.,Lindsay,B.E. (1990). The Willingness to pay for groundwater protection,
        Water Resources Research, 20(2):1869-75
    53. Siabi W.K, Van-Ess RKD, Engmann C, Mensah T, Tagoe M. (Sept. 2008) Rainwater
        Harvesting, Last Water Supply Option for Small Communities and Institutions in
        Difficult Hydro-geological Formations. www. cwsagh. Org / downloads / rainwater _
        harvesting.pdf. Accessed on 13th Oct., 2012.
    54. Smith, V.K., (1992). Non-market Valuation of Environmental Resources an
        interpretative essay in Bateman I.J., and Turner, R.K., (1992) Evaluation of the
        Environment: The Contingent Valuation Method, CSERGE Working Paper GEC
        92-18.
    55. Soto Monte de Oca, G., Bateman, J.I.,Tinch,R., and Moffatt G.P (2003) Assessing the
        Willingness to Pay for Maintained and Improved Water Supplies in Mexico City, The
        Centre for Social and Economic Research on the Global Environment (CSERGE)
        Working Paper ECM 03-11
    56. Turner, R.K., Bateman, I.J. and Pearce, D.W. (1992). United Kingdom. In. Navrud, S.
        (ed) Valuing the Environment: The European Experience, Scandinavian University
        Press, Oslo.
    57. Wedgewood, A. and Samson, K. (2003) Willingness-to-pay Survey-A Streamlined
        Approach; Water, Engineering and Development Center, Loughborough University,
        UK.
    58. Whittington, D. (1998), ‘Administering Contingent Valuation Questions in
        Developing Countries’,World Development 26(1), 21–30.
    59. Whittington, D., Briscoe, J., Mu, X., Barron, W., (1990). Estimating the Willingness
        to pay for Water Services in Developing Countries: A Case Study of Contingent
        Valuation Surveys in Southern Haiti. Economic Development and Cultural Change in
        Binam Joachim Nyemeck, Nkama Arsène and Nkendah Robertn (2003), ‘Estimating
        the willingness to pay for community health prepayment schemes in rural area’: A
        case study of the use of contingent valuation surveys in centre Cameroon. University
        of Yaoundé II, Faculty of Economic Sciences and Management. pg 1-25.
    60. Wooldridge J.M. (2002), Econometric Analysis of Cross Section and Panel Data,
        Massachusetts: MIT Press.
    61. World Bank (Water Demand Research Team, Jan. 1993) The Demand for Water in
        Rural Areas: Determinants and Policy Implications, The World Bank Research
        Observer, vol.8, No. 1, pp. 47-70.


                                                   22
Journal of Economics and Sustainable Development                                    www.iiste.org
ISSN 2222-1700 (Paper) ISSN 2222-2855 (Online)
Vol.4, No.3, 2013


           Appendix 1a
Marginal effects after oprobit
      y = Pr(wtp==1) (predict, outcome(1))
         = .88738422

variable        dy/dx    Std. Err.     z     P>|z|   [    95% C.I.   ]      X

  gender*    -.0100208    .00909     -1.10   0.270    -.02783   .007788   .648208
      ms*     .0129661    .01574      0.82   0.410    -.01789   .043822    .67101
  minors      .0055184    .00458      1.20   0.228   -.003459   .014496   2.41368
educat~n*    -.0088277    .01032     -0.86   0.392   -.029053   .011398   .736156
occupa~y*    -.0082737    .01298     -0.64   0.524    -.03371   .017163   .732899
  income     -.0000573    .00282     -0.02   0.984   -.005577   .005463   2.07166
   urwdu*     .0112204    .02848      0.39   0.694   -.044601   .067042   .827362
    pfmt*     .6222925    .06653      9.35   0.000    .491889   .752696   .801303

(*) dy/dx is for discrete change of dummy variable from 0 to 1


Appendix 1d
Marginal effects after oprobit
      y = Pr(wtp==2) (predict, outcome(2))
         = .01664986

variable        dy/dx    Std. Err.     z     P>|z|   [    95% C.I.   ]      X

  gender*    -.0078496    .00668     -1.18   0.240   -.020936   .005237   .648208
      ms*     .0058523    .00553      1.06   0.290   -.004984   .016689    .67101
  minors      .0031676    .00216      1.47   0.143   -.001066   .007401   2.41368
educat~n*     -.011776    .00812     -1.45   0.147   -.027685   .004133   .736156
occupa~y*      -.01493    .00846     -1.76   0.078   -.031521   .001661   .732899
  income     -.0000329    .00162     -0.02   0.984   -.003201   .003135   2.07166
   urwdu*    -.0249145    .01387     -1.80   0.072   -.052099    .00227   .827362
    pfmt*     .0390957    .01222      3.20   0.001    .015138   .063054   .801303

(*) dy/dx is for discrete change of dummy variable from 0 to 1


Appendix 1e
Marginal effects after oprobit
      y = Pr(wtp==3) (predict, outcome(3))
         = .01327614

variable        dy/dx    Std. Err.     z     P>|z|   [    95% C.I.   ]      X

  gender*    -.0073199    .00636     -1.15   0.250   -.019782   .005143   .648208
      ms*     .0053201    .00503      1.06   0.290   -.004543   .015183    .67101
  minors      .0029086    .00202      1.44   0.149   -.001046   .006863   2.41368
educat~n*    -.0111894    .00806     -1.39   0.165   -.026981   .004603   .736156
occupa~y*    -.0143187    .00851     -1.68   0.092   -.030998    .00236   .732899
  income     -.0000302    .00148     -0.02   0.984   -.002939   .002878   2.07166
   urwdu*    -.0250706      .015     -1.67   0.095   -.054479   .004337   .827362
    pfmt*      .036289    .01256      2.89   0.004    .011675   .060902   .801303

(*) dy/dx is for discrete change of dummy variable from 0 to 1


Appendix 1f
Marginal effects after oprobit
      y = Pr(wtp==4) (predict, outcome(4))
         = .00933788

variable        dy/dx    Std. Err.     z     P>|z|   [    95% C.I.   ]      X

  gender*    -.0066189    .00601     -1.10   0.271   -.018394   .005156   .648208
      ms*     .0045871    .00433      1.06   0.290   -.003907   .013081    .67101
  minors      .0025516    .00177      1.44   0.149   -.000911   .006014   2.41368
educat~n*    -.0104952    .00783     -1.34   0.180   -.025839   .004849   .736156
occupa~y*    -.0136909    .00855     -1.60   0.109   -.030446   .003064   .732899
  income     -.0000265     .0013     -0.02   0.984   -.002578   .002525   2.07166
   urwdu*    -.0264146    .01773     -1.49   0.136   -.061168   .008338   .827362
    pfmt*     .0343508     .0127      2.71   0.007    .009462    .05924   .801303

(*) dy/dx is for discrete change of dummy variable from 0 to 1


                                                     23
Journal of Economics and Sustainable Development                                                                     www.iiste.org
ISSN 2222-1700 (Paper) ISSN 2222-2855 (Online)
Vol.4, No.3, 2013
                                                  Appendix 2: Diagnostic Test

Appendix 2a

•      Multicollinearity with Variance Inflation Factor(VIF)

                                                                                                              12
VIF=1/tolerance, where tolerance is 1-R2=1-0.31=0.69. VIF=1/0.69=1.45 or 1.5.                                      “where R 2 is
                                                                                                                            j


the coefficient of determination of a regression of explanator j on all the other explanators. A
tolerance of less than 0.20 or 0.10 and/or a VIF of 5 or 10 and above indicates a
multicollinearity problem (but see O'Brien 2007)”

Appendix 2b

•      Spearman’s Correlation Test
. spearman gender ms minors education occupation income urwdu pfmt, stats(rho obs p)


      Key

      rho
      Number of obs
      Sig. level

                     gender       ms    minors educat~n occupa~n       income    urwdu      pfmt

        gender       1.0000
                        307


               ms    0.2101    1.0000
                        307       307
                     0.0002

        minors       0.0953    0.0330   1.0000
                        307       307      307
                     0.0956    0.5651

      education      0.2555    0.0213   -0.0689    1.0000
                        307       307       307       307
                     0.0000    0.7106    0.2284

     occupation     -0.0131   -0.0467   -0.0626    0.1731    1.0000
                        307       307       307       307       307
                     0.8198    0.4154    0.2740    0.0023

        income       0.1737    0.2688   0.0164     0.0621    0.0333    1.0000
                        307       307      307        307       307       307
                     0.0023    0.0000   0.7749     0.2783    0.5611

            urwdu   -0.0477    0.0837   0.0979    -0.0388   -0.0420    0.0103   1.0000
                        307       307      307        307       307       307      307
                     0.4046    0.1434   0.0867     0.4983    0.4634    0.8580

             pfmt    0.0092    0.0162   0.0887    -0.0017   -0.0239    0.0402   0.5069    1.0000
                        307       307      307        307       307       307      307       307
                     0.8719    0.7776   0.1211     0.9756    0.6771    0.4833   0.0000


.


Appendix 3


            a. Traditional Rainwater Facility                              b. Modern Rainwater Facility


Source: Janette Worm and Tim van Hattum. “Rainwater harvesting for domestic use”: Agromisa Foundation and CTA, Wageningen, 2006.


12
     http://en.wikipedia.org/wiki/Multicollinearity
                                                                  24
This academic article was published by The International Institute for Science,
Technology and Education (IISTE). The IISTE is a pioneer in the Open Access
Publishing service based in the U.S. and Europe. The aim of the institute is
Accelerating Global Knowledge Sharing.

More information about the publisher can be found in the IISTE’s homepage:
http://www.iiste.org


                               CALL FOR PAPERS

The IISTE is currently hosting more than 30 peer-reviewed academic journals and
collaborating with academic institutions around the world. There’s no deadline for
submission. Prospective authors of IISTE journals can find the submission
instruction on the following page: http://www.iiste.org/Journals/

The IISTE editorial team promises to the review and publish all the qualified
submissions in a fast manner. All the journals articles are available online to the
readers all over the world without financial, legal, or technical barriers other than
those inseparable from gaining access to the internet itself. Printed version of the
journals is also available upon request of readers and authors.

IISTE Knowledge Sharing Partners

EBSCO, Index Copernicus, Ulrich's Periodicals Directory, JournalTOCS, PKP Open
Archives Harvester, Bielefeld Academic Search Engine, Elektronische
Zeitschriftenbibliothek EZB, Open J-Gate, OCLC WorldCat, Universe Digtial
Library , NewJour, Google Scholar

Weitere ähnliche Inhalte

Was ist angesagt?

Water availability: global and indian scenarios
Water availability: global and indian scenariosWater availability: global and indian scenarios
Water availability: global and indian scenariosMuneer A
 
Consumers' willingness to pay for improved water services in ilorin metropoli...
Consumers' willingness to pay for improved water services in ilorin metropoli...Consumers' willingness to pay for improved water services in ilorin metropoli...
Consumers' willingness to pay for improved water services in ilorin metropoli...Alexander Decker
 
Rainwater Harvesting Technologies in Makueni County, Kenya
Rainwater Harvesting Technologies in Makueni County, KenyaRainwater Harvesting Technologies in Makueni County, Kenya
Rainwater Harvesting Technologies in Makueni County, Kenyainventy
 
Assessing the availability of community water at Madlangamphisi, a community ...
Assessing the availability of community water at Madlangamphisi, a community ...Assessing the availability of community water at Madlangamphisi, a community ...
Assessing the availability of community water at Madlangamphisi, a community ...Agriculture Journal IJOEAR
 
Issues, Challenges and Opportunities for Making India zero Water Waste
Issues, Challenges and Opportunities for Making India zero Water WasteIssues, Challenges and Opportunities for Making India zero Water Waste
Issues, Challenges and Opportunities for Making India zero Water WasteJIT KUMAR GUPTA
 
Increased water scarcity is fundamentally a problem of management
Increased water scarcity is fundamentally a problem of managementIncreased water scarcity is fundamentally a problem of management
Increased water scarcity is fundamentally a problem of managementGuYing van Bommel
 
Ribordy, Kelley Growing to the Last Drop- Issue in Brief
Ribordy, Kelley Growing to the Last Drop- Issue in BriefRibordy, Kelley Growing to the Last Drop- Issue in Brief
Ribordy, Kelley Growing to the Last Drop- Issue in BriefKelley Phillips
 
Can it be done? Feeding 9 Billion People without Destroying the Planet
Can it be done? Feeding 9 Billion People without Destroying the PlanetCan it be done? Feeding 9 Billion People without Destroying the Planet
Can it be done? Feeding 9 Billion People without Destroying the PlanetWater, Land and Ecosystems (WLE)
 
A Statistical Analysis of Consumer’s Willingness to Pay for Improved Water Su...
A Statistical Analysis of Consumer’s Willingness to Pay for Improved Water Su...A Statistical Analysis of Consumer’s Willingness to Pay for Improved Water Su...
A Statistical Analysis of Consumer’s Willingness to Pay for Improved Water Su...IJRAT
 
DRAFT - NRW IN THE GLOBAL SOUTH - RICHARD ATKINSON
DRAFT - NRW IN THE GLOBAL SOUTH - RICHARD ATKINSONDRAFT - NRW IN THE GLOBAL SOUTH - RICHARD ATKINSON
DRAFT - NRW IN THE GLOBAL SOUTH - RICHARD ATKINSONRichard Atkinson
 
State of urban water supply
State of urban water supplyState of urban water supply
State of urban water supplyVinayakMehta5
 
Improving Land and Water Management: Creating a Sustainable Food Future, Inst...
Improving Land and Water Management: Creating a Sustainable Food Future, Inst...Improving Land and Water Management: Creating a Sustainable Food Future, Inst...
Improving Land and Water Management: Creating a Sustainable Food Future, Inst...World Resources Institute (WRI)
 
Future of water An initial perspective by Daniel Lambert and Michael O'Neill...
Future of water  An initial perspective by Daniel Lambert and Michael O'Neill...Future of water  An initial perspective by Daniel Lambert and Michael O'Neill...
Future of water An initial perspective by Daniel Lambert and Michael O'Neill...Future Agenda
 
Implications of Household (Domestic) Use of Hard water on Molepolole Residents
Implications of Household (Domestic) Use of Hard water on Molepolole ResidentsImplications of Household (Domestic) Use of Hard water on Molepolole Residents
Implications of Household (Domestic) Use of Hard water on Molepolole Residentskoketso Kanekane
 
The water gap state of water report
The water gap state of water reportThe water gap state of water report
The water gap state of water reportVinayakMehta5
 

Was ist angesagt? (19)

Water availability: global and indian scenarios
Water availability: global and indian scenariosWater availability: global and indian scenarios
Water availability: global and indian scenarios
 
Consumers' willingness to pay for improved water services in ilorin metropoli...
Consumers' willingness to pay for improved water services in ilorin metropoli...Consumers' willingness to pay for improved water services in ilorin metropoli...
Consumers' willingness to pay for improved water services in ilorin metropoli...
 
Rainwater Harvesting Technologies in Makueni County, Kenya
Rainwater Harvesting Technologies in Makueni County, KenyaRainwater Harvesting Technologies in Makueni County, Kenya
Rainwater Harvesting Technologies in Makueni County, Kenya
 
Water and agriculture threats and opportunities
Water and agriculture threats and opportunitiesWater and agriculture threats and opportunities
Water and agriculture threats and opportunities
 
Assessing the availability of community water at Madlangamphisi, a community ...
Assessing the availability of community water at Madlangamphisi, a community ...Assessing the availability of community water at Madlangamphisi, a community ...
Assessing the availability of community water at Madlangamphisi, a community ...
 
WATER : THE BIGGEST BUSINESS RISK FOR INDIA, INC.
WATER : THE BIGGEST BUSINESS RISK FOR INDIA, INC.WATER : THE BIGGEST BUSINESS RISK FOR INDIA, INC.
WATER : THE BIGGEST BUSINESS RISK FOR INDIA, INC.
 
Issues, Challenges and Opportunities for Making India zero Water Waste
Issues, Challenges and Opportunities for Making India zero Water WasteIssues, Challenges and Opportunities for Making India zero Water Waste
Issues, Challenges and Opportunities for Making India zero Water Waste
 
Increased water scarcity is fundamentally a problem of management
Increased water scarcity is fundamentally a problem of managementIncreased water scarcity is fundamentally a problem of management
Increased water scarcity is fundamentally a problem of management
 
Ribordy, Kelley Growing to the Last Drop- Issue in Brief
Ribordy, Kelley Growing to the Last Drop- Issue in BriefRibordy, Kelley Growing to the Last Drop- Issue in Brief
Ribordy, Kelley Growing to the Last Drop- Issue in Brief
 
Can it be done? Feeding 9 Billion People without Destroying the Planet
Can it be done? Feeding 9 Billion People without Destroying the PlanetCan it be done? Feeding 9 Billion People without Destroying the Planet
Can it be done? Feeding 9 Billion People without Destroying the Planet
 
Environment News Service
Environment News Service Environment News Service
Environment News Service
 
A Statistical Analysis of Consumer’s Willingness to Pay for Improved Water Su...
A Statistical Analysis of Consumer’s Willingness to Pay for Improved Water Su...A Statistical Analysis of Consumer’s Willingness to Pay for Improved Water Su...
A Statistical Analysis of Consumer’s Willingness to Pay for Improved Water Su...
 
DRAFT - NRW IN THE GLOBAL SOUTH - RICHARD ATKINSON
DRAFT - NRW IN THE GLOBAL SOUTH - RICHARD ATKINSONDRAFT - NRW IN THE GLOBAL SOUTH - RICHARD ATKINSON
DRAFT - NRW IN THE GLOBAL SOUTH - RICHARD ATKINSON
 
State of urban water supply
State of urban water supplyState of urban water supply
State of urban water supply
 
Improving Land and Water Management: Creating a Sustainable Food Future, Inst...
Improving Land and Water Management: Creating a Sustainable Food Future, Inst...Improving Land and Water Management: Creating a Sustainable Food Future, Inst...
Improving Land and Water Management: Creating a Sustainable Food Future, Inst...
 
Future of water An initial perspective by Daniel Lambert and Michael O'Neill...
Future of water  An initial perspective by Daniel Lambert and Michael O'Neill...Future of water  An initial perspective by Daniel Lambert and Michael O'Neill...
Future of water An initial perspective by Daniel Lambert and Michael O'Neill...
 
Implications of Household (Domestic) Use of Hard water on Molepolole Residents
Implications of Household (Domestic) Use of Hard water on Molepolole ResidentsImplications of Household (Domestic) Use of Hard water on Molepolole Residents
Implications of Household (Domestic) Use of Hard water on Molepolole Residents
 
The water gap state of water report
The water gap state of water reportThe water gap state of water report
The water gap state of water report
 
Ajay5
Ajay5Ajay5
Ajay5
 

Ähnlich wie Application of contingent valuation method (cvm) in

Effectiveness of drip irrigation in enhancing smart farming: a micro-study in...
Effectiveness of drip irrigation in enhancing smart farming: a micro-study in...Effectiveness of drip irrigation in enhancing smart farming: a micro-study in...
Effectiveness of drip irrigation in enhancing smart farming: a micro-study in...AkashSharma618775
 
5. Bhungroo: Water Management solutions to support diversified cropping syste...
5.	Bhungroo: Water Management solutions to support diversified cropping syste...5.	Bhungroo: Water Management solutions to support diversified cropping syste...
5. Bhungroo: Water Management solutions to support diversified cropping syste...World Agroforestry (ICRAF)
 
Impacts of climate change on agriculture
Impacts of climate change on agricultureImpacts of climate change on agriculture
Impacts of climate change on agricultureCarmen Capriles
 
Rain water harvesting & community based flood mapping plan of action
Rain water harvesting & community based flood mapping plan of actionRain water harvesting & community based flood mapping plan of action
Rain water harvesting & community based flood mapping plan of actionKnnt Thein
 
The Effects of Shifting Irrigation on Community Livelihoods and Environmental...
The Effects of Shifting Irrigation on Community Livelihoods and Environmental...The Effects of Shifting Irrigation on Community Livelihoods and Environmental...
The Effects of Shifting Irrigation on Community Livelihoods and Environmental...CrimsonpublishersMCDA
 
Ben Starr_AHA Paper_Final
Ben Starr_AHA Paper_FinalBen Starr_AHA Paper_Final
Ben Starr_AHA Paper_FinalBen Starr
 
Just Add Water: Approaches to Smart Agricultural Water Management
Just Add Water: Approaches to Smart Agricultural Water ManagementJust Add Water: Approaches to Smart Agricultural Water Management
Just Add Water: Approaches to Smart Agricultural Water ManagementICARDA
 
ANDREWS S 2015 Water Risk publ RISI Dec 2015 SA
ANDREWS S 2015 Water Risk publ RISI Dec 2015 SAANDREWS S 2015 Water Risk publ RISI Dec 2015 SA
ANDREWS S 2015 Water Risk publ RISI Dec 2015 SAStuart Andrews
 
A Review Paper On Water Resource Management
A Review Paper On Water Resource ManagementA Review Paper On Water Resource Management
A Review Paper On Water Resource ManagementSabrina Baloi
 
Implementation of a Wind Powered Pumping System in Panama
Implementation of a Wind Powered Pumping System in PanamaImplementation of a Wind Powered Pumping System in Panama
Implementation of a Wind Powered Pumping System in PanamaAxel Martínez Nieto
 
Effect of socio economic factors on access to improved water sources and basi...
Effect of socio economic factors on access to improved water sources and basi...Effect of socio economic factors on access to improved water sources and basi...
Effect of socio economic factors on access to improved water sources and basi...KoechHC
 
Water resource management
Water resource managementWater resource management
Water resource managementmirarif
 
Climate Change Adaptation and Integrated Water Resource Management in the Wat...
Climate Change Adaptation and Integrated Water Resource Management in the Wat...Climate Change Adaptation and Integrated Water Resource Management in the Wat...
Climate Change Adaptation and Integrated Water Resource Management in the Wat...IRJET Journal
 
Civil Society: Khin Ni Ni Thein, ARBRO, 16th January UN Water Zaragoza Confer...
Civil Society: Khin Ni Ni Thein, ARBRO, 16th January UN Water Zaragoza Confer...Civil Society: Khin Ni Ni Thein, ARBRO, 16th January UN Water Zaragoza Confer...
Civil Society: Khin Ni Ni Thein, ARBRO, 16th January UN Water Zaragoza Confer...water-decade
 
S5c8 chapter 8-facts and figures related to drought in india.
S5c8 chapter 8-facts and figures related to drought in india.S5c8 chapter 8-facts and figures related to drought in india.
S5c8 chapter 8-facts and figures related to drought in india.Shivu P
 
EMPIRICAL EVIDENCE ON THE CURRENT CONDITIONS OF WATER RESOURCE INFRASTRUCTURE...
EMPIRICAL EVIDENCE ON THE CURRENT CONDITIONS OF WATER RESOURCE INFRASTRUCTURE...EMPIRICAL EVIDENCE ON THE CURRENT CONDITIONS OF WATER RESOURCE INFRASTRUCTURE...
EMPIRICAL EVIDENCE ON THE CURRENT CONDITIONS OF WATER RESOURCE INFRASTRUCTURE...indexPub
 

Ähnlich wie Application of contingent valuation method (cvm) in (20)

Effectiveness of drip irrigation in enhancing smart farming: a micro-study in...
Effectiveness of drip irrigation in enhancing smart farming: a micro-study in...Effectiveness of drip irrigation in enhancing smart farming: a micro-study in...
Effectiveness of drip irrigation in enhancing smart farming: a micro-study in...
 
5. Bhungroo: Water Management solutions to support diversified cropping syste...
5.	Bhungroo: Water Management solutions to support diversified cropping syste...5.	Bhungroo: Water Management solutions to support diversified cropping syste...
5. Bhungroo: Water Management solutions to support diversified cropping syste...
 
ECONOMIC_IMPACTS_OF_PACKAGED_AND_BOTTLED.pdf
ECONOMIC_IMPACTS_OF_PACKAGED_AND_BOTTLED.pdfECONOMIC_IMPACTS_OF_PACKAGED_AND_BOTTLED.pdf
ECONOMIC_IMPACTS_OF_PACKAGED_AND_BOTTLED.pdf
 
Impacts of climate change on agriculture
Impacts of climate change on agricultureImpacts of climate change on agriculture
Impacts of climate change on agriculture
 
Rain water harvesting & community based flood mapping plan of action
Rain water harvesting & community based flood mapping plan of actionRain water harvesting & community based flood mapping plan of action
Rain water harvesting & community based flood mapping plan of action
 
The Effects of Shifting Irrigation on Community Livelihoods and Environmental...
The Effects of Shifting Irrigation on Community Livelihoods and Environmental...The Effects of Shifting Irrigation on Community Livelihoods and Environmental...
The Effects of Shifting Irrigation on Community Livelihoods and Environmental...
 
14 leveks 154 162
14 leveks  154 16214 leveks  154 162
14 leveks 154 162
 
Ben Starr_AHA Paper_Final
Ben Starr_AHA Paper_FinalBen Starr_AHA Paper_Final
Ben Starr_AHA Paper_Final
 
Just Add Water: Approaches to Smart Agricultural Water Management
Just Add Water: Approaches to Smart Agricultural Water ManagementJust Add Water: Approaches to Smart Agricultural Water Management
Just Add Water: Approaches to Smart Agricultural Water Management
 
ANDREWS S 2015 Water Risk publ RISI Dec 2015 SA
ANDREWS S 2015 Water Risk publ RISI Dec 2015 SAANDREWS S 2015 Water Risk publ RISI Dec 2015 SA
ANDREWS S 2015 Water Risk publ RISI Dec 2015 SA
 
A Review Paper On Water Resource Management
A Review Paper On Water Resource ManagementA Review Paper On Water Resource Management
A Review Paper On Water Resource Management
 
Implementation of a Wind Powered Pumping System in Panama
Implementation of a Wind Powered Pumping System in PanamaImplementation of a Wind Powered Pumping System in Panama
Implementation of a Wind Powered Pumping System in Panama
 
Effect of socio economic factors on access to improved water sources and basi...
Effect of socio economic factors on access to improved water sources and basi...Effect of socio economic factors on access to improved water sources and basi...
Effect of socio economic factors on access to improved water sources and basi...
 
Water resource management
Water resource managementWater resource management
Water resource management
 
Karkheh basin focal project, synthesis of approach, findings and lessons
Karkheh basin focal project, synthesis of approach, findings and lessonsKarkheh basin focal project, synthesis of approach, findings and lessons
Karkheh basin focal project, synthesis of approach, findings and lessons
 
Climate Change Adaptation and Integrated Water Resource Management in the Wat...
Climate Change Adaptation and Integrated Water Resource Management in the Wat...Climate Change Adaptation and Integrated Water Resource Management in the Wat...
Climate Change Adaptation and Integrated Water Resource Management in the Wat...
 
Civil Society: Khin Ni Ni Thein, ARBRO, 16th January UN Water Zaragoza Confer...
Civil Society: Khin Ni Ni Thein, ARBRO, 16th January UN Water Zaragoza Confer...Civil Society: Khin Ni Ni Thein, ARBRO, 16th January UN Water Zaragoza Confer...
Civil Society: Khin Ni Ni Thein, ARBRO, 16th January UN Water Zaragoza Confer...
 
Policy Brief 11
Policy Brief 11Policy Brief 11
Policy Brief 11
 
S5c8 chapter 8-facts and figures related to drought in india.
S5c8 chapter 8-facts and figures related to drought in india.S5c8 chapter 8-facts and figures related to drought in india.
S5c8 chapter 8-facts and figures related to drought in india.
 
EMPIRICAL EVIDENCE ON THE CURRENT CONDITIONS OF WATER RESOURCE INFRASTRUCTURE...
EMPIRICAL EVIDENCE ON THE CURRENT CONDITIONS OF WATER RESOURCE INFRASTRUCTURE...EMPIRICAL EVIDENCE ON THE CURRENT CONDITIONS OF WATER RESOURCE INFRASTRUCTURE...
EMPIRICAL EVIDENCE ON THE CURRENT CONDITIONS OF WATER RESOURCE INFRASTRUCTURE...
 

Mehr von Alexander Decker

Abnormalities of hormones and inflammatory cytokines in women affected with p...
Abnormalities of hormones and inflammatory cytokines in women affected with p...Abnormalities of hormones and inflammatory cytokines in women affected with p...
Abnormalities of hormones and inflammatory cytokines in women affected with p...Alexander Decker
 
A validation of the adverse childhood experiences scale in
A validation of the adverse childhood experiences scale inA validation of the adverse childhood experiences scale in
A validation of the adverse childhood experiences scale inAlexander Decker
 
A usability evaluation framework for b2 c e commerce websites
A usability evaluation framework for b2 c e commerce websitesA usability evaluation framework for b2 c e commerce websites
A usability evaluation framework for b2 c e commerce websitesAlexander Decker
 
A universal model for managing the marketing executives in nigerian banks
A universal model for managing the marketing executives in nigerian banksA universal model for managing the marketing executives in nigerian banks
A universal model for managing the marketing executives in nigerian banksAlexander Decker
 
A unique common fixed point theorems in generalized d
A unique common fixed point theorems in generalized dA unique common fixed point theorems in generalized d
A unique common fixed point theorems in generalized dAlexander Decker
 
A trends of salmonella and antibiotic resistance
A trends of salmonella and antibiotic resistanceA trends of salmonella and antibiotic resistance
A trends of salmonella and antibiotic resistanceAlexander Decker
 
A transformational generative approach towards understanding al-istifham
A transformational  generative approach towards understanding al-istifhamA transformational  generative approach towards understanding al-istifham
A transformational generative approach towards understanding al-istifhamAlexander Decker
 
A time series analysis of the determinants of savings in namibia
A time series analysis of the determinants of savings in namibiaA time series analysis of the determinants of savings in namibia
A time series analysis of the determinants of savings in namibiaAlexander Decker
 
A therapy for physical and mental fitness of school children
A therapy for physical and mental fitness of school childrenA therapy for physical and mental fitness of school children
A therapy for physical and mental fitness of school childrenAlexander Decker
 
A theory of efficiency for managing the marketing executives in nigerian banks
A theory of efficiency for managing the marketing executives in nigerian banksA theory of efficiency for managing the marketing executives in nigerian banks
A theory of efficiency for managing the marketing executives in nigerian banksAlexander Decker
 
A systematic evaluation of link budget for
A systematic evaluation of link budget forA systematic evaluation of link budget for
A systematic evaluation of link budget forAlexander Decker
 
A synthetic review of contraceptive supplies in punjab
A synthetic review of contraceptive supplies in punjabA synthetic review of contraceptive supplies in punjab
A synthetic review of contraceptive supplies in punjabAlexander Decker
 
A synthesis of taylor’s and fayol’s management approaches for managing market...
A synthesis of taylor’s and fayol’s management approaches for managing market...A synthesis of taylor’s and fayol’s management approaches for managing market...
A synthesis of taylor’s and fayol’s management approaches for managing market...Alexander Decker
 
A survey paper on sequence pattern mining with incremental
A survey paper on sequence pattern mining with incrementalA survey paper on sequence pattern mining with incremental
A survey paper on sequence pattern mining with incrementalAlexander Decker
 
A survey on live virtual machine migrations and its techniques
A survey on live virtual machine migrations and its techniquesA survey on live virtual machine migrations and its techniques
A survey on live virtual machine migrations and its techniquesAlexander Decker
 
A survey on data mining and analysis in hadoop and mongo db
A survey on data mining and analysis in hadoop and mongo dbA survey on data mining and analysis in hadoop and mongo db
A survey on data mining and analysis in hadoop and mongo dbAlexander Decker
 
A survey on challenges to the media cloud
A survey on challenges to the media cloudA survey on challenges to the media cloud
A survey on challenges to the media cloudAlexander Decker
 
A survey of provenance leveraged
A survey of provenance leveragedA survey of provenance leveraged
A survey of provenance leveragedAlexander Decker
 
A survey of private equity investments in kenya
A survey of private equity investments in kenyaA survey of private equity investments in kenya
A survey of private equity investments in kenyaAlexander Decker
 
A study to measures the financial health of
A study to measures the financial health ofA study to measures the financial health of
A study to measures the financial health ofAlexander Decker
 

Mehr von Alexander Decker (20)

Abnormalities of hormones and inflammatory cytokines in women affected with p...
Abnormalities of hormones and inflammatory cytokines in women affected with p...Abnormalities of hormones and inflammatory cytokines in women affected with p...
Abnormalities of hormones and inflammatory cytokines in women affected with p...
 
A validation of the adverse childhood experiences scale in
A validation of the adverse childhood experiences scale inA validation of the adverse childhood experiences scale in
A validation of the adverse childhood experiences scale in
 
A usability evaluation framework for b2 c e commerce websites
A usability evaluation framework for b2 c e commerce websitesA usability evaluation framework for b2 c e commerce websites
A usability evaluation framework for b2 c e commerce websites
 
A universal model for managing the marketing executives in nigerian banks
A universal model for managing the marketing executives in nigerian banksA universal model for managing the marketing executives in nigerian banks
A universal model for managing the marketing executives in nigerian banks
 
A unique common fixed point theorems in generalized d
A unique common fixed point theorems in generalized dA unique common fixed point theorems in generalized d
A unique common fixed point theorems in generalized d
 
A trends of salmonella and antibiotic resistance
A trends of salmonella and antibiotic resistanceA trends of salmonella and antibiotic resistance
A trends of salmonella and antibiotic resistance
 
A transformational generative approach towards understanding al-istifham
A transformational  generative approach towards understanding al-istifhamA transformational  generative approach towards understanding al-istifham
A transformational generative approach towards understanding al-istifham
 
A time series analysis of the determinants of savings in namibia
A time series analysis of the determinants of savings in namibiaA time series analysis of the determinants of savings in namibia
A time series analysis of the determinants of savings in namibia
 
A therapy for physical and mental fitness of school children
A therapy for physical and mental fitness of school childrenA therapy for physical and mental fitness of school children
A therapy for physical and mental fitness of school children
 
A theory of efficiency for managing the marketing executives in nigerian banks
A theory of efficiency for managing the marketing executives in nigerian banksA theory of efficiency for managing the marketing executives in nigerian banks
A theory of efficiency for managing the marketing executives in nigerian banks
 
A systematic evaluation of link budget for
A systematic evaluation of link budget forA systematic evaluation of link budget for
A systematic evaluation of link budget for
 
A synthetic review of contraceptive supplies in punjab
A synthetic review of contraceptive supplies in punjabA synthetic review of contraceptive supplies in punjab
A synthetic review of contraceptive supplies in punjab
 
A synthesis of taylor’s and fayol’s management approaches for managing market...
A synthesis of taylor’s and fayol’s management approaches for managing market...A synthesis of taylor’s and fayol’s management approaches for managing market...
A synthesis of taylor’s and fayol’s management approaches for managing market...
 
A survey paper on sequence pattern mining with incremental
A survey paper on sequence pattern mining with incrementalA survey paper on sequence pattern mining with incremental
A survey paper on sequence pattern mining with incremental
 
A survey on live virtual machine migrations and its techniques
A survey on live virtual machine migrations and its techniquesA survey on live virtual machine migrations and its techniques
A survey on live virtual machine migrations and its techniques
 
A survey on data mining and analysis in hadoop and mongo db
A survey on data mining and analysis in hadoop and mongo dbA survey on data mining and analysis in hadoop and mongo db
A survey on data mining and analysis in hadoop and mongo db
 
A survey on challenges to the media cloud
A survey on challenges to the media cloudA survey on challenges to the media cloud
A survey on challenges to the media cloud
 
A survey of provenance leveraged
A survey of provenance leveragedA survey of provenance leveraged
A survey of provenance leveraged
 
A survey of private equity investments in kenya
A survey of private equity investments in kenyaA survey of private equity investments in kenya
A survey of private equity investments in kenya
 
A study to measures the financial health of
A study to measures the financial health ofA study to measures the financial health of
A study to measures the financial health of
 

Application of contingent valuation method (cvm) in

  • 1. Journal of Economics and Sustainable Development www.iiste.org ISSN 2222-1700 (Paper) ISSN 2222-2855 (Online) Vol.4, No.3, 2013 Application of Contingent Valuation Method (CVM) in Determining Demand for Improved Rainwater in Coastal Savanna Region of Ghana, West Africa Anthony Amoah1and Clement Dorm-Adzobu2 Abstract Coastal regions of Ghana are characterized by low annual rainfall ranging from 800mm to 900mm. This has contributed to water scarcity for domestic and agricultural use. In order for Ghana to meet the Millennium Development Goal of eradicating extreme poverty and hunger, alternative water sources must be exploited for domestic uses. This study uses the CV method as a valuation technique for non-marketed goods to estimate demand for clean rainwater for domestic use. In addition, the ordered probit model was used to determine the various factors that can influence respondents’ willingness-to-pay for clean rainwater. The study found that about 93.2% of respondents are willing to pay GH¢0.025 daily for a 34cm container of clean rainwater and this amount was observed to be influenced by some socioeconomic factors. Government involvement is therefore recommended in the provision of the modern rainwater harvesting facilities because of the incidence of poverty within the coastal savanna areas of Ghana. It is also recommended that more education on the modern method of harvesting rainwater should precede the application of any rainwater harvesting strategy in Ghana. Key words: Willingness-to-Pay, Rainwater Harvesting Technology, Ordered Probit, Marginal Effects. 1.0 Introduction Water plays a significant role in the life of all living things. Without water there would be no life for living things. Clean water is essential for human survival and satisfaction because human health depends on the provision of safe, adequate, accessible and reliable drinking water supplies (Porto, 2004). Gleick (1996) has indicated that the minimum total recommended basic water requirement in litres per person per day is 50. Health experts also consider clean water to be crucial for human health (Batmanghelidj, 2009). As global population rises global market for water also keeps on increasing. In 2006, global water demand rose above the estimated value of $400 billion per year (Black, 2007). Water occupied an increasingly important place on the international agenda since 1992; with questions about the impact of climate change on water resources, the possibility that disputes 1 Amoah, Anthony (corresponding author) is a Lecturer in the Dept. of Economics, Central University College, P.O Box DS 2310, Dansoman-Accra. Email:aamoah@central.edu.gh 2 Dorm-Adzobu, Clement (Professor) is the Dean of the Faculty of Arts and Social Sciences, Central University College, P.O Box DS 2310, Dansoman-Accra. 1
  • 2. Journal of Economics and Sustainable Development www.iiste.org ISSN 2222-1700 (Paper) ISSN 2222-2855 (Online) Vol.4, No.3, 2013 about access to water might exacerbate regional tensions, and whether large-scale planning projects are the best way to meet future needs, emerging as key issues (Love, 1999).One important goal of the Millennium Development Goals (MDGs) is to eradicate extreme and hunger globally. Poverty and hunger issues cannot be discussed in isolation without consideration of potable water. International community through the United Nations Millennium Declaration of 2000 has pledged to halve by 2015 the proportion of people who unable to access safe drinking water. As at two thousand and one (2001), almost half the population of Sub-Sahara Africa was struggling to survive on $1 per day or less, the same proportion as in 1990. The Ghana Poverty Reduction Strategy (2003-2005) targets improved access to water as very critical for the country (Ghana). Provision of adequate clean water for human consumption is important in fulfilling global and national goals for poverty reduction. In the developing world, rainwater harvesting for potable use is important both from the standpoint of water supply and health (Melby, 2006). The Virginia-US Rainwater Harvesting Manual compiled by The Cabell Brand Center in 2007 stated that rainwater can offer a sustainable alternative potable water source. Rainwater harvesting has again been recognized at the 2006 Climate Change Convention held in Nairobi-Kenya as an alternative option in addressing current water needs and provides water security against future droughts especially in African countries (Mashood et al., 2011). Rainwater harvesting means capturing the rain where it falls or capturing the runoff and taking measures to store that water for domestic use and other purposes (Mashood et al., 2011). Generally, all fresh water resources come from rainwater, either surface water or ground water and, therefore rainwater can thus be said to be the source of all water sources. Rainwater harvesting technology can be inferred as the oldest man-made technology that provides potable water for domestic, agricultural and industrial use. In Ghana, rainwater harvesting started at the household level where small water storage containers were used to collect and store rain during storms (Siabi et al., 2008). The British colonists in Ghana introduced advanced methods of harvesting rainwater in their houses, public institutions among others. Ironically, some areas in Ghana, particularly houses with thatched roofing systems are still using pre-independence if not pre-colonial methods of harvesting rain. The study used the Contingent Valuation Method (CVM) as a valuation technique for non-marketed goods to estimate how much people would be willing to pay for a good in a hypothetical market or under an imaginary circumstance. It also determines the factors collectively or individually influenced the respondent’s decision either to be willing to pay or otherwise. Some studies in the 1980’s have found that, ‘when the CVM is used to estimate the use of goods and services with which the individuals are familiar….CV surveys that are carefully designed and administered can yield accurate and useful information on households’ preferences’ (Cummings et al., 1986). This study therefore used the CVM to determine how much respondents would pay for 3clean or improved rainwater as harvested from a modern rainwater system in the coastal savanna regions of Ghana in West Africa. It also determines socioeconomic factors that influenced respondent’s decision. 3 Clean or improved rainwater as used it this context means the water has been filtered to possess the following qualities: clourless, not sour or acidic or salty, odourless, potable without negative health implications. 2
  • 3. Journal of Economics and Sustainable Development www.iiste.org ISSN 2222-1700 (Paper) ISSN 2222-2855 (Online) Vol.4, No.3, 2013 Statement of the Problem The Coastal Savannah Region of Ghana stretches from Winneba in the Western Region through the Central and Greater Accra regions respectively to Keta in the Volta Region of the country. It is described as the driest part of Ghana compared to the other ecological zones of the country because it receives between 800mm to 900mm of rains annually depicting an average of 850mm annually. In spite of this challenge, less effort has been done on the part of government to expedite the process of introducing modern rainwater harvesting systems into Ghana’s building code after the drafted rainwater strategy was introduced. Residents have also not invested enough in upgrading their traditional methods of harvesting rainwater to make it more potable for domestic use. Formerly, water shortage was a national crisis especially during the dry season however water shortage in Ghana now is independent of the season. The total amount of water needed in the capital city of Ghana (Accra) alone is about 150 units however 90 units is produced and out of the 90 units produced, 45% of the water is lost through defective pipes and other equipments, and stealing (Asante, 2009). Since 2006 with its severity peaking from the first three months of 2010, people of Ghana without an exception to the coastal areas of Accra where the seat of government is located have been confronted with drinking water crisis until today. Donor aid to economic services and infrastructure represents a substantial proportion of total expenditure of which water in 2001 is estimated as 76%. This level of donor support for poverty reduction and growth represents an unsustainable situation in the long term (GPRS, 2003-2006). The issue of growth and development can be envisaged in our policy framework if both the short term and long term effects are promising. Depending on donors for the provision and maintenance of rainwater harvesting systems can be envisaged to be unsustainable. The general objective of the study is to determine how much Ghanaian households within the coastal savannah areas will be willing to pay (WTP) for improved rainwater as well as establishing the possible factors affecting their WTP. This is achieved by using the Contingent Valuation Method (CVM) which in recent years is commonly used in developing countries to elicit the individuals’ preferences for the basic infrastructural projects such as water supply and sanitation (Whittington, 1998; Merrett, 2002). 2.0 Empirical Literature Shutz and Lindsay (1990) also estimated WTP for ground water in New Hampshire. The WTP was influenced by factors such as gender, age, the educational level, income level and number of settlement years in New Hampshire. These variables were statistically significant Asenso-Okyere et al., (1997) applied the CVM to determine the WTP for health insurance by the informal sector in Ghana. The study adopted the ordered probit model for the estimation. The study found that over 90% of respondents are willing to join the scheme and up to 63.6% respondents were willing to pay a premium of about 5000 old cedis or $3.03 a month for a household of five persons. Again, the study revealed that the amount that households are 3
  • 4. Journal of Economics and Sustainable Development www.iiste.org ISSN 2222-1700 (Paper) ISSN 2222-2855 (Online) Vol.4, No.3, 2013 willing to pay is influenced by income, sex, dependency ratio, health care expenditure and education. According to Khorshiddoust (2004), one of the earliest researchers who adopted the CVM was Gramlich (1977). He adopted CVM for the estimation of public participation in an extraction of demand curve for fresh and clean water in Boston Metropolitan Area in USA. The primary objective of Gramlich’s study was to calculate the amount of WTP. He applied statistical models for his estimation after collating data through questionnaire administration on a hundred and sixty five respondents. The findings of the study revealed appreciable WTP amounts showing a high demand for fresh and clean water in Boston. Birol et al. (2007) employed the Contingent Valuation Approach to estimate farmers’ demand for recycled wastewater in Cyprus. The study used a random sample of 100 respondents located in the Akrotiri aquifer area in Cyprus, a common-pool water resource with rapidly deteriorating water quality and quantity. The results reveal that farmers (93.8%) are willing to adopt this new water resource, and they derive the highest economic values from a recycled wastewater use program, which provides high quality recycled wastewater, and high water quantity in the aquifer. Asfaw, et al. (2008) formulated two‐stage probit econometric model following the log- likelihood function of Cameron and Quiggin(1994) and Haab (1998). The primary objective the model was to determine the willingness to pay for health insurance and hence the potential market for new low-cost health insurance product in Namibia, using the double bounded contingent valuation (DBCV) method. The results of the study showed that 87% of the uninsured respondents were willing to join the proposed health insurance scheme and on average were willing to insure 90% of the average family size. On the average respondents were willing to pay NAD 484 per capita per month and respondents in the poorest income quintile were willing to pay up to 11.4 percent of their income. They concluded that private voluntary health insurance schemes may be able to serve as a reliable income flow for health care providers considering the vulnerability of the poor. Also, Mashood et al. (2011) at the 3rd Ghana Water Forum held in Accra-Ghana submitted a paper on ‘Rainwater Harvesting (RWH) as a Complementary Approach to Improving Water Supply in Ghana’. The paper sought to find out the reason(s) why rainwater harvesting has been recognized at the 2006 Climate Change Convention held in Nairobi-Kenya as an alternative option in addressing current water needs and that, rainwater also provides water security against future droughts especially in African countries but it has not received the required support for adoption and expansion in Ghana. The study observed that initial capital investment is relatively high however given the lifespan, and operation and maintenance cost the rainwater harvesting storage tank and the borehole or hand dug well, the rainwater harvesting storage tank is cheaper in the long term. Other reasons for the low level of of rainwater harvesting technology included limited demonstration facilities, the perception that rainwater quality is suspect as compared to groundwater and treated surface water 4 Note: At the time of the study, exchange rate was NAD 7.20 to US$1.00. 4
  • 5. Journal of Economics and Sustainable Development www.iiste.org ISSN 2222-1700 (Paper) ISSN 2222-2855 (Online) Vol.4, No.3, 2013 inadequate financing and inadequate building regulatory framework to support rainwater harvesting. Quartey (2011) at the 3rd Ghana Water Forum held in Accra-Ghana on the theme Water and Sanitation Services Delivery in a Rapidly Changing Urban Environment, submitted a paper on “Towards a Sustainable Allocation of Potable Water in Ghana: Evidence from Kumasi”. The primary objective of the paper was to assess the sustainability of urban water distribution using the CVM. The willingness-to-pay values were obtained through the bidding game format by means of an administered questionnaire. The study revealed that consumers would be willing to pay about 300% to the main urban water distributor (Ghana Water Company Limited) in the form of an increase in tariffs once their water needs were going to be met. The degree of demand for potable water revealed a sizeable consumers’ surplus which make buyers susceptible to extortion by water vendors. The study recommended an urgent government intervention to save consumers from undue extortion and possible return to unwholesome water consumption with its accompanying health implications to consumers and the nation at large. Based on the literature reviewed on the models, determinants, CV methodology and WTP in various countries with different projects, it can be inferred that the CVM is a recommended approach for investigating the economic benefits of the provision of non-marketed goods such as rainwater in the Coastal Savannah areas of Ghana. 3.0 Methodology Environmental Economics methodology describes six phases in the practical application of the CVM. These are the market description, elicitation, calculation, estimation, aggregation and validation phases (Bateman and Turner, 1995; Quartey, 2011). 3.1 Sources of Data The study employed both primary data and some secondary data were used in this research. The primary data were collected through the use of questionnaire, observation and interview. The secondary data were also collected through reports, bulletins, articles and journals. A team of five researchers were put together to constitute the interviewers who administered the questionnaire. Interviews were carried out to encourage respondents to tell their own stories in their own words. The team leaders of the interviewers have also lived in Accra and were abreast of the people’s cultural values and behavior, it helped them do the observation, interpretation and reported accordingly. Interviewers also helped the interviewees to understand any question they found difficult to comprehend on their own. This was intended to help the respondents answer all the questions enumerated by the researcher. Data collection for this survey requires that the market must first be described. 3.2 The Hypothetical Market Demand for product warrants the existence of a market however, not a conventional market because values expressed by people are contingent upon their preferences. A key element of the contingent valuation approach involves specifying the target commodity. A hypothetical market is one in which the researcher asks respondents to indicate what they think they would 5
  • 6. Journal of Economics and Sustainable Development www.iiste.org ISSN 2222-1700 (Paper) ISSN 2222-2855 (Online) Vol.4, No.3, 2013 do under a particular imaginary situation. Again, it describes the services that could be made available and at what market value. An estimation of the demand for improved rainwater is contingent upon the existence of a hypothetical market. Willingness-to-pay by respondents in the study area was based on how the market was described. In this study, the researcher created a hypothetical market for the respondents to reveal their maximum WTP for the demand of improved rainwater. Generally, hypothetical markets are intended to place the respondents in a real world market-like situation to be able to purchase the targeted products by expressing their preference for the good in question. In this regard, the purpose of the hypothetical market was to set up a market for the provision of improved rainwater. This is to serve the Coastal Savanna areas of Ghana, particularly Greater Accra Region- 5 Dangbe East and Volta Region-South Tongu districts respectively. The target commodity, that is improved rainwater was hypothetically described- ‘Assuming the modern rainwater harvesting technology or system has been installed for your household or neighbourhood with the principal characteristics as follows: having a filter, modern gutters, sizeable storage facility (say a polytank with pipe) for the house, the colour of the harvested water is like any clean or potable water, it is odour free, it is good for any domestic use’. A picture of the scenario was also shown to the respondents with the intention of helping them get a visual representation of the hypothetical market that has been orally described. These oral and pictorial descriptions explained the services that could be made available in real terms to the community and helped the respondents to reveal how much they were willing to pay for the improved rainwater. The study observed from the pretest that, some respondents tend to appreciate the hypothetical market in picture form and some also appreciated the oral description without pictures. Respondents also found it difficult to believe in the possibility of having clean rainwater as they are used to the unfiltered traditional method of harvesting rainwater. In addition, it was realized that, if the oral description of the market is not properly done, the respondents will either understate or over state their value for the improved rainwater. For this reason, the study combined both the oral description method as well as the picture6 method in this survey. The question asked for the iterative bidding game was, “suppose you are supplied with a modern rainwater harvesting technology as orally and pictorially described, how much would you be willing to pay to fetch a bucket of water from the system?” 3.3 Obtaining Bids and Bidding Mechanism Among the options available to the study, person to person (thus in-person or personal interview or face to face) was adopted in this study. The use of interactive computer medium, mail questionnaire with follow ups, and telephone interview would not be appropriate for this work as the illiteracy rate as well as the incidence of poverty amongst the people in the area will not permit an excellent use of these other methods of eliciting information. The advantages of the face to face method used include increasing engagement and awareness of 5 Dangbe East has now been divided into Ada East and Dangbe East 6 see appendix 3 for pictorial description 6
  • 7. Journal of Economics and Sustainable Development www.iiste.org ISSN 2222-1700 (Paper) ISSN 2222-2855 (Online) Vol.4, No.3, 2013 the respondent or interviewee, simplicity, reduces misunderstanding and makes spontaneous questions and answers possible. There are several bidding mechanisms or elicitation mechanisms in determining willingness to pay. The ‘bidding game iterative method’ was employed by the study in this empirical work. According to Bateman et al. (1995) the iterative bidding game format and dichotomous choice CV surveys are of high priority relative to the open ended format which has a high level of uncertainty. They reiterated that, respondents experience significant uncertainty in answering open-ended questions and may exhibit free-riding or strategic overbidding tendencies (although this is less certain) hence the choice of the iterative bidding game format in this study. This method asks the respondent a sequence of questions until the maximum bid is found. This method was applied by quoting higher amounts to the respondents until the maximum amount they were willing to pay was reached. However, it may suffer from starting point bias, and fatigue effects. The weaknesses of this bidding mechanism used by the study have been taken care of, as a pilot survey was undertaken by the study. A clear amount to start with was obtained as most of the respondents under the pilot survey gave GH¢0.05 (5 pesewas) as their starting point amount hence stultifying the problem of starting point biases. The team of interviewers made the questionnaire administration quite simple and straight forward. This minimized the severity of fatigue effects on the part of both the interviewer and the interviewee as this did not influence the validity of the data. The bidding game iterative method with a starting point amount of GH¢0.050 per 34cm bucket was used. If the respondent’s answer is ‘yes’ to the bid of GH ¢0.05, then the question is repeated with a higher bid; if the answer is ‘no’, the question is repeated with a lower bid. This continues until the respondent’s maximum WTP is reached. Also, ‘Pay as you fetch’ was the bid-vehicle or mode of payment majority of the household heads preferred to express their WTP when the Iterative Bidding Game Method was applied. It is obvious that these bid vehicle(s) would best prevent free riders under the method. 3.4 Sample size and Sampling Frame In order for the respondents to give a true picture of their WTP, the study focused on two regions with a district each characterized by potable water problems. Based on the relatively high potable water challenge in the study area, twenty communities which yielded a sample size of 309 household heads or respondents were used for the study. The communities namely Tsopoli, Dawa, Sege, Tofluokpo, MatseKope, Hwakpo, Addokope, Kasseh Ada, Ada Foah, Tojeh, Kpotame, Vume, Tefle, Koji, Sokpoe, Sogakope, Hlevi, Alesikpe, Dabala were sampled from the districts based on the non proportional stratified sampling method. The coastal regions were put into strata of four namely Greater Accra, Central, Volta and Western regions. However, due to the water demands and the incidence of poverty of the districts, Volta (South Tongu) and the rural/peri-urban part of Greater Accra (Dangbe East) were selected for the survey. The random sampling within the selected strata was done on-site as the study sought to avoid pre-selected respondents who may probably not be available at the 7
  • 8. Journal of Economics and Sustainable Development www.iiste.org ISSN 2222-1700 (Paper) ISSN 2222-2855 (Online) Vol.4, No.3, 2013 time for the administration of the questionnaire by the interviewer. The on-site sampling was done in houses, offices, shops and markets. 3.5 Model Specification 3.5.1 Ordered Probit (Oprobit) Model According to Maddala (1983) and Green (2008) responses generated from a survey may not necessarily be the maximum WTP and that the true WTP may perhaps lie between the maximum value expressed by the respondent and the next possible highest value. This suggests that the oprobit model is preferred to multinomial probit model because the former accounts for the statistical significance between the dependent and the independent variables as well as the ordinal characteristic of the dependent variable (Duncan et al., 1998). Lemieux (2012) listed the most common cases of limited dependent variable models, along with the popular estimators used to estimate these models. Inferring the structural model from the economic and econometric point of view, the oprobit model is stated as y* = α + X 1β1 + ........ X k β k + e …………………………………………….... (5) The latent variable (WTP*) can therefore be specified as WTPi * = α + X i β + ei . …………. (6) Where α is the constant parameter,“ X i = X i' ” is a vector showing features of the household and attributes of the proposed improved rainwater harvesting system, β is the vector representing the model’s parameters, and ei is error term in the model. According to Wooldridge (2002), assuming WTP* is the ordered responses taking on the values {0, 1, 2, 3.......... J }, we can derive the ordered probit as follows: Let R1, R2, ……, RJ represent the ‘j’ prices which divide the range of willingness to pay space into ‘J+1’ categories and let WTPi be the categorical variable such that; WTPi = 1 if WTP *i ≥ R1 …………………... (7) WTPi = 2 if < WTP *i ≥ R2 ………………... (8) WTPi = 3 if < WTP *i ≥ R3 ………………… (9) . . J + 1 = 1 if R J < WTP *i . …………………… (10) 8
  • 9. Journal of Economics and Sustainable Development www.iiste.org ISSN 2222-1700 (Paper) ISSN 2222-2855 (Online) Vol.4, No.3, 2013 Now WTPi* can be equated to ‘j’, if we assume j=1, 2, 3…, J+1. Therefore R j −1 < WTP *1 ≤ RJ . ……………………….. (11) Equation (5) can be substituted into equation 11, to yield R j −1 < α + X 1β + e1 ≤ RJ . ……………………….. (12). This can be statistically manipulated to generate series of equations such as Rj−1 −α< Xiβ +ei ≤Rj −α or Rj−1 −α − Xiβ <ei ≤ Rj −α − Xiβ . According to Wooldridge (2002), given that we have J+1 categories, the probability of household ‘i’ choosing category ‘j’ (=1, 2, 3..., J+1) it can be represented as follows Pi (1) = Pr(WTPi = 1) = Pr(WTPi * ≤ R1 ) = Pr( X 1β + e ≤ µ1 ) = Pr( ei ≤ µi − X i β ) = Φ ( µi − X i β )...................................................................................................................(13) Pi (2) = Pr(WTP = 2) = Pr(R1 < WTP* ≤ R2 ) = Pr(ei ≤ µ2 − X i β ) − Pr(ei ≤ µi − X i β ) i i = Φ(µ2 − X i β ) − Φ(µ1 − X i β ).....................................................................................................(14) Pi (3) = Pr(WTP = 3) = Pr(R2 < WTP* ≤ R3 ) = Pr(ei ≤ µ3 − X i β ) − Pr(ei ≤ µ2 − X i β ) i i − Pr(ei ≤ µ1 − X i β ) = Φ( µ3 − X i β ) − Φ( µ2 − X i β ) − Φ(µ1 − X i β )......... .......... .......... 15) ......( Pi ( J ) = Pr(WTP = J ) = Pr( RJ −1 < WTP * ≤ RJ ) = Φ( µ J − X i β ) − Φ( µJ −1 − X i β )..............................(16) i i Pi ( J + 1 ) = Pr( WTP i = J + 1 ) = Pr( WTP i * > R J ) = 1 − Φ ( µ J − X i β )......... .......... ...( 17 ) Given that Φ ( a ) = 1 − Φ ( −a ) , because the normal distribution is symmetric and µ J = threshold parameters To obtain ‘β’ and the ‘j’ parameters we maximize the log likelihood function to yield ln L = 1[WTP = 1] ln[Φ(µ1 − Xβ ) + 1[WTP = 2] + 1[WTP = 3]1n[Φ(µ3 − X i β ) ln[Φ(µ2 − X i β ) − Φ(µ1 − Xβ )] + ... i i i + 1[WTP = J + 1]1n[1 − Φ(µ j − X i β )]........ i .......... .......... .......... .......... .......... .......... .......... .......... .......... 18) ....( N J +1 In sum, ln L = ∑∑WTPiJ ln[Φ ( µ j − X i β ) − Φ ( µ j −1 − X i β )]........................................(19) i =1 j =1 3.5.2 Marginal Effect of Ordered Probit Model 9
  • 10. Journal of Economics and Sustainable Development www.iiste.org ISSN 2222-1700 (Paper) ISSN 2222-2855 (Online) Vol.4, No.3, 2013 The differential of dependent variable WTP with respect to the vector “X” (which shows the features of the household and attributes of the proposed improved rainwater harvesting system) presents the marginal effects. The marginal effects show how the probability of each outcome changes with respect to changes in the explanatory variable. ∂ Pr ob(WTPi = 1 | X) = -Φ ' ( µ1 - X ' β ) β ...........................................................(20) ∂X i ∂ Pr ob(WTPi = 2 | X) ' ' = [Φ ' ( µ1 - X i β ) − Φ ' ( µ2 − X i β )]β ..............................(21) ∂X i ∂ Pr ob(WTPi = 3 | X) ' ' ' = [Φ ' ( µ1 - X i β ) − Φ ' ( µ 2 − X i β ) − Φ ' ( µ3 − X i β )]β ...........(22) ∂X i ∂ Pr ob(WTPi = J | X) ' ' = [Φ ' ( µ J-1 - X i β ) − Φ ' ( µ J − X i β )]β ....................................(23) ∂X i ∂ Pr ob(WTPi = J + 1 | X) ' = [Φ ' ( µ J - X i β )]β ..........................................................( 24) ∂X i 3.5.3 Functional Form of the Model Binam et al. (2003) indicated that in literature, some authors have concluded that the willingness-to-pay is influenced by economic characteristics, socio-demographic characteristics and the characteristics of the good itself (Whittigton et al., 1990; Flores and Richard, 1997; Bloom and Shenglan, 1999; Atim, 1999; Criel et al., 1999). Binam et al. (2003), added variables such as age, the level of education, the gender, religion, the family size, marital status in estimating WTP for community health prepayment scheme in Cameroon. The model used by Briscoe et al. (1990) in a CV study in Brazil was: U ij = α 0 + α1C + α 2V + α 3Y + α 4 Z + ξij ............................................................( 25) Where U= Utility, C= Monetary costs of obtaining water, V= perceived water quality, Y= Household income, Z= a set of socioeconomic variables used as proxies for the families tastes, ξ = the error term. Following the models adopted from Briscoe et al. (1990), and Binam et al. (2003), WTP depended on some economic and socio-demographic independent variables. This paper also adopted socio-economic variables based on the environmental good in question, the kind of people and how they live. The valuation function used in this research is based on the consumer demand theory. Therefore, the functional form of the model to be determined is expressed as: 10
  • 11. Journal of Economics and Sustainable Development www.iiste.org ISSN 2222-1700 (Paper) ISSN 2222-2855 (Online) Vol.4, No.3, 2013 MWTP = f ( MS , G , Mi , E , Occ , Y , Urwdu , Pfmt )........( 26 ) MWTP = β O + β 1 Ms + β 2 G + β 3 Mi + β 4 E + β 5 Occ + β 6 Y + β 7 Urwdu + β 8 Pfmt + µ .......... .......... .......... ....( 27 ) Where β 0 denotes the constant term in the model, β1 , β 2 , β 3 , β 4 , β 5 ……..and β13 are parameter estimates to be estimated using the ordered probit method of estimation. The error term ( µ ) is added to the function because the researcher does not observe all components of WTP for improved rainwater (Mcfadden, 1974). The WTP is the dependent variable used in the model. This deals with the amount that the respondents are willing-to-pay to be beneficiaries of clean rainwater. The fundamental principle of WTP is that the preferences of individuals must serve as base of evaluation for gains and losses of non-market goods and services. Table 1: Model Variables and their Description Variable Marital Gender Occupation of Educati Usage of Preference Monthly Household Status of Respondent by on of Rainwater of Modern Income Population of Respond Sector Respon for Domestic Rainwater Levels of below 18 Respon ent dent Purpose by Technique Respond Years dent Respondent by ent (Gh¢) Respondent Abbreviati Ms G Occ Edu Urdu Pmrt Income Minors ons (Y) in Gh¢ Description Dummy Dummy Dummy Dummy Dummy Categorical Continuo Categorical us Code Married Male=1, Unemployed= Educate User=1, Preferred=1, Min=0 Min=1 =1,Othe Female= 0, d =1, Otherwise=0 rwise=0 0 Employed=1, Otherwi Otherwise=0 Max=25 Max=5 se=0 00 Apriori + +/- + + + + + +/- 4.0 Analysis of Results This section presents the results of the field survey as generated by both the statistical software(s) (STATA 11.0 & PASW 18) and researcher’s computation. The descriptive statistics show that about 78% of the respondents are willing to harvest rainwater if it should rain. About 22% were not interested in rainwater with some giving reasons as they have adequate water from the pipe system, their companies supply them pipe water constantly and improper roofing sheets like thatched, dirty roof because of excessive dust in the areas and asbestos roofs. Again, 99% of those who were willing to harvest preferred modern rainwater techniques with filters to the old method without filters. Unfortunately, 1% of the respondents were still 11
  • 12. Journal of Economics and Sustainable Development www.iiste.org ISSN 2222-1700 (Paper) ISSN 2222-2855 (Online) Vol.4, No.3, 2013 interested in their old method explaining that they are used to the old method and do not know any possible negative aspect of the modern method. Furthermore, 80% were willing to pay for the modern method whilst 20% declined willingness to pay citing financial constraints as their main reason. The factors that determine the respondents’ willingness to pay are presented in section 4.1. 4.1 Ordered Probit Regression Results The formulated ordered probit model was able to identify certain socio economic variables associated with the WTP for improved rainwater. Table 4.0: Regression Results Ordered probit regression Number of obs = 307 LR chi2(8) = 153.86 Prob > chi2 = 0.0000 Log likelihood = -168.68569 Pseudo R2 = 0.3132 wtp Coef. Std. Err. z P>|z| [95% Conf. Interval] gender -.2401295 .184282 -1.30 0.193 -.6013156 .1210566 ms .1963758 .1856867 1.06 0.290 -.1675634 .5603151 minors .1016446 .0625263 1.63 0.104 -.0209048 .224194 education -.3403554 .1928214 -1.77 0.078 -.7182785 .0375676 occupation~y -.422118 .1851842 -2.28 0.023 -.7850723 -.0591637 income -.0010561 .0518607 -0.02 0.984 -.1027012 .1005889 urwdu -.6265431 .2513638 -2.49 0.013 -1.119207 -.1338791 pfmt 2.675478 .2735347 9.78 0.000 2.13936 3.211596 /cut1 -.1664413 .3318117 -.8167804 .4838978 /cut2 3.044125 .3496137 2.358895 3.729355 /cut3 3.287359 .3514048 2.598619 3.9761 /cut4 3.636773 .3657474 2.919921 4.353624 Several diagnostic tests were conducted on the model to ascertain the authenticity and predictive justification of the model. The model presents the log likelihood value of 168.697 which is statistically significant at 1% significance level, suggesting that, model is correctly specified. The Likelihood Ratio Index or Pseudo R2 tests the goodness-of-fit of the model. A pseudo R2 value of 0.31 shows how the model explains 31% of variations in the dependent variable. By this we say the model fits the set of observations. Amoah (2011) explained that “According to Mitchell and Carson (1989), the R2 of 31% is quite reasonable in that, the reliability (reproducibility and stability) of CVM can be tested most easily by obtaining a respectable coefficient of determination (thus R2 ≥0.15 or 15%). This shows how the WTP variable is influenced by set of independent variables (Arlinghaus and Mehner, 2004)”. The study also tested for the existence of multicollinearity using the spearman’s correlation test. The presence of one or more large bivariate correlations with rho coefficient of 0.8 and 0.9 are commonly used cutoffs which indicates strong linear associations, suggesting collinearity may be a problem (Mason and Perreault, 1991). The results as displayed in appendix 2b ruled out the presence of severe multicollinearity in the model as the coefficients of correlation (rho or ρ ) were below the established rule ( ρ <0.8 and 0.9) for all other 7 Rounded up 12
  • 13. Journal of Economics and Sustainable Development www.iiste.org ISSN 2222-1700 (Paper) ISSN 2222-2855 (Online) Vol.4, No.3, 2013 variables. Again, the VIF8 calculation also justified the absence of severe multicollinearity in the model. Now, the model from the perspective of an entire bundle of independent variables as well as individual independent variable demonstrates its ability to predict the outcome variable. From table 4.0, except marital status (ms) and number of household population under eighteen years (minors); all the other variables had negative signs. In the results, preference for modern technology (pfmt) and users/usage of rainwater for domestic purposes (urwdu) were significant at 1%, occupation was also significant at 5% and, minors as well as education were significant at 10% levels of significance. Income, gender and ms were however not significant. According to Hamath et al. (1997), since the utility of preference is an ordinal measure, the relative magnitude of the coefficients is more important than their absolute magnitude. The marginal effect results with their categories are shown in table 4.19. The marginal effects show the relative changes in probabilities of the dependent variable to a unit change in an explanatory variable say income of respondents. In the case of dummy variables, the marginal effect of a dummy is the change in the predicted probability for a change in the variable from start value to end value holding all other variables at their sample mean (Long, 1997). Table 4.1: Marginal Effect of the Ordered Probit Estimates Variable wtp≤Gh¢0.05 Gh¢0.05<wtp≤Gh¢0.10 Gh¢0.10<wtp≤ Gh¢0.15 wtp>Gh¢0.20 MS 0.0129 0.0059 0.0053 0.0046 Gender -0.0100 -0.0078 -0.0073 -0.0066 Education -0.0088 -0.0118* -0.0112 -0.0105 Occupatio -0.0083 -0.0149** -0.0143** -0.0137** n Urwdu 0.0112 -0.0249** -0.0251** -0.0264* Pfmt -0.1447**** -0.0830**** -0.0759**** -0.0673**** Minors 0.0055 0.0032* 0.0029* 0.0026* Income -0.0001 -0.0000 -.0000 -0.0000 ****=1%, ***=5%, **≡10%, *≡15% levels of significance respectively. NB: The results are approximated to four decimal places. wtp=Willingness-to-pay, Gp=Ghana Pesewas In discussing the results provided in table 4.1, marital status (ms) is positively related to willingness-to-pay for improved rainwater in the coastal savannah region of Ghana. This implies that the unmarried are more willing to pay for improved rainwater than the married. The probability of paying any amount less or equal to GH¢0.05 is 0.0129; greater than GH¢0.05 but less or equal to GH¢0.10 is 0.0059; greater than GH¢0.10 but less or equal to GH¢0.15 is 0.0053; greater than GH¢0.20 is 0.0046. The relationship could be attributed to the fact that, most of the household heads are males (65%), and for the males who are married, their domestic water supply responsibility depend mostly on their wives and children hence the unwillingness of husbands or married category to pay. However, because the burden of ensuring that there is water at home lies directly on individuals who are not 8 See appendix 2a for Variance Inflation Factor (VIF) calculation. 9 See appendix 1b for detailed tables as generated by STATA Version 11. 13
  • 14. Journal of Economics and Sustainable Development www.iiste.org ISSN 2222-1700 (Paper) ISSN 2222-2855 (Online) Vol.4, No.3, 2013 married, they demonstrated their willingness to pay for the improved rainwater. This has been supported by a study in Bushenyi (Western Uganda) by Wedgwood and Samson (2003) that male household heads have control over finances in most developing countries however, the burden of fetching water lies largely on women and children. Gender is negatively related to willingness-to-pay for improved rainwater in the coastal savannah region of Ghana. By implication, the probability of men paying some money in their bid to obtain improved rainwater is higher than women. The probability of paying any amount less or equal to GH¢0.05 is 0.0100; greater than GH¢0.05 but less or equal to GH¢0.10 is 0.0078; greater than GH¢0.10 but less or equal to GH¢0.15 is 0.0073; greater than GH¢0.20 is 0.0066. This relationship could be based on the fact that, men are economically empowered in the cultural settings of Ghana hence expressing higher willingness-to-pay. This has been supported by World Bank study in 1993 suggesting that gender’s influence on willingness-to-pay depends largely on the specific cultural settings or context. The results also show an inverse relationship between income and wtp implying that a unit increase in income has the probability of decreasing the wtp for improved rainwater. This is confirmed by the first standard policy paradigm which holds that, rural households especially in developing countries where the incidence of poverty is very high can pay very little or nothing out of their income for improved water services (World Bank, 1993). Unfortunately, income, marital status and gender were not statistically significant at all in this study. Similar findings where socioeconomic factors were not statistically significant is seen in Soto Montes de Oca et al. (2003) where gender and family size were not statistically significant and Gwulyani et al. (2005) where only three variables were statistically significant with variables like household size, income level, gender of respondent, education level of household respondent, among others were not statistically significant. Education exhibited an inverse relationship with wtp for improved rainwater. This suggests that educated people have a higher probability of paying for improved rainwater relative to the uneducated. It is generally accepted that an educated person who is informed about polluted water and its health implication will express a higher willingness to pay than an uninformed or uneducated person. The probability of paying any amount greater than GH¢0.05 but less or equal to GH¢0.10 is 0.0118 for this category is significant at about 15% level of significance. Occupation of the respondent by sector also shows a negative relationship with wtp. This implies that those employed (Agricultural, Industrial and Services sectors) are more likely to express their willingness to pay relative to the unemployed. This is because those employed are financially better off relative to those who are unemployed. The employed can pay for services that will improve their welfare as compared to the unemployed. The probability of paying any amount greater than GH¢0.05 but less or equal to GH¢0.10 is 0.0149. This is significant at 10% level of significance. Usage of rainwater for domestic purposes (urwdu) as a variable was negatively related to wtp. It means that those who use rainwater are expressing a higher probability of paying for improved rainwater relative to those who do not use rainwater for domestic purposes. This 14
  • 15. Journal of Economics and Sustainable Development www.iiste.org ISSN 2222-1700 (Paper) ISSN 2222-2855 (Online) Vol.4, No.3, 2013 could be attributed to the modern method which provides filtered water to the unfiltered traditional method whose quality cannot be guaranteed. In addition to the scarcity of water in the study area, users of rainwater were interested and expressed a higher probability of paying for improved rainwater because of the new method and its likely positive effects on their health. The probability of paying any amount greater than GH¢0.05 but less or equal to GH¢0.10 is 0.0249. Also, the probability of paying any amount greater than GH¢0.10 but less or equal to GH¢0.15 is 0.0251. These were significant at 10% level of significance. The amount less or equal to GH¢0.05 was also positive however, it was not significant. Also, the number of persons in the household that were eighteen years and below (Minors) exhibited a positive relationship with the dependent variable implying that, a unit increase in the number of minors in a household has the probability of increasing the wtp for improved rainwater. This is particularly true for household heads who appreciate the ordeal the minors and women go through in ensuring that there is potable water at home for use. The probability of paying any amount greater than GH¢0.05 but less or equal to GH¢0.10 is 0.0031. This is significant at 15% level of significance. Respondent’s preference for modern rainwater harvesting technology or method (Pfmt) shows that those who said they preferred the modern rainwater technology are less likely to pay for the modern method as compared to those who declined preference for the modern method and are still comfortable with their traditional method. This ironic result came about simply because of fear of financial commitment coupled with failure of their crops within the period under consideration by majority of respondents who are within the agricultural sector. The probability of paying any amount less than GH¢0.05 is 0.6223; greater than GH¢0.05 but less or equal to GH¢0.10 is 0.0391; greater than GH¢0.10 but less or equal to GH¢0.15 is 0.0363; greater than GH¢0.20 is 0.0344. These values were statistically significant at even 1% level of significance. In sum, the determinants of wtp in the ordered probit model revealed three major significant variables namely Occupation, Usage of rainwater for domestic purposes and Respondent’s preference for modern rainwater technology. 15
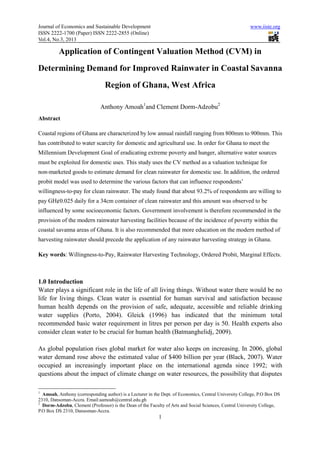
  • 16. Journal of Economics and Sustainable Development www.iiste.org ISSN 2222-1700 (Paper) ISSN 2222-2855 (Online) Vol.4, No.3, 2013 Table 4.2: TWTP and Expected Revenue for Clean Rainwater in Ghana Pesewas per day Intervals Freq Mid-WT % of Share of Cumulativ Number of TWTP Expected (***GHP . P HH* Populati e Buckets**** per day Revenue ) (***GHP * on Population of water used (***GHP) per day ) per day by all (***GHP) A B C D E F G= H= I=C×G F×8 C×E 0-0.05 287 0.025 93.2 196,414 210,786 1,686,288 4,910 42,157 0.06-0.10 7 0.08 2.3 4,791 14,372 114,974 383 9,198 0.11-0.15 5 0.13 1.6 3,422 9,581 76,649 445 9,964 0.16-0.20+ 9 0.18 2.9 6,159 6,159 49,275 1,109 8,869 TOTAL 308 100.0 210,786* 1,927,186 6,847 70,189 *Ghana Statistical Service, 2010 Population Census after adding the two districts, **HH=Household, ***Gp=Ghana Pesewas, ****Average buckets used per day is from the study is 150 litres (8 Buckets) 10 , Willingness-to-Pay= WTP , TWTP =Total WTP Source: Author’s Computation, 2012. The mean willingness-to-pay for improved rainwater in the two districts was determined by dividing the TWTP by the share of population. This yields (6,847÷ 210,786)*30= GH¢0.032 per day, per person. It is evident in table 4.2 that majority of the population representing 93.2% were willing to pay GH¢0.025 daily for a bucket of improved rainwater. This same amount provides the highest expected revenue of GH¢42,157 per day. Quartey (2011) indicated that “According to Kauffman and Pérard, 2007, the Freshwater Country Profile of Ghana of the United Nations Organization has indicated that it costs Ghana US$0.80 per cubic meter to produce, transport and distribute potable water”. Using freshwater case as a proxy, given the two district’s population, the cost of efficient production, transportation and distribution of improved rainwater for 210,786 people will yield US$168,628.8 per cubic meter (equivalent to Gh¢317,022.14411). It can be said that, barring the fact that all the eight buckets used for the computation may not be potable water, the mean cost per day can be determined as Gh¢317,022.144 divided by 210,786 which yields Gh¢1.504. The difference between the mean wtp value and the mean estimated cost value results in a net loss of GH¢1.47 per day. An Ordinary Least Square linear regression was used to derive the demand function from the distribution provided in table 4.2. This is given as equation 24 and subsequently illustrates the curvature of the demand curve which is shown in figure 1. 10 The bucket used in the field survey had about 18.75 litres per bucket 11 Exchange rate used is $1: ¢1.88 16
  • 17. Journal of Economics and Sustainable Development www.iiste.org ISSN 2222-1700 (Paper) ISSN 2222-2855 (Online) Vol.4, No.3, 2013 Y = 187047 . 4 − 1222389 X .......... .......... 24 SE = ( 74301 . 7 ) ( 626992 .2 ) t = [ 2 . 51 ] [ − 1 . 95 ] 2 R = 66 % Figure 1.0: DEMAND CURVE FOR IMPROVED RAINWATER Series1, 6159, 0.18 Willingness-to-Pay in Ghana Cedis Series1, 9581, 0.13 Series1, 14372, 0.08 Series1, 210,786, 0.025 Population Author’s Field Work (2012) The demand curve in figure 1, shows the inverse relationship between the dependent variable and the independent variable as exists in economic theory. The demand curve confirms the findings of the study that most of the people in the study area are prepared to pay GH¢0.25 for a 34cm container of improved rainwater. This has been observed to be very high considering their current cost of pipe-borne water as GH¢0.05 and GH¢0.10 which is mostly unavailable. The study realized that except for the incidence of poverty in the study area, the bid would have been higher. 5.0 Conclusion and Policy Recommendations In order to achieve the MDGs, the water supply crisis confronting the coastal savanna region of Ghana affecting domestic and agricultural uses need urgent attention since water should not be trivialized. The problem is central to most economic activities and the livelihood of the people in the study area. It is recommended that the government intervenes in addressing this problem since it has a multiplier effect on the national economy. The improved rainwater harvesting system introduced to the people has been accepted by majority of the respondents with a very high demand. However, intensive education and awareness programmes to introduce government policies and plans on rainwater are required on sustainable basis. The acceptance of improved rainwater harvesting system should not be seen as an alternative source of water supply but one which complements the pipe water supply system. This is because the annual rainfall for the coastal savanna areas is woefully inadequate for absolute reliance on rainwater. 17
  • 18. Journal of Economics and Sustainable Development www.iiste.org ISSN 2222-1700 (Paper) ISSN 2222-2855 (Online) Vol.4, No.3, 2013 Private direct investment is not strongly recommended for rainwater harvesting in poor areas like the coastal savanna region of Ghana because the recovery of investment will be very low due to the incidence of poverty. Some form of government intervention is required to enable the communities buy into the idea of adopting the new system. Lastly, existing pipe-borne water supply system imposes additional cost to residents instead of assisting them. They are made to pay exorbitant prices for water sold to them by a few unscrupulous people who have monopoly over the existing sources. This situation is unfair, and the Ghana Water Company must be encouraged to improve the water delivery throughout the communities to alleviate their suffering. Acknowledgement: This study was made possible under the Exceed Guest Chair, Professor Dr. Clement Dorm-Adzobu of ISW-TU Braunschweig through the financial support of DAAD and BMZ in Germany. My special thanks to Prof. Dr., Ali Müfit Bahadir, Prof. Dr. Haarstrick Andreas, Prof. Dr Ulrich Menzel, Dr Basten Loges for their support. References 1. Amoah, A. (2011) Determinants Of Willingness-To-Pay (Wtp) for The Restoration and Maintenance of Korle Lagoon in Accra, Ghana Journal of Business Research, Vol. 5 Issues 1 & 2, 2011 2. Arlinghaus and Mehner, (2004), Fisheries Management and Ecology, Blackwell Publishing Ltd., Berlin, Germany, pp 61-64. 3. Asante, K. B. Daily Graphic, 14th December 2009 09:16:15 accessed @ http://www.graphicghana.com/dailygraphic/page.php?news=5660 4. Asenso-Okyere, W. K., Osei-Akoto, I. and Appiah, E. N. (1997), ―Willingness to pay for Health Insurance in a developing economy. A pilot study of the informal sector of Ghana using contingent valuationǁ, Health Policy, Vol. 42, pp. 223-237. 5. Asfaw, A., Gustafsson-Wright, E. and van der Gaag, J. (2008), ―Willingness to pay for Health Insurance: An Analysis of Potential Market for New Low Cost Health Insurance Products in Namibiaǁ, AIID RS 08-01/2. 6. Atim, C., (1999), Social movements and health insurance: a critical evaluation of voluntary, non-profit insurance schemes with case studies from Ghana and Cameroon. Social Science and Medicine 48, 881-896. 7. Bateman, I. J., Langford, I. H., Turner, K., Willis, K. G., & Garrod, G. D. (1995). Elicitation and truncation effects in contingent valuation studies. Ecological Economics, 12, 161-179 8. Bateman, I.J. and Turner, R.K. (1993) Valuation of the environment, methods and techniques: The contingent valuation method, in Turner R.K. (ed.) Sustainable 18
  • 19. Journal of Economics and Sustainable Development www.iiste.org ISSN 2222-1700 (Paper) ISSN 2222-2855 (Online) Vol.4, No.3, 2013 Environmental Economics and Management: Principles and Practice, Belhaven Press, London, pp120-191. 9. Bateman, I.J., Willis, K.G. and Garrod, G.D. (1994) Consistency between contingent valuation estimates: A comparison of two studies of UK National Parks, Regional Studies, 28 (5): 457-474. 10. Bateman, Ian J. and Turner, R. Kerry. (1995). “Valuation of the Environment, Methods and Techniques: The Contingent Valuation Method”, in Turner (ed). Sustainable Environmental Economics and Management: Principles and Practice, England: J Wiley. 11. Batmanghelidj F. MD, (2009) accessed at http://www.health-benefit-of-water.com/benefit-of-drinking-water.html 12. Binam Joachim Nyemeck, Nkama Arsène and Nkendah Robertn (2003), ‘Estimating the willingness to pay for community health prepayment schemes in rural area’: A case study of the use of contingent valuation surveys in centre Cameroon. University of Yaoundé II, Faculty of Economic Sciences and Management. pp 1-25. 13. Birol E, Koundouri P, Koundouri Y(2007) Farmers’ Demand for Recycled Wastewater in Cyprus: A Contingent Valuation Approach, Environmental Economy and Policy Resaerch, University of Cambridge, Discussion Paper No:24. USA 14. Birol, E., and Das, S. (2010) Estimating the value of improved wastewater treatment: The case of River Ganga, India, Journal of Environmental Management 91 (2010) 2163-2171 15. Birol, E.; Das, S. and Bhattacharya, N. R.(2009) Estimating the value of improved wastewater treatment: The case of River Ganga, India. Environmental Economy and Policy Resaerch, University of Cambridge, Discussion Paper No:43.2009 16. Black, R (June, 06,2007)Global Demand for Water to Grow, accessed at seekingalpha.com/article/37467-global-demand-for-water-expected-to-grow 17. Bloom, G., Shenglan, T., (1999). Rural Health Prepayment Schemes in China: towards a more active role for government. Social Science and Medicine 48, 951-960. 18. Briscoe, J., Furtado de Castro, P., Griffen, C., North, J., Oslen, O., (1990) Towards Equitable and Sustainable Rural Water Supplies: A contingent Valuation Study in Brazil, World Bank Economic Review, Vol. 4. no.2. pp:115-134. 19. Cameron, C. and Trivedi K. P. (2005) Microeconometrics: Methods and Applications, Cambridge University Press, New York, United States of America 20. Cameron, T.A. 1991. Combining Contingent Valuation and Travel Cost Data for the V aluation of Nonmarket Goods. Land Economics. 68(3):302‐17. 21. Criel, B., Van der Stuyft, P., Van Lerberghe, W., (1999). The Bwamanda hospital insurance scheme: effective for whom? A Study of Its Impact on Hospital Utilization Patterns. Social Science and Medicine 48, 897-911. 19
  • 20. Journal of Economics and Sustainable Development www.iiste.org ISSN 2222-1700 (Paper) ISSN 2222-2855 (Online) Vol.4, No.3, 2013 22. Cummings, R. G., Schulze W. D., Gerking, S. D., and Brookshire, D. S. (1986), ―Measuring the elasticity of substitution of wages for municipal infrastructure: A comparison of the survey and wage hedonic approachesǁ, Journal of Environmental Economics and Management, Vol. 13 No. 3, pp. 269-276. 23. Duncan C. S., Khattak A. J., and Council F. M. (1998), ―Applying the Ordered Probit Model to Injury Severity in Truck-Passenger Car Rear-End Collisionsǁ, Transportation Research Record, 1635, Paper No. 98-1237. 24. Flores, N.E. and Richard, T.C. (1997). The Relationship between the Income Elasticities of demand and Willingness to Pay. Journal of environment Economics and Management 33(3), 287-95. 25. Ghana Poverty Reduction Strategy (GPRS,2003-2006), Government of Ghana 26. Gleick, P.H (1996) Basic Water requirements for Human Activities: Meeting Basic Needs. Water International, Vol.21, No. 2, pp. 83-92 27. Gramlich, F.W (1977) The Demand for Clean Water the case of Charles River, National Tax Journal 30(2):183-194 28. Greene, W.H. (2008), Econometrics Analysis, Sixth Edition, New Jersey: Prentice Hall. 29. Gulyani, S. Talukdar, D and Kariuki, M. R. (2005) Water for the Urban Poor: Water Markets, Household Demand, and Service Preferences in Kenya, Water Supply and Sanitation Sector Board Discussion Paper Series N o. 5 30. Haab, T.C. 1998. Estimation Using Contingent Valuation Data from a ‘Dichotomous Choice with Follow‐Up’ Questionnaire: A Comment. Journal of Environmental Economics and Management 35: 190‐94. 31. Hamath, A.S., M.D. Faminov, G.V. Johnson, and G. Crow (1997), ‘Estimating the values of cattle characteristics using an ordered probit model’, American Journal of Agricultural Economics 79: 463–476. 32. Hanley, N. and Spash, C.L., (1993): Cost Benefit Analysis and the Environment. Aldershot: Elgar Publishing Limited. 33. Holden, S.T. and Shiferaw, B. (2002). Poverty and Land Degradation : Peasants ‘Willingness to Pay to Sustain Land Productivity. In C. B. Barrett, F. M. Place, and A. A. Aboud (eds.), Natural Resource Management in African Agriculture: Understanding and Improving Current Practices. CABI Publishing in Association with International Centre for Research in Agroforestry, Oxon and New York. 34. Khorshiddoust, A.M (2004) Contingent Valuation in Estimating the Willingnes to Pay for Environmental Conservation in Tabriz, Iran, Environmental Studies No.36accesed@ journals.ut.ac.ir 35. Lancaster, K.J. (1966), ―A New Approach to Consumer Theoryǁ, Journal of Urban Economics, Vol. 74, pp. 132-157. 20
  • 21. Journal of Economics and Sustainable Development www.iiste.org ISSN 2222-1700 (Paper) ISSN 2222-2855 (Online) Vol.4, No.3, 2013 36. Lemieux, T (May, 2012) Econ 594: Lecture#6, Department of Economics, University of British Colombia. 37. Long, J. S. (1997), Regression Models for Categorical and Limited Dependent Variables. Advanced Techniques in the Social Sciences, Vol. 7, California: SAGE Publications, Inc. 38. Love, P(1999)Water Resources: Meeting Future Demand, Foresight Journal Volume 1, Issue 3,pg 275-278 39. Luce, R. (1959), Individual Choice Behavior: a Theoretical Analysis. New York: Wiley 40. Maddala, G. S. (1983), Limited-Dependent and Qualitative Variables in Economics, New York: Cambridge University Press, pp. 257-91 41. Mashood, Jemila; Ampadu-Boakye, Joseph & Nii Odai Anidaso Laryea (2011)Rainwater Harvesting (RWH) as a Complementary Approach to Improving Water Supply in Ghana, 3rd Ghana Water Forum, Accra, Ghana, 2011;accessed@ http://ghanawaterforum.org 42. Mason, H.C. and Perreault, D.W. Jr. (1991) Collinearity, Power, and Interpretation of Multiple Regression Analysis, Journal of Marketing Research, Vol. 28, No.3 (Aug.,1991),270. 43. McFadden, D. (1974), "Conditional Logit Analysis of Qualitative Choice Behavior." Frontiers in Econometrics, ed. by P. Zarembka, Academic Press, New York. 44. McFadden, D. (1995) Computing Willingness-To-Pay in Random Utility Models, Department of Economics, University of California, Berkeley. 45. Melby, P. (2006), Rainwater Harvesting for Potable Water Use, Department of Landscape Architecture. Accessed@ http://fwrc.msstate.edu/housing/images/potable.pdf 46. Merrett, S. (2002), ‘Deconstructing Households’ Willingness-to-pay for Water in Low-income Countries’, Water Policy 4, 157–172 47. Mitchell, R.C. and Carson R. T. (1989). Using surveys to value public goods: the contingent valuation method. Washington, D.C.: Resources for the Future. 48. Nsiah-Gyabaah, K(2002), The Looming National Dilemma of Water Crisis in Peri Urban Areas in Ghana, accessed at http/www.gg.rhul.ac.uk/kumasi/Project_ Related_Papers/ Cedar_IRNR/Paper_7/3/3.html 49. Porto, M (2004) Human Health and Sanitation; Water and Ethics; Vol.:Essay 6, United Nations Educational, Scintific and Cultural Organisation, France. 50. Quartey, J.D. (2011) Towards a Sustainable Allocation of Potable Water in Ghana: Evidence from Kumasi Ministry of Water Resources, Works and Housing, Ghana Water Journal Forum 1st Edition, Pg 194. 21
  • 22. Journal of Economics and Sustainable Development www.iiste.org ISSN 2222-1700 (Paper) ISSN 2222-2855 (Online) Vol.4, No.3, 2013 51. Schmidt, M. and Murphy, K. (2010) Proceedings of the 13th International Conference on Artificial Intelligence and Statistics (AISTATS), Chia Laguna Resort, Sardinia, Italy. Volume 9 of JMLR: W&CP 9. 52. Shutz, S.D.,Lindsay,B.E. (1990). The Willingness to pay for groundwater protection, Water Resources Research, 20(2):1869-75 53. Siabi W.K, Van-Ess RKD, Engmann C, Mensah T, Tagoe M. (Sept. 2008) Rainwater Harvesting, Last Water Supply Option for Small Communities and Institutions in Difficult Hydro-geological Formations. www. cwsagh. Org / downloads / rainwater _ harvesting.pdf. Accessed on 13th Oct., 2012. 54. Smith, V.K., (1992). Non-market Valuation of Environmental Resources an interpretative essay in Bateman I.J., and Turner, R.K., (1992) Evaluation of the Environment: The Contingent Valuation Method, CSERGE Working Paper GEC 92-18. 55. Soto Monte de Oca, G., Bateman, J.I.,Tinch,R., and Moffatt G.P (2003) Assessing the Willingness to Pay for Maintained and Improved Water Supplies in Mexico City, The Centre for Social and Economic Research on the Global Environment (CSERGE) Working Paper ECM 03-11 56. Turner, R.K., Bateman, I.J. and Pearce, D.W. (1992). United Kingdom. In. Navrud, S. (ed) Valuing the Environment: The European Experience, Scandinavian University Press, Oslo. 57. Wedgewood, A. and Samson, K. (2003) Willingness-to-pay Survey-A Streamlined Approach; Water, Engineering and Development Center, Loughborough University, UK. 58. Whittington, D. (1998), ‘Administering Contingent Valuation Questions in Developing Countries’,World Development 26(1), 21–30. 59. Whittington, D., Briscoe, J., Mu, X., Barron, W., (1990). Estimating the Willingness to pay for Water Services in Developing Countries: A Case Study of Contingent Valuation Surveys in Southern Haiti. Economic Development and Cultural Change in Binam Joachim Nyemeck, Nkama Arsène and Nkendah Robertn (2003), ‘Estimating the willingness to pay for community health prepayment schemes in rural area’: A case study of the use of contingent valuation surveys in centre Cameroon. University of Yaoundé II, Faculty of Economic Sciences and Management. pg 1-25. 60. Wooldridge J.M. (2002), Econometric Analysis of Cross Section and Panel Data, Massachusetts: MIT Press. 61. World Bank (Water Demand Research Team, Jan. 1993) The Demand for Water in Rural Areas: Determinants and Policy Implications, The World Bank Research Observer, vol.8, No. 1, pp. 47-70. 22
  • 23. Journal of Economics and Sustainable Development www.iiste.org ISSN 2222-1700 (Paper) ISSN 2222-2855 (Online) Vol.4, No.3, 2013 Appendix 1a Marginal effects after oprobit y = Pr(wtp==1) (predict, outcome(1)) = .88738422 variable dy/dx Std. Err. z P>|z| [ 95% C.I. ] X gender* -.0100208 .00909 -1.10 0.270 -.02783 .007788 .648208 ms* .0129661 .01574 0.82 0.410 -.01789 .043822 .67101 minors .0055184 .00458 1.20 0.228 -.003459 .014496 2.41368 educat~n* -.0088277 .01032 -0.86 0.392 -.029053 .011398 .736156 occupa~y* -.0082737 .01298 -0.64 0.524 -.03371 .017163 .732899 income -.0000573 .00282 -0.02 0.984 -.005577 .005463 2.07166 urwdu* .0112204 .02848 0.39 0.694 -.044601 .067042 .827362 pfmt* .6222925 .06653 9.35 0.000 .491889 .752696 .801303 (*) dy/dx is for discrete change of dummy variable from 0 to 1 Appendix 1d Marginal effects after oprobit y = Pr(wtp==2) (predict, outcome(2)) = .01664986 variable dy/dx Std. Err. z P>|z| [ 95% C.I. ] X gender* -.0078496 .00668 -1.18 0.240 -.020936 .005237 .648208 ms* .0058523 .00553 1.06 0.290 -.004984 .016689 .67101 minors .0031676 .00216 1.47 0.143 -.001066 .007401 2.41368 educat~n* -.011776 .00812 -1.45 0.147 -.027685 .004133 .736156 occupa~y* -.01493 .00846 -1.76 0.078 -.031521 .001661 .732899 income -.0000329 .00162 -0.02 0.984 -.003201 .003135 2.07166 urwdu* -.0249145 .01387 -1.80 0.072 -.052099 .00227 .827362 pfmt* .0390957 .01222 3.20 0.001 .015138 .063054 .801303 (*) dy/dx is for discrete change of dummy variable from 0 to 1 Appendix 1e Marginal effects after oprobit y = Pr(wtp==3) (predict, outcome(3)) = .01327614 variable dy/dx Std. Err. z P>|z| [ 95% C.I. ] X gender* -.0073199 .00636 -1.15 0.250 -.019782 .005143 .648208 ms* .0053201 .00503 1.06 0.290 -.004543 .015183 .67101 minors .0029086 .00202 1.44 0.149 -.001046 .006863 2.41368 educat~n* -.0111894 .00806 -1.39 0.165 -.026981 .004603 .736156 occupa~y* -.0143187 .00851 -1.68 0.092 -.030998 .00236 .732899 income -.0000302 .00148 -0.02 0.984 -.002939 .002878 2.07166 urwdu* -.0250706 .015 -1.67 0.095 -.054479 .004337 .827362 pfmt* .036289 .01256 2.89 0.004 .011675 .060902 .801303 (*) dy/dx is for discrete change of dummy variable from 0 to 1 Appendix 1f Marginal effects after oprobit y = Pr(wtp==4) (predict, outcome(4)) = .00933788 variable dy/dx Std. Err. z P>|z| [ 95% C.I. ] X gender* -.0066189 .00601 -1.10 0.271 -.018394 .005156 .648208 ms* .0045871 .00433 1.06 0.290 -.003907 .013081 .67101 minors .0025516 .00177 1.44 0.149 -.000911 .006014 2.41368 educat~n* -.0104952 .00783 -1.34 0.180 -.025839 .004849 .736156 occupa~y* -.0136909 .00855 -1.60 0.109 -.030446 .003064 .732899 income -.0000265 .0013 -0.02 0.984 -.002578 .002525 2.07166 urwdu* -.0264146 .01773 -1.49 0.136 -.061168 .008338 .827362 pfmt* .0343508 .0127 2.71 0.007 .009462 .05924 .801303 (*) dy/dx is for discrete change of dummy variable from 0 to 1 23
  • 24. Journal of Economics and Sustainable Development www.iiste.org ISSN 2222-1700 (Paper) ISSN 2222-2855 (Online) Vol.4, No.3, 2013 Appendix 2: Diagnostic Test Appendix 2a • Multicollinearity with Variance Inflation Factor(VIF) 12 VIF=1/tolerance, where tolerance is 1-R2=1-0.31=0.69. VIF=1/0.69=1.45 or 1.5. “where R 2 is j the coefficient of determination of a regression of explanator j on all the other explanators. A tolerance of less than 0.20 or 0.10 and/or a VIF of 5 or 10 and above indicates a multicollinearity problem (but see O'Brien 2007)” Appendix 2b • Spearman’s Correlation Test . spearman gender ms minors education occupation income urwdu pfmt, stats(rho obs p) Key rho Number of obs Sig. level gender ms minors educat~n occupa~n income urwdu pfmt gender 1.0000 307 ms 0.2101 1.0000 307 307 0.0002 minors 0.0953 0.0330 1.0000 307 307 307 0.0956 0.5651 education 0.2555 0.0213 -0.0689 1.0000 307 307 307 307 0.0000 0.7106 0.2284 occupation -0.0131 -0.0467 -0.0626 0.1731 1.0000 307 307 307 307 307 0.8198 0.4154 0.2740 0.0023 income 0.1737 0.2688 0.0164 0.0621 0.0333 1.0000 307 307 307 307 307 307 0.0023 0.0000 0.7749 0.2783 0.5611 urwdu -0.0477 0.0837 0.0979 -0.0388 -0.0420 0.0103 1.0000 307 307 307 307 307 307 307 0.4046 0.1434 0.0867 0.4983 0.4634 0.8580 pfmt 0.0092 0.0162 0.0887 -0.0017 -0.0239 0.0402 0.5069 1.0000 307 307 307 307 307 307 307 307 0.8719 0.7776 0.1211 0.9756 0.6771 0.4833 0.0000 . Appendix 3 a. Traditional Rainwater Facility b. Modern Rainwater Facility Source: Janette Worm and Tim van Hattum. “Rainwater harvesting for domestic use”: Agromisa Foundation and CTA, Wageningen, 2006. 12 http://en.wikipedia.org/wiki/Multicollinearity 24
  • 25. This academic article was published by The International Institute for Science, Technology and Education (IISTE). The IISTE is a pioneer in the Open Access Publishing service based in the U.S. and Europe. The aim of the institute is Accelerating Global Knowledge Sharing. More information about the publisher can be found in the IISTE’s homepage: http://www.iiste.org CALL FOR PAPERS The IISTE is currently hosting more than 30 peer-reviewed academic journals and collaborating with academic institutions around the world. There’s no deadline for submission. Prospective authors of IISTE journals can find the submission instruction on the following page: http://www.iiste.org/Journals/ The IISTE editorial team promises to the review and publish all the qualified submissions in a fast manner. All the journals articles are available online to the readers all over the world without financial, legal, or technical barriers other than those inseparable from gaining access to the internet itself. Printed version of the journals is also available upon request of readers and authors. IISTE Knowledge Sharing Partners EBSCO, Index Copernicus, Ulrich's Periodicals Directory, JournalTOCS, PKP Open Archives Harvester, Bielefeld Academic Search Engine, Elektronische Zeitschriftenbibliothek EZB, Open J-Gate, OCLC WorldCat, Universe Digtial Library , NewJour, Google Scholar