1. Pulse Oximetry using Programmable Mixed Signal Array GreenPAK Device
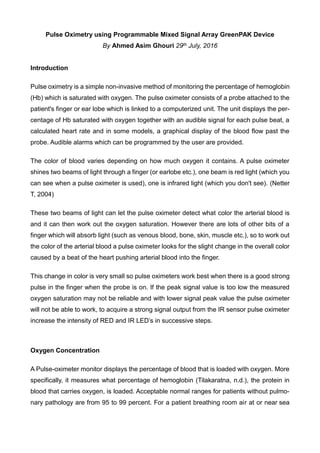
By Ahmed Asim Ghouri 29th July, 2016
Introduction
Pulse oximetry is a simple non-invasive method of monitoring the percentage of hemoglobin
(Hb) which is saturated with oxygen. The pulse oximeter consists of a probe attached to the
patient's finger or ear lobe which is linked to a computerized unit. The unit displays the per-
centage of Hb saturated with oxygen together with an audible signal for each pulse beat, a
calculated heart rate and in some models, a graphical display of the blood flow past the
probe. Audible alarms which can be programmed by the user are provided.
The color of blood varies depending on how much oxygen it contains. A pulse oximeter
shines two beams of light through a finger (or earlobe etc.), one beam is red light (which you
can see when a pulse oximeter is used), one is infrared light (which you don't see). (Netter
T, 2004)
These two beams of light can let the pulse oximeter detect what color the arterial blood is
and it can then work out the oxygen saturation. However there are lots of other bits of a
finger which will absorb light (such as venous blood, bone, skin, muscle etc.), so to work out
the color of the arterial blood a pulse oximeter looks for the slight change in the overall color
caused by a beat of the heart pushing arterial blood into the finger.
This change in color is very small so pulse oximeters work best when there is a good strong
pulse in the finger when the probe is on. If the peak signal value is too low the measured
oxygen saturation may not be reliable and with lower signal peak value the pulse oximeter
will not be able to work, to acquire a strong signal output from the IR sensor pulse oximeter
increase the intensity of RED and IR LED’s in successive steps.
Oxygen Concentration
A Pulse-oximeter monitor displays the percentage of blood that is loaded with oxygen. More
specifically, it measures what percentage of hemoglobin (Tilakaratna, n.d.), the protein in
blood that carries oxygen, is loaded. Acceptable normal ranges for patients without pulmo-
nary pathology are from 95 to 99 percent. For a patient breathing room air at or near sea
2. level, an estimate of arterial pO2 can be made from the blood-oxygen monitor "saturation of
peripheral oxygen" (SpO2) reading.
Absorption of Red Light and Infra-red light (Twonsend, 2001)
A typical pulse oximeter utilizes an electronic processor and a pair of small light-emitting
diodes (LEDs) facing a photodiode through a translucent part of the patient's body, usually
a fingertip or an earlobe. One LED is red, with wavelength of 660 nm, and the other is infra-
red with a wavelength of 940 nm. Absorption of light at these wavelengths differs signifi-
cantly between blood loaded with oxygen and blood lacking oxygen. Oxygenated hemoglo-
bin absorbs more infrared light and allows more red light to pass through. Deoxygenated
hemoglobin allows more infrared light to pass through and absorbs more red light. The LEDs
sequence through their cycle of one on, then the other, then both off about thirty times per
second which allows the photodiode to respond to the red and infrared light separately and
also adjust for the ambient light baseline. (Pulse oximetry, n.d.) The amount of light that is
transmitted (in other words that is not absorbed) is measured, and separate normalized sig-
nals are produced for each wavelength. These signals fluctuate in time because the amount
of arterial blood that is present increases (literally pulses) with each heartbeat. By subtract-
ing the minimum transmitted light from the peak transmitted light in each wavelength, the
effects of other tissues is corrected for. The ratio of the red light measurement to the infrared
light measurement is then calculated by the processor (which represents the ratio of oxy-
genated hemoglobin to deoxygenated hemoglobin), and this ratio is then converted to
SpO2 by the processor via a lookup table based on the Beer–Lambert law. The hardware
and software to acquire SpO2 data will be included in the further extension of this application
note.
3. Pulse-oximeter Finger Probe
Signal Processing
Some initial signal processing is required when trying to extract oxygen concentration from
the signal coming from finger sensor. The calculations follow Beer-Lambert Law
(Matviyenko, 2011) to assess the percentage of the oxygenated blood. Mathematically given
as:
The figure 1 below shows how light is absorbed in the finger:
Figure 1 : Absorption of Light (Matviyenko, 2011)
There are some components which contribute to the absorption of light listed below :
1. Oxygenated Haemoglobin in the blood
2. De-oxygenated Haemoglobin
3. Absorption that is not from arterial blood
4. Optical attenuation due to scattering, geometric factors etc.
4. Figure 2 shows main block diagram of the Pulse Oximeter application using Green Pak’s
device SLG46140.
Figure 2 : Block Diagram of the Pulse Oximeter
The GreenPAK device will generate drive signals for both IR and RED LED’s, whereas ADC
within the device will sample IR Sensor output and send data serially out. As shown in the
figure 3, it will turn IR LED ON for 100 ms, while RED LED is off and then turn RED LED on
for the next 100ms and at the end of the cycle turn both IR and RED ON to acquire another
reading. Figure 3 shows the timing diagram of the POR (power On Reset) , ref Clock , IR
LED and RED LED drive signals and ADC data output.
Figure 3 : Timing waveform for IR and RED LED’s
5. To control the brightness of each LED, SLG46140 will produce a varying PWM. The average
value of voltage (and current) fed to the load is controlled by turning the switch between
supply and load on and off at a fast rate. The term duty cycle describes the proportion of 'on'
time to the regular interval or 'period' of time; a low duty cycle corresponds to low power,
because the power is off for most of the time. Duty cycle is expressed in percent, 100%
being fully on.
Figure 4 : PWM waveform
Both RED and IR LED’s brightness will be controlled using varying PWM to conserve energy
as this can be a portable battery powered device and also to determine which light intensity
is suitable for a certain type of finger. As shown in figure: 1, some portion of light source is
absorbed by the skin and muscle tissue in the finger.
6. Implementation with GreenPAK Designer
Figure 5 shows top level block diagram of the design that will perform two main functions
of the pulse oximetry i.e driving RED and IR LED with varying intensity and acquisition of
the IR sensor signal .
Figure 5 : SLG46140 implementation of Pulse Oximetry
7. Figure 6 shows the schematic of the SLG46140 internal connections for both PWM
generation and IR signal acquisition. Pin 6 has been configured as Analog input and
connects to PGA with a gain of x0.25, PGA’s output is connected to ADC. The serial data
output of ADC is connected to digital output pin 12, ADC interrupt signal is connected to PIN
12 and ADC sampling clock is connected to PIN 14 . All of these three i/o pins i.e PIN 12, 13
and 14 are configured to be Digital output, whereas PIN 6 is set to be Analog input. Figure
7 shows the setting for PGA and ADC for this application.
Figure 6 : SLG46140 GreenPAK Designer Schematic
8. Figure 7 : PGA and ADC Settings
The screen capture of FSM that controls the PWM can be seen in Figure 6. The 3-bit LUT0
is connected to PIN3, PIN5, which are configured as Digital in with Schmitt trigger with pull
up resistor 1MegΩ. Output of 3-bit LUT0 is connected to KEEP FSM1. When KEEP is HIGH,
Q will stay at its current value. The 2-bit LUT0 is configured as NAND. Output LED is
configured to be 1x Open Drain NMOS. PWM period is defined by the period of FSM0. If
button “+” is held high , "LED" output will generate PWM signal with changing duty cycle
from 256/256 to 1/256 (the LED brightness will go up). When button “-” is held at logic high,
"LED" output will generate PWM with changing duty cycle from 1/256 to 256/256 (the LED
brightness will go down). Refer to AN-1052 (Holod, 2014) for complete details about PWM
application for the SLG46140 device.
10. Figure 8 and 9 show setting for RC and LF Oscillator for this application, ADC reference
clock is the OUT0 output of the RC OSC which is pre divided by 2 and then divided by 12.
LF OSC output is divided by 16 and connected to LUT1 and to PIN11 i.e RED En output,
where LUT1 is set to output XOR output.
Figure 10 : LUT1 Setting
11. Hardware Design and Testing
Refer to figure 10 which basic arrangement of a Pulse Oximeter finger probe, where RED
and IR LED are embedded in to the upper lip of the finger clip and IR sensor is placed in the
lower lip.
Figure 10: Pulse Oximeter finger probe internal circuit diagram
Figure 11: Pulse Oximeter finger probe front end circuit
12. Figure 11 shows complete front end circuit for the finger probe, LM7805 and LM315 provide
a regulated DC output of +5.0V and +3.3V. RED and IR LED are connected to the collector
output of transistors 2N2222 each with series resistor of 220 ohm and a 3.3V Zener diode
in parallel, where base of T1 and T2 are fed with PWM1 and PWM2 from tri-state buffers.
RED En and IR En enable the buffers to transmit PWM waveform to the T1 and T2. IR
Sensor BPW34 is connected to +5.0V in reverse biased configuration with a 10K series
resistor and 100nf capacitor in parallel. Tri-stat buffers are used as a precaution to ensure
that PWM input from GreenPAK device to the base of T1 and T2 are at CMOS (i.e
maintaining +3.3V ) output.
Figure 12 : Output of IR Sensor when both RED and IR LED are ON
The figure 12 shows oscilloscope screen capture of the IR Sensor output from the front end
circuit, where its Vpp is 1.84mV the gain of PGA is set to 0.25 as ADC input should not
exceed 250mV . Figure 13, 14 and 15 show testing results of varying duty cycle of PWM
output when +ve input is kept at high refer to figure : 6 , it is the output of PIN 10 . To
decrement duty cycle –ve input i.e PIN 4 is connected to logic high. Figure 16 shows test
results of digital output PINs 9 and 11, the enable signals for RED and IR LED’s are 90
degree phase shifted relative to each other.
13. Figure 13 : PWM Output with 1% duty cycle
Figure 14 : PWM Output with 10% duty cycle
14. Figure 15 : PWM Output with 60% duty cycle
Figure 16 : RED and IR LED enable signals
15. Analogue to digital Conversion
Refer to figure 6 which shows schematic of SLG46140, the ADC portion consists of analogue
input pin no : 6 which is connected to PGA whose output is sampled by ADC. The two
interface signals from ADC are ADC interrupt connected to pin no : 13 and serial ADC data
to pin no : 12 as well as Clock at pin no : 14 .
Figure 17 : ADC Signals
Figure 17 shows screen shot of LogicStudio 16 (logic analyzer) of ADC signals, where D0
is the ADC interrupt signal, D1 is the ADC serial data and D2 is the clock. Figure 18 shows
the wiring of the bread board , implementing Front end circuit , whereas Figure 19 shows
the screen shot of the GreenPAK emulator . As an extension to this application note the
serial ADC data will be latched by a Master processor and real-time data will be displayed
on a LCD , thus verifying that correct data from ADC has been transmitted .
16. Figure 18 : Proto-board circuit of Front End Ckt shown in schematic of figure no : 11
Figure 19 : GreenPAK emulator
17. Extensions
This application note does not cover all aspects of information extraction processes involved
in Pulse Oximetry. It shows how SLG46140 can be used as a mixed signal device to perform
some basic functions required to acquire Heart rate and Oxygen concentration. Some signal
processing can be done to improve the output from the GreenPAK device if more resources
were available within the chip. GreenPAK devices are easy to configure and implement a
functionality, as no prior knowledge in any particular programming language is required, the
GreenPAK Designer is a user friendly tool. GreenPAK device SLG46140 can be used with
any Microcontroller or FPGA to act as a mixed signal front end device, because of their small
size and footprint these devices can be integrated into small form factor hardware.
SLG46140 has analog comparators, Programmable Amplifier and a ADC (Analog to Digital
converter) thus less component count and effort for the PCB designer to route and isolate
tracks. More serial interfaces can be added to SLG46140’s ADC such as SPI, I2C and UART
to interface its data output seamlessly to Master CPU. These devices are well suited to be
connected to various sensors and format the signals for further processing.
Conclusion
Implementing Pulse Oximetry using GreenPAK device proved to be simple yet low cost
front end solution. The small size and ease of programming these devices makes them
ideal for any application where mixed signal processing is required.
18. References
Holod, B. (2014, December 22). Silego . Retrieved from Silego Technology:
http://www.silego.com/products/355/312/AN-1052.html
Matviyenko, S. (2011, February 01). Sensing – Pulse Oximeter with PSoC® 1. AN2313. Cypress
Semiconductor.
Netter T, S. M. (2004). Signal Processing In A Low-PowerWearable Oximeter. BIOSIGNAL (p. 3).
Winterthur, Switzerland: Institute of Mechatronic Systems IMS.
Pulse oximetry. (n.d.). Retrieved from wikipedia: https://en.wikipedia.org/wiki/Pulse_oximetry
Tilakaratna, P. (n.d.). how equipment works. Retrieved from
https://www.howequipmentworks.com/pulse_oximeter/
Twonsend, D. N. (2001). Pulse Oximetry. Medical Electronics (p. 11). Michaelmas Term.