SlideShare ist ein Scribd-Unternehmen logo
1 von 12
Downloaden Sie, um offline zu lesen
Environ Geol (2005) 48: 908–919
DOI 10.1007/s00254-005-0029-8                 ORIGINAL ARTICLE


Adrian H. Gallardo
Walter Reyes-Borja
                                             Flow and patterns of nitrate pollution in
Norio Tase                                   groundwater: a case study of an agricultural
                                             area in Tsukuba City, Japan


Received: 15 May 2005
                                             Abstract A numerical simulation         crops and the associated agricultural
Accepted: 17 June 2005                       was applied to first characterize the    practices may translate into de-
Published online: 2 August 2005              groundwater flow and patterns of         creases of contamination levels.
Ó Springer-Verlag 2005                       nitrate pollution of a small-agricul-   A series of hypothetical scenarios
                                             tural catchment in Tsukuba City,        demonstrated that replacing grass-
                                             Japan, for a 10-year period. There      lands by other crops may reduce the
                                             was a good performance of the flow       contamination levels up to 12%. As
A. H. Gallardo (&)                           simulation. In contrast, although the   the chosen field is a representative of
National Institute of Advanced Industrial
Science and Technology,                      transport model calculated the evo-     many other agricultural areas in Ja-
Geological Survey of Japan,                  lution of the plume, it only provided   pan, the approach and results should
1-1-1, #7 Higashi, Tsukuba                   estimates of solute concentrations.     also be applicable to similar cases
305-8567, Japan                              Groundwater contamination in-           around the country.
E-mail: ad.gallardo@aist.go.jp               creased exponentially during the first
Tel.: +81-29-8613240
Fax: +81-29-8613240                          594 days of the simulation, reaching    Keywords Groundwater
                                             then a near-equilibrium state. Fer-     contamination Æ Nitrate Æ
W. Reyes-Borja Æ N. Tase Æ A. Gallardo
School of Life and Environmental Sciences,
                                             tilizer applications are responsible    Agriculture Æ Fertilizers Æ
University of Tsukuba, Tennodai 1-1-1,       for most of the leaching of NO) to
                                                                              3      Tsukuba City Æ Ibaraki
Ibaraki 305-8572, Japan                      groundwater, therefore, shifting of     prefecture Æ Japan


Introduction                                                    for water supply. The lack of information emphasizes
                                                                the need to urgently evaluate the sources and extent of
Nitrate contamination is responsible of several diseases        NO) pollution in the region in order to develop the
                                                                    3
as hypertension, cancer and birth defects (Spalding and         correspondent control and management strategies. As
Exner 1993) thereby, a maximum of 45 mg/l for drink-            the movement of solutes in groundwater is a three-
ing purposes is worldwide accepted (WED 2001). As in            dimensional process influenced by a multitude of vari-
other parts of the world, there is evidence that NO)     3      ables with complex functions and interactions, it seldom
concentrations in many aquifers of Japan are assuming           can be overcome even by an extensive monitoring net-
serious dimensions as a direct consequence of the               work, so a simulation model may provide important
intensification of agricultural activities (Ii et al. 1997;      additional information (Uffink and Romkens 2001).
                                                                                                          ¨
Mohamed et al. 2003; Tase 2004). However, despite               Although the model results are influenced by a relative
being the most densely populated and economically               uncertainty, they provide a framework for synthesizing
most productive district of Japan, very little is known         field information and for testing ideas about how the
about the conditions in shallow groundwater within the          system works (Woessner and Anderson 1994). Thus, the
agricultural belt surrounding the Tokyo metropolis.             present research complements geochemical information
Contamination in this area causes particular concern            with a finite-difference numerical simulation with the
because of its proximity to urban centers, and the              objective of generating quickly and at a relatively low
important number of people still relying on groundwater         cost, a first base model, which can help the authorities in
909


the implementation of proper environmental policies.         area includes both a flatland with a maximum of 28 m
While this might have been done elsewhere, this is the       above mean sea level in the south, and a poorly drained
first time it has been carried out in this part of Japan.     lowland ranging from 22 to 16 m in the north. Steep
Moreover, understanding the patterns and rates of            slopes and valleys develop in between. A stream runs
groundwater flow is essential to investigating the            along most of the western edge of the site, while an open
migration of contaminants in the system (Buxton and          drain on the north removes the excess of water to the
Modica 1992), so the paths of groundwater flow were           Sakura River, about 1 km north of the area of study.
determined as a preliminary step. At last, a simple          Agriculture is the dominant land use in the uplands
exercise was performed under some hypothetical situa-        (Fig. 1). About 46% of the cultivated land is devoted to
tions to gain insight into the sensitivity of aquifer con-   pastures, while Chinese cabbage and wheat occupy a
tamination to agricultural activities.                       respective 15 and 10% of this land. Most of the
   Finally, it must be said that the selection of a small    remaining portion of the arable land is covered by a
catchment allowed retaining enough complexity to             forest or occasionally, partially cultivated with seasonal
analyze the most relevant processes under various land       crops. Given the small size of these parcels and the
uses and hydrological conditions, being still small en-      limited fertilizer application they can be neglected from
ough to cope with the availability of observations and       the analysis. According to the farmers’ information,
measurements.                                                inorganic fertilizers N:P:K 14–15% and urea CO(NH2)2
                                                             N-45% are applied for the three main crops at rates
                                                             according to the type of plant (Table 1), while
Site description                                             Ca(Mg)CO3 is added to neutralize soils acidification.
                                                             Aside from an orchard within the largest valley corridor,
The site corresponds to a watershed of about 400 by          the slopes and lowlands are not suitable for cultivation.
300 m within the Tamatori district in Tsukuba City,             The 3- to 4-m thick sands of the Ryugasaki Fm
approximately 60 km northeast of Tokyo, Japan. The           constitute the upper aquifer in the area. On the other


Fig. 1 Land use and monitor-
ing network in the area of study
910


Table 1 Agricultural management of the main crops in the area

Crop                Planting                  Harvest           Liming-fertilization      Type             Amount (kg/ha)

Wheat               Late February             Mid June          End February              N:P:K 14%        400
                    –                         –                 Mid October               Ca (Mg) CO3      10
                    Early November            Early February    Early November            N:P:K 14%        400
Chinese cabbage     –                         –                 Early February            Ca (Mg) CO3
                    Late Feb/early March      Early June        Late Feb/early March      N:P:K 15:15:10   1,000
                    –                         –                 Late March /early April   Urea N 45%       400
                                                                Early August              Ca (Mg) CO3
                    Mid August                End November      Mid August                N:P:K 15:15:10   1,000
                    –                         –                 Mid September             Urea N 45%       400
Grass                                                           April to August           CaCO3
                    April                     September         April to August           N:P:K 14%        380 (monthly)


hand, sands of the Narita Fm conform a deeper aquifer           1999), was used to simulate the evolution of NO) in
                                                                                                               3
with a thickness no less than 5 m beneath the uplands,          groundwater for a period of 10 years.
reducing to 1–3 m toward the lowlands. Both aquifers
are separated by a clay/sand aquitard, which disappears
by erosion at the slopes. A silt layer that acts as an          Results and discussion
aquiclude is the local basement of the system.
                                                                Groundwater chemistry

Materials and methods                                           Shallow waters around the cultivated fields are high
                                                                in ions typical of agricultural settings, especially NO)3
A transect of 23 multilevel wells along the expected            and SO2) (r=0.75), with a subordinated enrichment in
                                                                         4
direction of shallow groundwater, and 20 additional             Mg2+ as well (Fig. 2). More than 75% of the samples
wells distributed all over the area allowed for sampling        registered concentrations of NO) exceeding the maxi-
                                                                                                   3
of groundwater and parameters determination. Samples            mum recommended values of 45 mg/l. Under condi-
were collected approximately on a monthly basis for             tions of high oxygen and water solubility, part of the
over 1 year, and analyzed for major cations and anions          ammonium sulfate ((NH4)2SO4) and the urea
following standard methods.                                     (CO(NH2)2) applied on the ground would be rapidly
   Other samples were also collected on the drain and           converted into NO) which, is not sorbed to the neg-
                                                                                     3
stream’s waters, and their stage measured at different           atively charged sites on soil colloids and moves readily
discharge rates both in summer and winter to be used as         to the water table (Follet 1995). Furthermore, the high
input data in the simulation.                                   correlation between Ca2+ and Mg2+ (0.84) would
   Runoff was measured at the main slope by leading it           result from the addition of dolomite [CaMg(CO3)2]. In
into a single collecting tank. In the absence of direct         contrast, there is a relative depletion of dissolved ele-
measurements, evapotranspiration was interpolated               ments beneath the forest associated to the absence of
from the literature according to the land cover, while          agricultural activities; mean NO) concentrations de-
                                                                                                     3
mean precipitation in Tsukuba City was derived from             creased in almost 55% with respect to the croplands,
the AMEDAS database, of public domain.                          and only 23% of the samples showed values above the
   Hydraulic conductivity was determined by slug tests,         maximum drinking standards. Moreover, there is a
and other soil physical parameters obtained through             drastic depletion of NO) near the wetland and the low
                                                                                         3
core samples.                                                   reaches of valley corridors, where denitrification would
   The three-dimensional flow of groundwater was                 be occurring (Sugawara 2004; Gallardo and Tase
simulated under steady-state using the finite-difference          2005).
program MODFLOW (McDonald and Harbaugh                             Unlike shallow waters, deep groundwater presents
1988). It was coupled with the particle tracking code           low salinity and is characterized by a dominance of
MODPATH (Pollock 1989), utilized to calculate flow               HCO) and Ca2+, probably explained by the dissolution
                                                                      3
paths and travel times of specified groundwater parti-           of calcite/dolomite in a closed system (Apello and
cles. In addition, the model was manually optimized             Postma 1993). Under this situation infiltrating water
adjusting the values of several parameters, and then            becomes charged with CO2 from the soil–atmosphere
calibrated through the use of the parameter estimator           zone, and upon percolation it comes in contact with
PEST (Doherty et al. 1994). Finally, the modular multi-         calcite in the deep aquifer, in a zone isolated from the
species transport model MT3DMS (Zheng and Wang                  gaseous source:
911


Fig. 2 Mean groundwater
quality throughout the area


                                                             most unit extends from the surface to the bottom of the
CO2 ðgÞ þ H2 O þ CaCO3 $ Ca2þ þ 2HCOÀ
                                    3                 ð1Þ
                                                             Ryugasaki aquifer. It was simulated as confined in the
 Thus, the dissolution of calcite adds Ca2+ to the solu-     uplands to unconfined in the lowlands. The underlying
tion, and the final concentration results in waters rich in   sequence of interbedded sands and clays was modeled as
both calcium and bicarbonate. Even though the validity       three units: (1) an upper layer representing the top lenses
of the hypothesis above, evidence suggests that at least     of sand, (2) a layer which constitutes the main aquitard
part of the HCO) would be a direct result of denitrifi-
                  3                                          between aquifers, and (3) a basal unit representing the
cation reactions taking place within the deep aquifer        lower sand lenses, with properties similar to the unit
(Gallardo and Tase 2005), probably occurring in small        described in (1). As these units disappear at the slope,
zones (microcosms) in the subsurface where oxygen has        the simulation was handled by reducing the layers
been completely removed (Cey et al. 1999). The pro-          thickness as much as possible in the lowlands, and by
duction of HCO) decreases the pH and increases the
                  3                                          accommodating their properties to the ones of the local
solubility of carbonate minerals, explaining then the rise   sediments. The fifth layer represents the sands of the
in Ca2+ concentrations (Kelly 1997).                         deep aquifer, and the lowermost unit in the model cor-
                                                             responds to the silt basement.
                                                                The system was divided in a nonuniform grid of 68
Flow and transport model                                     rows and 69 columns, and the active cells were limited by
                                                             physical and hydraulic boundaries selected far enough
Conceptual model                                             from the main transect so as not to influence the results
                                                             in the area of interest (Fig. 4). Physical boundaries in-
The conceptual model defined for the simulation con-          clude both the drain and stream. The southern border of
sists of six hydrogeological layers (Fig. 3). The upper-     the model was coincident with the groundwater divide,
912


Fig. 3 Schematical block dia-
gram of the conceptual model


Fig. 4 Model boundaries and
discretization


deduced from the general hydrologic maps. No flow   Dirichlet condition were selected at certain locations.
boundaries were defined for most of the remaining   Even though steady-state conditions assume that heads
boundaries, although specified head boundaries of   do not change with time, some small variations can
913


Table 2 Inputs for the flow simulation                                                  26

Geological framework         Topography
                             Layers geometry                                           24


                                                                Calculated Heads (m)
Boundary conditions          Rivers–swamps
                             Constant head—no flow cells                                22
                             Groundwater divide
                             Initial heads
                             Surface water stage                                       20
Recharge                     Precipitation
                             Overland flow
                             Evapotranspiration                                        18
Hydrological properties      Hydraulic conductivity
 of materials                 of sediments                                             16
                             Vertical hydraulic
                              conductivity of streambeds
                             Effective porosity                                         14
                             Channels geometry and dimensions                               14   16      18     20     22     24    26
                             Elevation of canals bottom
                                                                                                      Observed Heads (m)

                                                                Fig. 5 Calculated versus observed heads
anyway be expected and therefore, specified head
boundaries were introduced only to mimic the water              except the upper one, which can be considered accurately
table contours, without consideration of their absolute         known due to the larger amount of measurements, in
values.                                                         order to match heads between observed and simulated
                                                                conditions. There was a good agreement for all heads
Flow model inputs                                               except at one well near the slopebreak, where the model
                                                                calculation was severely underestimated (Fig. 5). This
Inputs for the groundwater model included the topog-            high residual resulted from the uncertainties in the local
raphy of the surface and the hydrogeological units,             geology beyond the bottom of the well. In addition, the
geometry of the canals, sediment properties, initial            small error in the mass balance over the entire domain
heads, and recharge (Table 2). A constant hydraulic             (0.02%) is another key indicator of the success of the
conductivity was applied at each one of the layers except       simulation, as it is acceptable provided it is less than
for the upper unit, where the several measurements              0.5% (Reilly and Harbaugh 2004). Finally, the model
available allowed for obtaining a distributed value of the      adequacy was investigated through the normalized root
parameter. Conductivity within the uplands is almost            mean squared (NRMS), calculated by dividing the root
uniform in the range of 5·10)5 cm/s, but there is a             mean squared (RMS) or standard deviation by the
substantial decrease down the hillslope (4·10)7 cm/s)           maximum difference in the observed heads:
associated to a better aggregation of the sands. For most
of the lowlands, horizontal conductivity averages                                                                      RMS
                                                                Normalized RMS ¼                                                         ð2Þ
9·10)4 cm/s. On the other hand, recharge was incorpo-                                                         ðxobs Þmax À ðXobs Þmin
rated by dividing the area into four zones according to
the type of land use/cover (croplands, forest, wetland,           An acceptable value of NMRS is less than 10%
slopes). Each zone has different evapotranspiration rates        (Waterloo Hydrogeological 2003), satisfied by the model
(ET) that condition the amount of water reaching the            estimation of 8.3%. Moreover, the value reduces to
aquifers therefore, recharge was set as the difference           6.7% when the anomalous well is disregarded from the
between the mean annual precipitation fallen over the           analysis.
region since 1991, and ET losses estimated under similar
conditions in neighbor areas. Runoff measured on the             Groundwater flow patterns
slopes was considered also as a recharge loss. Calcula-
tions resulted in recharge rates of 735 mm/year within          The simulated flow of groundwater is south to north in
the cultivated fields, 628 mm/year in the forest, 610 mm/        the uplands, and southwest–northeast downward the
year on the slopes, and 229 mm/year within the wetland.         slopes (Fig. 6). Heads range from about 25.5 m at the
                                                                divide to 15 m by the drainage. As expected, the
Flow model calibration                                          groundwater gradient is smooth at the uplands, with a
                                                                decline of only 3.5 m in 245 m of distance, but increases
After evaluating the reasonability of the conceptual            drastically when reaching the slope and lowlands. The
model, automatic calibration was carried out by adjust-         drain canal is the main sink in the system, characterized
ing the values of hydraulic conductivity for all layers         by both ‘‘far-recharge’’, and ‘‘near-recharge’’ fluxes
914


Fig. 6 Groundwater heads and
velocity distribution


(Modica et al. 1997). Far-recharge particles are re-          no attempts to strictly calibrate the transport model, and
charged as far as the groundwater divide, traveling in the    only a trial-and-error analysis was conducted to refine
longest flowpaths up to 63 years. In contrast, near-re-        the non-uniqueness of the results, and find a reasonable
charge water is characterized by short pathways dis-          match between calculations and NO) concentrations for
                                                                                                     3
charging relatively close to its source, with an age rarely   a set of wells within the wetland and some valley corri-
exceeding 6 months.                                           dors. Thus, although the simulation calculated the
    Groundwater beneath the uplands is mainly re-             plume migration, it only provided rough estimates of
stricted to two systems that follow predominantly             concentrations values. Despite the simulation is simple
horizontal flowpaths, and converge at the foot of the          and easy to apply, it fits the purposes of the research,
slopes. In contrast, the flow component is upward at the       and does not lose applicability in the determination of
lower edge of the lowlands, where the successive water        NO) movement through the system under investigation.
                                                                   3
fronts merge and discharge together. In addition, in spite        The contaminant background in groundwater was set
the clay/sand unit beneath the uplands acts as a sort of      as zero due to the absence of previous data. Geochem-
barrier, a part of the inflows is able to migrate into the     istry indicated a fertilizer source for the bulk of solutes
deep units, confirming then the partial connection be-         in groundwater, so the NO) input was modeled by
                                                                                              3
tween aquifers.                                               specifying those concentrations obtained within the
                                                              water table at each well in the fertilized land. Concen-
                                                              trations were apportioned all over the farms by assign-
Nitrate model inputs                                          ing to each cell in the upper layer the value registered at
                                                              the closest well on the correspondent sampling event.
The main concern stems from the evolution of the plume        When the cell was equally influenced by several wells,
in the near future so, the transport of NO) was simu-
                                            3                 the values were linearly interpolated. By this method, the
lated for an arbitrary period of 10 years from the            model calculated the transport of NO) already in
                                                                                                           3
beginning of the study. Since calculations were based on      groundwater without concern about the processes in the
several (though quite rigorous) assumptions, there were       unsaturated zone. It was assumed the type of crops and
915


fertilizers, and the leaching rate of NO) to the water
                                            3                       over a large part of the upper aquifer, where leaching
table, will be constant from the start of the simulation to         from fertilizers results in anomalous concentrations of
10 years onwards.                                                   NO), which is thermodynamically stable under the
                                                                        3
   Local longitudinal dispersivity (aL) in well-sorted              prevailing oxic conditions (Fig. 7). Maximum pollution
homogeneous materials is approximately equal to the                 occurs beneath the cultivated fields, and spreads down-
mean grain size (Bear 1979). However, it is higher for              gradient to the north through the valleys on the east of
non-uniform distributions (Houseworth 1984). Then,                  the domain. The plume partially reaches the orchard and
the dispersivity in the aquifers was calculated as twice            the edges of the wetland, but vanishes almost totally
the mean size measured for the sediments (Jussel et al.             below the forest, supporting the hypotheses inferred
1994), from 1.1 to 3.1 mm. Horizontal transverse dis-               from the field observations. In addition, there is a sharp
persivities and vertical dispersivity were considered as            decrease in concentrations at a depth approximately
aL /10 and aL /100, respectively (Gelhar et al. 1992).              coincident with the base of the clay aquitard beneath the
   The denitrification process was simulated as a reac-              uplands, and the top of the Narita aquifer downgradi-
tion of first-order decay:                                           ent. The model predicted that the NO) plume com-
                                                                                                               3
                                                                    pletely disappears throughout the deep aquifer, except
CðtÞ ¼ C0 expðÀktÞ                                            ð3Þ   for the presence of an elongated lobe of low concen-
 where C0 refers to the initial concentration and k cor-            trations approximately 140·15 m along the breakslope
responds to the decay rate [1/T]. Instead of k, the rate of         on the eastern margin of the domain, and a few isolated
decay is often expressed by the half-life time (Uffink and            patches east of the wetland. The displayed patterns show
Romkens 2001) which, was obtained from previous
   ¨                                                                that although the clay unit effectively prevents the
works. The rate of NO) degradation was a fitting
                          3
                                                                    migration of pollutants to depth, the transport of NO)  3
parameter, where several models were run until finding               to the deep layers would be facilitated downgradient the
the most reasonable scenario between two extremes: no               slopes as the aquitard thins, and both aquifers become in
degradation, to a scenario of maximum decay rate with               free connection. In this case, the absence of a physical
a half-life of 17 days (Jansson et al. 1991). The most              barrier is compensated by conditions more favorable for
satisfactory match was finally obtained for a NO) half-
                                                    3
                                                                    attenuation, which determine that NO) is essentially
                                                                                                              3
life between 180 and 270 days.                                      depleted throughout the lower aquifer.

Patterns of nitrate concentration                                   Nitrate mass removal

In coincidence with chemical data, the simulation                   The total amount of NO) remaining in groundwater as
                                                                                          3
showed that the highest levels of contamination extend              contamination, and the portion eliminated through


a                                                                   b


Fig. 7 Nitrate distribution: a top aquifer; b basal aquifer
916


Table 3 Sources of NO) to groundwater after 10 years
                     3                                               it, denitrification along the channels would have a neg-
                                                                     ligible effect on the overall attenuation of pollution.
Fertilizers   Simulated NO)   Agricultural-   Natural   Fertilizer
N load in     input to
                          3
                              derived NO)     NO)       leaching
                                                                     Considering a half-life between 180 and 270 days, re-
                                                                     moval of NO3 ) by denitrification results in 3.8 to 4.6%
                                         3        3
surface       groundwater     (kg)            (kg)      (%)
(kg)          (kg)                                                   of the total amount entering groundwater. Depletion
                                                                     would peak in the first few meters of groundwater flow
11,605        9,656           7,212           2,444     62.1         through the valley corridors and wetland and therefore,
                                                                     there still would be a significant potential for NO)       3
                                                                     reduction, since a large portion of these sites would not
denitrification were determined by means of a mass                    be actively denitrifying due to the lack of NO) in    3
balance. Sources of NO) included leaching from the
                            3
                                                                     groundwater (Gallardo and Tase 2005).
ground, while sinks were represented by outflows                          A simple way to verify the accuracy of the calcula-
through the drainage and stream, and denitrification.                 tions consisted in comparing those concentrations
Other factors were not a need since NO) fluxes were
                                            3
                                                                     measured within the stream and drainage, with the mean
calculated exclusively for the groundwater system. The               NO) value simulated to leave the system through these
                                                                          3
model estimated that 9,656 kg of NO) leached to
                                            3
                                                                     sinks after reaching the near-equilibrium. The calculated
groundwater after 10 years. Based on the background                  flow of groundwater discharged out of the domain is
concentrations measured beneath the forest, 2,444 kg of              614,745 m3, while the NO) in the outflow totalized
                                                                                                   3
this NO) (25.2% of the total) were estimated to be of
          3
                                                                     8000.6 kg. Thus, at the actual rates the aquifer is ex-
natural origin therefore, the leaching from fertilizers              pected to release an average of 13 mg/l of NO) during
                                                                                                                       3
would correspond to 62% of the total N loads in the                  the period. This value presents an excellent fit with the
surface (Table 3).                                                   mean of NO) obtained at the upstream reaches of the
                                                                                   3
    The accumulation of NO) within groundwater grew
                               3
                                                                     drainage (12 mg/l), and a satisfactory agreement with
exponentially during the first 594 days of the simulation,            the remaining sampling points (14.5–19.7 mg/l). Calcu-
and then tended to reach a near-equilibrium situation                lated concentrations in the groundwater outflow are
(Fig. 8). As a whole, the stream and the drainage dis-               usually smaller than the mean of the observations which,
charge 77.5% of the NO) inputs, while the rest is par-
                            3
                                                                     is attributed to the fact that the channels (especially the
tially eliminated through denitrification or remain in the            artificial drain), are flushing waters from neighbor areas
system as contamination. The maximum degradation                     beyond the study site.
that can be expected under optimum conditions (half-life
of 17 days) is 7.7% of the leached NO). On the other
                                          3                          Implications for land management
hand, the possibility of high-rates of denitrification in
the vicinities of the streams’ banks and some other areas            As reported by Feng et al. (2005) NO) levels in
                                                                                                                   3
surrounding the wetland, were mentioned by Sugawara                  groundwater increase significantly after certain agricul-
(2004) therefore, a simulation extending the process to              tural activities as for example irrigation or fertilization,
these zones was undertaken. The model was little af-                 so it is clear that the water quality of the region will
fected by the modifications made, with an increase in the             continue to be threatened unless a more suitable scheme
removal efficiency of only 0.8% with respect to the ori-               of nitrogen inputs and management practices is applied.
ginal scenario. These results suggest that given the scale              More than half of the N contributions over the
of the catchment and the amount of NO) flowing within
                                          3                          catchment are derived from the pastures fields, so


Fig. 8 Cumulative mass of
NO) as a function of time
    3
917


Table 4 Simulated mass                                 Fertilizer     Leaching    Inputs   Outflows      Mass in       Contamination
balance of NO) after 10 years,
               3                                       load (kg N)    (kg)        (%)      through      groundwater   level (%)
under some hypothetical                                                                    sinks (kg)   (kg)
scenarios of agricultural
management                       Actual conditions     11,605         9,656       100      8,791        866           100
                                 Grass into wheat      8,057          7,872       82       7,086        787           91
                                 Grass into cabbage    20,700         8,919       92       8,060        858           99
                                 Grass into cabbage    10,173         7,048       73       6,320        755           87
                                 (no urea additions)


shifting them into other crops with more uptake of NO)      3        families can rapidly germinate and establish an extensive
might be an alternative to reduce leaching to ground-                root system, many of the crops have good winter-har-
water. The root zone of the pastures is a very thin layer            diness and exhibit vigorous spring regrowth, and accu-
(15 cm approximately) that permits an easy migration of              mulate sizeable amounts of dry matter and N
N into groundwater, requiring then for a surplus of                  (Hermanson et al. 2000). In addition, actively growing
fertilizers to compensate for what cannot be taken by the            cover crops transpire soil water, reducing the rate of
plants. Thus, additional NO) balances were calculated
                               3                                     recharge and the potential for NO) leaching (Wagger
                                                                                                             3
for the 10-year period to gain an insight of what would              and Mengel 1988). Recovery rates for some Brassica
happen in case the pastures were totally shifted to wheat            were estimated to range from 18 to 96% in the top
or Chinese cabbage. Moreover, urea constitutes about                 25 cm of soil and from 26 to 98% in the top 50 cm of
54% of the N loads for cabbage, so a third scenario                  soil (Smith et al. 1988).
considering its suppression was explored. The NO) in-  3                In addition, the importance of urea in the growth and
puts for the new scenarios were generated after extrap-              yield of Chinese cabbage must be carefully analyzed,
olating the groundwater concentrations already                       since its suppression results in further reductions of the
measured for a certain crop, into those fields that shifted           contamination. Leaching of NO) to groundwater re-
                                                                                                          3
to the same type of plant. It was assumed that the time              duces in nearly 27%, and the total mass finally
and rates of fertilizer application for a given crop will            remaining in the aquifers drop in about 12% respect the
not change over time.                                                actual situation.
   Replacing grass by wheat has a limited effect. Despite                The findings above suggest that there is an opportu-
there is a reduction of 31% in the fertilizer amounts, and           nity to manipulate the NO) exports by altering the type
                                                                                                   3
of 18% in the NO) mass leaching to the aquifer, con-
                    3                                                of crop and indirectly, the management techniques. Al-
tamination levels decreases in only 4.3% respect the                 though there are no great reductions in NO) losses  3
actual situation (Table 4). In other words, the reduction            during the studied period, management strategies will
in NO) inputs is not corresponded with an equivalent
        3                                                            result in a more effective control of contamination in the
decrease of pollution, probably because of a more lim-               long term. The simple conversion of grasslands into
ited nutrient absorption by the wheat plants in relation             wheat or Chinese cabbage is not enough to restrict NO)       3
to grass, and because of the more limited degradation                losses to the water table, however, a more effective
rates within the aquifers at the time of the fertilization           control is achieved when eliminating the urea additions
(February–November).                                                 as well. The economical and the agronomic viability
   Converting pastures into cabbage requires and addi-               must be evaluated in order to assess the real possibilities
tional of 1,820 kg/year of fertilizer, however, there is still       of this practice. Inter-planting tillage has also been
certain reduction (8%) in the mass of leaching, and a                shown to be an effective measure to control groundwater
decrease of about 3% in the NO) amounts finally
                                         3                           pollution (Feng et al. 2005). In addition, the application
remaining in the aquifer. These reductions might be                  of optimized minimum amounts of water and nitrogen
explained by the higher uptake efficiency of the cabbage               to meet realistic yield goals, as well as the timely appli-
plants with respect to grass: although recovery of ap-               cation of fertilizers, and the use of slow release fertilizers
plied N by turfgrass reaches a maximum of 74% (Pet-                  can be viable measures to minimize NO) leaching. The
                                                                                                                 3
rovic 1990), it does not have much anion exchange                    analyzed alternatives scenarios are hypothetical cases
capacity within the root zone and therefore, NO) moves
                                                   3                 that only illustrate how developments of agriculture
easily with the percolating water, in some cases very                practices may reduce NO) inputs to the water system,
                                                                                                  3
rapidly (Camberato 2001). In contrast, Chinese cabbage               but it must be emphasized that the approach is only an
(Brassica campestris) is a cover crop, plants able to re-            exercise providing a preliminary insight into land man-
cycle N and reduce leaching losses and groundwater                   agement implications, and need further development to
contamination (Hermanson et al. 2000). The Brassica                  improve its resolution.
918


Summary and conclusions                                               for the rest of the analyzed period. Even though the
                                                                      system approximated to a near-equilibrium situation,
A simple three-dimensional model incorporating deni-                  groundwater storage is still below its saturation level,
trification was developed to assess the patterns and                   which means NO) contamination may still grow further
                                                                                         3
evolution of NO) in groundwater for a period of
                    3                                                 if there are no reductions in the inputs. The appearance
10 years. Determination of the geologic framework and                 of NO) in groundwater would be essentially dependent
                                                                              3
groundwater pathways was a necessary step before                      on fertilizer applications and its subsequent leaching
proceeding to the investigation of contaminant trans-                 therefore, manipulation of the type of crops and man-
port. Simulated and observed heads within the area are                agement techniques within specific areas of the catch-
in good agreement, confirming the validity of the flow                  ment translates into a decrease in contamination levels.
model. In contrast, the transport simulation focused in               Shifting pastures into wheat or Chinese cabbage resulted
providing an insight into the migration of NO) in      3              in a slight reduction of the nutrient inputs to ground-
groundwater, without concern about absolute concen-                   water but, a maximum drop of 12% in the pollution
trations.                                                             levels are achieved when urea additions are also sup-
   The simulation predicted that a maximum 7.7% of                    pressed.
the influx of NO) into the aquifers can be degraded.
                   3                                                      In spite conclusions are not definitive the simulation
Depletion may reach 8.5% of the inputs when extending                 does not lose applicability, and still constitutes a quick
the denitrification process to the channels’ banks.                    and relatively inexpensive tool to get a preliminary
However, a removal of 3.8 to 4.6% of the NO) leaching
                                                 3                    understanding of the system dynamics. The present
over the entire area seems to be a more realistic esti-               investigation may therefore serve as a guide for future
mation. Since it is likely that the wetland zone is capable           studies within the area.
of removing larger applications of NO), the estimated
                                          3
removal capacity would be somewhat conservative.                      Acknowledgements The authors wish to thank the Ministry of
   Groundwater contamination rose sharply during the                  Education, Culture, Sport, Science and Technology of Japan for
                                                                      providing the financial support to carry out the present research.
first 594 days of the simulation, but tended to stabilize


References

Apello CAJ, Postma D (1993) Geochemis-        Follet RF (1995) Fate and transport of          Ii H, Hirata T, Matsuo H, Nishikawa M,
   try, groundwater and pollution. Balk-         nutrients:nitrogen. USDA, Agricultural           Tase N (1997) Surface water chemistry,
   ema, Rotterdam                                Research Service, Soil-Plant-Nutrient            particularly concentration of NO) and
                                                                                                                                     3
Bear J (1979) Hydraulics of groundwater.         Research Unit, Working Paper No. 7:p             DO and d15 N values, near a tea plan-
   McGraw-Hill, New York                         33                                               tation in Kyushu, Japan. J Hydrol
Buxton HT, Modica E (1992) Patterns and       Gallardo AH, Tase N (2005) Role of small            202:341–352
   rates of ground-water flow on Long Is-         valleys and wetlands in attenuation of a     Jansson PE, Eckersten H, Johnsson H
   land, New York. Groundwater                   rural-area groundwater contamination.            (1991) SOILN model, user’s manual.
   30(6):857–866                                 In: Heathwaite L (ed) Dynamics and               Department of Soil Science, Swedish
Camberato JJ (2001) Nitrogen in soils and        biogeochemistry of river Corridors and           University of Agricultural Science, Up-
   fertilizers. SC Turfgrass Found News          Wetlands. IAHS Publ 294, pp 86–92                sala
   8(1):6–10                                  Gelhar LW, Welty C, Rehfeldt KR (1992)          Jussel P, Stauffer F, Dracos T (1994)
Cey EE, Rudolph DL, Aravena R, Parkin            A critical review of data of field-scale          Transport modeling in heterogeneous
   G (1999) Role of the riparian zone in         dispersion in aquifers. Water Resour             aquifers: Statistical description and
   controlling the distribution and fate of      Res 28(7):1955–1974                              numerical generation of gravel deposits.
   agricultural nitrogen near a small         Hermanson R, Pan W, Perillo C, Stevens              Water Resour Res 30(6):1803–1817
   stream in southern Ontario. J Contam          R, Stockle C (2000) Nitrogen use by          Kelly WR (1997) Heterogeneities in
   Hydrol 37:45–67                               crops and the fate of nitrogen in the soil       ground-water geochemistry in a sand
Doherty J, Brebber L, Whyte P (1994)             and vadose zone. a literature search.            aquifer beneath an irrigated field.
   PEST—Model independent parameter              Washington State University and                  J Hydrol 198:154–176
   estimation User’s manual. Watermark           Washington Department of Ecology             McDonald MG, Harbaugh AW (1988) A
   Computing, Australia                          Interagency Agreement No. C9600177,              modular three-dimensional finite-differ-
Feng ZZ, Wang XK, Feng ZW (2005) Soil            Publication No. 00-10-015, Washington            ence groundwater flow model. Tech-
   N and salinity leaching after the autumn   Houseworth JE (1984) Longitudinal dis-              niques of Water Resources
   irrigation and its impact on groundwa-        persion in non-uniform isotropic por-            Investigations of the U.S. Geological
   ter in Hetao Irrigation District, China.      ous media, Rep KH-R-45, WM Keck                  Survey, Book 6
   Agric Water Manag 71:131–143                  Lab, Calif Inst of Technol, Pasadena
919


Modica E, Reilly TE, Pollock DW (1997)          Smith CJ, Wright GC, Wooroofe MR               Water Environmental Department (2001)
    Patterns and age distribution of               (1988) The effect of irrigation and             Water environment management in Ja-
    ground-water flow to streams.                   nitrogen fertilizer on rapeseed (Brassica      pan. Environmental Management Bu-
    Groundwater 35(3):523–537                      napus) production in southeastern              reau, Ministry of the Environment,
Mohamed AAM, Terao H, Suzuki R,                    Australia II Nitrogen accumulation and         Tokyo, Japan
    Babiker IS, Ohta K, Kaori K, Kato K            oil yield. Irrig Sci 9:15–25                Waterloo Hydrogeologic Inc (2003) Visual
    (2003) Natural denitrification in the        Spalding RF, Exner ME (1993) Occurrence           MODFLOW v 3.1 User’s Manual.
    Kakamigahara groundwater basin,                of nitrate in groundwater—a review.            Ontario, Canada
    Gifu prefecture, central Japan. Sci. To-       J Env Qual 22:392–402                       Woessner WW, Anderson MP (1994) Ap-
    tal Environ 307:191–201                     Sugawara Y (2004) Three-dimensional               plied groundwater modeling. Simula-
Petrovic AM (1990) The fate of nitrogenous         nitrate dynamics in groundwater at the         tion of flow and advective transport,
    fertilizers applied to turfgrass. J Envi-      edge of upland. MSc Thesis, University         2nd edn. Academic Press, New York
    ron Qual 19:1–14                               of Tsukuba, Ibaraki, Japan. (in             Zheng C, Wang P (1999) MT3DMS, A
Pollock, DW (1989) Documentation of                Japanese)                                      modular three-dimensional multi- spe-
    computer programs to compute and            Tase (2004) Groundwater contamination             cies transport model for simulation of
    display pathlines using results from the       by nitrate and nitrite. Environ Manage         advection, dispersion, and chemical
    U.S. Geological Survey Modular Three-          40(3):47–55                                    reactions of contaminants in ground-
    Dimensional Finite-Difference Ground-        Uffink GJM, Romkens PFAM (2001) Ni-
                                                                  ¨                               water systems: documentation and
    Water Model, USGS Open File Report             trate transport modeling in deep aqui-         user’s guide. U. S. Army Corps of
    89–381                                         fers. Comparison between Model                 Engineers, US. Army Engineer Re-
Reilly TE, Harbaugh AW (2004) Guide-               results and data from the groundwater          search and Development Center,
    lines for evaluating ground-water flow          monitoring network. RIVM-report                Vicksburg, Mississippi, SERDP-99-1
    models: US Geological Survey Scientific         711401010, Bilthoven
    Investigations Report 2004–5038, p 30       Wagger MG, Mengel DB (1988) The role of
                                                   nonleguminous cover crops in the effi-
                                                   cient use of water and nitrogen. In:
                                                   Cropping Strategies for efficient use of
                                                   water and nitrogen. Special pub. no. 51.
                                                   ASA-CSSA-SSSA, Madison, Wiscon-
                                                   sin, pp 115–127

Weitere ähnliche Inhalte

Was ist angesagt?

Assessment of the effects of Acid Mine Drainage on Mogpog River Ecosystem, Ma...
Assessment of the effects of Acid Mine Drainage on Mogpog River Ecosystem, Ma...Assessment of the effects of Acid Mine Drainage on Mogpog River Ecosystem, Ma...
Assessment of the effects of Acid Mine Drainage on Mogpog River Ecosystem, Ma...No to mining in Palawan
 
Annual review presentation_Rahnum_2200HRS10JUN2015_Final
Annual review presentation_Rahnum_2200HRS10JUN2015_FinalAnnual review presentation_Rahnum_2200HRS10JUN2015_Final
Annual review presentation_Rahnum_2200HRS10JUN2015_Finaltasnuva nazmul
 
investigative study of seasonal changes
investigative study of seasonal changesinvestigative study of seasonal changes
investigative study of seasonal changesIJAEMSJORNAL
 
C2VSim Workshop 3 - C2VSim Land Surface Representation
C2VSim Workshop 3 - C2VSim Land Surface RepresentationC2VSim Workshop 3 - C2VSim Land Surface Representation
C2VSim Workshop 3 - C2VSim Land Surface RepresentationCharlie Brush
 
Ground Water Conditions and Major-Ion Hydrogeochemistry of the Benin Formatio...
Ground Water Conditions and Major-Ion Hydrogeochemistry of the Benin Formatio...Ground Water Conditions and Major-Ion Hydrogeochemistry of the Benin Formatio...
Ground Water Conditions and Major-Ion Hydrogeochemistry of the Benin Formatio...iosrjce
 
Ebong groundwater assessment aws
Ebong groundwater assessment awsEbong groundwater assessment aws
Ebong groundwater assessment awsEbong Dickson
 
Factors influencing the distribution and abundance of Daphnia middendorffiana...
Factors influencing the distribution and abundance of Daphnia middendorffiana...Factors influencing the distribution and abundance of Daphnia middendorffiana...
Factors influencing the distribution and abundance of Daphnia middendorffiana...University of the Highlands and Islands
 
Spatial distribution and environmental geochemistry of zinc metal in water an...
Spatial distribution and environmental geochemistry of zinc metal in water an...Spatial distribution and environmental geochemistry of zinc metal in water an...
Spatial distribution and environmental geochemistry of zinc metal in water an...Javier Quesada Duque
 
An Evaluation of Heavy Metals Concentration in the Choba Section of the New ...
An Evaluation of Heavy Metals Concentration in the Choba  Section of the New ...An Evaluation of Heavy Metals Concentration in the Choba  Section of the New ...
An Evaluation of Heavy Metals Concentration in the Choba Section of the New ...Scientific Review SR
 
UROP Finals Poster_Junior_Mazariegos
UROP Finals Poster_Junior_MazariegosUROP Finals Poster_Junior_Mazariegos
UROP Finals Poster_Junior_MazariegosJunior G. Mazariegos
 

Was ist angesagt? (14)

Eops 2012 02_27
Eops 2012 02_27Eops 2012 02_27
Eops 2012 02_27
 
Cy24649654
Cy24649654Cy24649654
Cy24649654
 
Assessment of the effects of Acid Mine Drainage on Mogpog River Ecosystem, Ma...
Assessment of the effects of Acid Mine Drainage on Mogpog River Ecosystem, Ma...Assessment of the effects of Acid Mine Drainage on Mogpog River Ecosystem, Ma...
Assessment of the effects of Acid Mine Drainage on Mogpog River Ecosystem, Ma...
 
Annual review presentation_Rahnum_2200HRS10JUN2015_Final
Annual review presentation_Rahnum_2200HRS10JUN2015_FinalAnnual review presentation_Rahnum_2200HRS10JUN2015_Final
Annual review presentation_Rahnum_2200HRS10JUN2015_Final
 
investigative study of seasonal changes
investigative study of seasonal changesinvestigative study of seasonal changes
investigative study of seasonal changes
 
C2VSim Workshop 3 - C2VSim Land Surface Representation
C2VSim Workshop 3 - C2VSim Land Surface RepresentationC2VSim Workshop 3 - C2VSim Land Surface Representation
C2VSim Workshop 3 - C2VSim Land Surface Representation
 
Ground Water Conditions and Major-Ion Hydrogeochemistry of the Benin Formatio...
Ground Water Conditions and Major-Ion Hydrogeochemistry of the Benin Formatio...Ground Water Conditions and Major-Ion Hydrogeochemistry of the Benin Formatio...
Ground Water Conditions and Major-Ion Hydrogeochemistry of the Benin Formatio...
 
Ebong groundwater assessment aws
Ebong groundwater assessment awsEbong groundwater assessment aws
Ebong groundwater assessment aws
 
Factors influencing the distribution and abundance of Daphnia middendorffiana...
Factors influencing the distribution and abundance of Daphnia middendorffiana...Factors influencing the distribution and abundance of Daphnia middendorffiana...
Factors influencing the distribution and abundance of Daphnia middendorffiana...
 
B035308017
B035308017B035308017
B035308017
 
Spatial distribution and environmental geochemistry of zinc metal in water an...
Spatial distribution and environmental geochemistry of zinc metal in water an...Spatial distribution and environmental geochemistry of zinc metal in water an...
Spatial distribution and environmental geochemistry of zinc metal in water an...
 
An Evaluation of Heavy Metals Concentration in the Choba Section of the New ...
An Evaluation of Heavy Metals Concentration in the Choba  Section of the New ...An Evaluation of Heavy Metals Concentration in the Choba  Section of the New ...
An Evaluation of Heavy Metals Concentration in the Choba Section of the New ...
 
Interpolation
InterpolationInterpolation
Interpolation
 
UROP Finals Poster_Junior_Mazariegos
UROP Finals Poster_Junior_MazariegosUROP Finals Poster_Junior_Mazariegos
UROP Finals Poster_Junior_Mazariegos
 

Andere mochten auch

Materi pengembangan lembaga pendidikan non formal pertemuan 2
Materi pengembangan lembaga pendidikan non formal pertemuan 2Materi pengembangan lembaga pendidikan non formal pertemuan 2
Materi pengembangan lembaga pendidikan non formal pertemuan 2Namin AB Ibnu Solihin
 
Project+management+basics
Project+management+basicsProject+management+basics
Project+management+basicskktse
 
Borrador...differences between research project and the research proposal (3)...
Borrador...differences between research project and the research proposal (3)...Borrador...differences between research project and the research proposal (3)...
Borrador...differences between research project and the research proposal (3)...dannyquintero
 
Easy steps to network construction and critical path determination
Easy steps to network construction and critical path determinationEasy steps to network construction and critical path determination
Easy steps to network construction and critical path determinationDr. Mahmoud Al-Naimi
 
Work breakdown structure
Work breakdown structureWork breakdown structure
Work breakdown structureCOEPD HR
 
Marketing Research Ch3
Marketing Research Ch3 Marketing Research Ch3
Marketing Research Ch3 kkjjkevin03
 
Basic Research Design
Basic Research DesignBasic Research Design
Basic Research DesignJason Wrench
 
Network Diagrams
Network DiagramsNetwork Diagrams
Network DiagramsNicola2903
 
Project management planning
Project management planningProject management planning
Project management planningAlvin Niere
 
What is a Work Breakdown Structure?
What is a Work Breakdown Structure?What is a Work Breakdown Structure?
What is a Work Breakdown Structure?Kenny Hirschmann
 
Work Breakdown Structure Use This
Work Breakdown Structure Use ThisWork Breakdown Structure Use This
Work Breakdown Structure Use Thisproject management
 
Component of a Research Design
Component of a Research DesignComponent of a Research Design
Component of a Research Designmehul chopra
 
The Network Diagram and Critical Path
The Network Diagram and Critical PathThe Network Diagram and Critical Path
The Network Diagram and Critical Pathdmdk12
 

Andere mochten auch (20)

Materi pengembangan lembaga pendidikan non formal pertemuan 2
Materi pengembangan lembaga pendidikan non formal pertemuan 2Materi pengembangan lembaga pendidikan non formal pertemuan 2
Materi pengembangan lembaga pendidikan non formal pertemuan 2
 
Project+management+basics
Project+management+basicsProject+management+basics
Project+management+basics
 
Borrador...differences between research project and the research proposal (3)...
Borrador...differences between research project and the research proposal (3)...Borrador...differences between research project and the research proposal (3)...
Borrador...differences between research project and the research proposal (3)...
 
Easy steps to network construction and critical path determination
Easy steps to network construction and critical path determinationEasy steps to network construction and critical path determination
Easy steps to network construction and critical path determination
 
(Aoa) and (aon) networks
(Aoa) and (aon) networks(Aoa) and (aon) networks
(Aoa) and (aon) networks
 
Work breakdown structure
Work breakdown structureWork breakdown structure
Work breakdown structure
 
Marketing Research Ch3
Marketing Research Ch3 Marketing Research Ch3
Marketing Research Ch3
 
Basic Research Design
Basic Research DesignBasic Research Design
Basic Research Design
 
Network Diagrams
Network DiagramsNetwork Diagrams
Network Diagrams
 
Project management planning
Project management planningProject management planning
Project management planning
 
The Project's Network Diagram
The Project's Network DiagramThe Project's Network Diagram
The Project's Network Diagram
 
What is a Work Breakdown Structure?
What is a Work Breakdown Structure?What is a Work Breakdown Structure?
What is a Work Breakdown Structure?
 
Work Breakdown Structure Use This
Work Breakdown Structure Use ThisWork Breakdown Structure Use This
Work Breakdown Structure Use This
 
Work breakdown structure
Work breakdown structureWork breakdown structure
Work breakdown structure
 
Component of a Research Design
Component of a Research DesignComponent of a Research Design
Component of a Research Design
 
Critical Path Method(CPM)
Critical Path Method(CPM)Critical Path Method(CPM)
Critical Path Method(CPM)
 
Work Breakdown Structure
Work Breakdown StructureWork Breakdown Structure
Work Breakdown Structure
 
The Network Diagram and Critical Path
The Network Diagram and Critical PathThe Network Diagram and Critical Path
The Network Diagram and Critical Path
 
10 Smart & Easy LinkedIn Background Images
10 Smart & Easy LinkedIn Background Images10 Smart & Easy LinkedIn Background Images
10 Smart & Easy LinkedIn Background Images
 
Work Breakdown Structure
Work Breakdown StructureWork Breakdown Structure
Work Breakdown Structure
 

Ähnlich wie Env. Geol 05

A rank reduced analysis of runoff components and their response patterns to ...
A rank  reduced analysis of runoff components and their response patterns to ...A rank  reduced analysis of runoff components and their response patterns to ...
A rank reduced analysis of runoff components and their response patterns to ...Alexander Decker
 
Examining the coupled effects of land use and climate change ver 1
Examining the coupled effects of land use and climate change ver 1Examining the coupled effects of land use and climate change ver 1
Examining the coupled effects of land use and climate change ver 1World Agroforestry (ICRAF)
 
An ASABE Meeting Presentation
An ASABE Meeting PresentationAn ASABE Meeting Presentation
An ASABE Meeting PresentationKayla Smith
 
Research Inventy : International Journal of Engineering and Science
Research Inventy : International Journal of Engineering and ScienceResearch Inventy : International Journal of Engineering and Science
Research Inventy : International Journal of Engineering and Scienceresearchinventy
 
Seasonal variations in heavy metal status of the calabar river, cross river s...
Seasonal variations in heavy metal status of the calabar river, cross river s...Seasonal variations in heavy metal status of the calabar river, cross river s...
Seasonal variations in heavy metal status of the calabar river, cross river s...Alexander Decker
 
Characterisation and soil pollution in agrarian floodplain of ibadan peri urb...
Characterisation and soil pollution in agrarian floodplain of ibadan peri urb...Characterisation and soil pollution in agrarian floodplain of ibadan peri urb...
Characterisation and soil pollution in agrarian floodplain of ibadan peri urb...Alexander Decker
 
Gamma ray assessment of subsurface water rock interaction in abuja from geolo...
Gamma ray assessment of subsurface water rock interaction in abuja from geolo...Gamma ray assessment of subsurface water rock interaction in abuja from geolo...
Gamma ray assessment of subsurface water rock interaction in abuja from geolo...Alexander Decker
 
Spatial Analysis of Soil and Water Quality in Tsunami AffectedAreas of Nagapa...
Spatial Analysis of Soil and Water Quality in Tsunami AffectedAreas of Nagapa...Spatial Analysis of Soil and Water Quality in Tsunami AffectedAreas of Nagapa...
Spatial Analysis of Soil and Water Quality in Tsunami AffectedAreas of Nagapa...IJERA Editor
 
Assessment of the quality of shallow groundwater for irrigation in the atankw...
Assessment of the quality of shallow groundwater for irrigation in the atankw...Assessment of the quality of shallow groundwater for irrigation in the atankw...
Assessment of the quality of shallow groundwater for irrigation in the atankw...Alexander Decker
 
Cation Concentrations of Anaocha, Ekwusigo And Ogbaru Local Government Areas ...
Cation Concentrations of Anaocha, Ekwusigo And Ogbaru Local Government Areas ...Cation Concentrations of Anaocha, Ekwusigo And Ogbaru Local Government Areas ...
Cation Concentrations of Anaocha, Ekwusigo And Ogbaru Local Government Areas ...IJRESJOURNAL
 
Rainy seasonal analysis of Physico-chemical parameters of Mukungwa River at N...
Rainy seasonal analysis of Physico-chemical parameters of Mukungwa River at N...Rainy seasonal analysis of Physico-chemical parameters of Mukungwa River at N...
Rainy seasonal analysis of Physico-chemical parameters of Mukungwa River at N...Agriculture Journal IJOEAR
 
Aptitude of Ground waters for Irrigation in the South-East Coastal Region of ...
Aptitude of Ground waters for Irrigation in the South-East Coastal Region of ...Aptitude of Ground waters for Irrigation in the South-East Coastal Region of ...
Aptitude of Ground waters for Irrigation in the South-East Coastal Region of ...inventionjournals
 
Influence of sokoto phosphate rock on some soil properties and the growth and...
Influence of sokoto phosphate rock on some soil properties and the growth and...Influence of sokoto phosphate rock on some soil properties and the growth and...
Influence of sokoto phosphate rock on some soil properties and the growth and...Alexander Decker
 

Ähnlich wie Env. Geol 05 (20)

A rank reduced analysis of runoff components and their response patterns to ...
A rank  reduced analysis of runoff components and their response patterns to ...A rank  reduced analysis of runoff components and their response patterns to ...
A rank reduced analysis of runoff components and their response patterns to ...
 
Examining the coupled effects of land use and climate change ver 1
Examining the coupled effects of land use and climate change ver 1Examining the coupled effects of land use and climate change ver 1
Examining the coupled effects of land use and climate change ver 1
 
A330119
A330119A330119
A330119
 
An ASABE Meeting Presentation
An ASABE Meeting PresentationAn ASABE Meeting Presentation
An ASABE Meeting Presentation
 
Research Inventy : International Journal of Engineering and Science
Research Inventy : International Journal of Engineering and ScienceResearch Inventy : International Journal of Engineering and Science
Research Inventy : International Journal of Engineering and Science
 
Seasonal variations in heavy metal status of the calabar river, cross river s...
Seasonal variations in heavy metal status of the calabar river, cross river s...Seasonal variations in heavy metal status of the calabar river, cross river s...
Seasonal variations in heavy metal status of the calabar river, cross river s...
 
Seasonal variations in heavy metal status of the calabar river, cross river s...
Seasonal variations in heavy metal status of the calabar river, cross river s...Seasonal variations in heavy metal status of the calabar river, cross river s...
Seasonal variations in heavy metal status of the calabar river, cross river s...
 
Characterisation and soil pollution in agrarian floodplain of ibadan peri urb...
Characterisation and soil pollution in agrarian floodplain of ibadan peri urb...Characterisation and soil pollution in agrarian floodplain of ibadan peri urb...
Characterisation and soil pollution in agrarian floodplain of ibadan peri urb...
 
Characterisation and soil pollution in agrarian floodplain of ibadan peri urb...
Characterisation and soil pollution in agrarian floodplain of ibadan peri urb...Characterisation and soil pollution in agrarian floodplain of ibadan peri urb...
Characterisation and soil pollution in agrarian floodplain of ibadan peri urb...
 
Gamma ray assessment of subsurface water rock interaction in abuja from geolo...
Gamma ray assessment of subsurface water rock interaction in abuja from geolo...Gamma ray assessment of subsurface water rock interaction in abuja from geolo...
Gamma ray assessment of subsurface water rock interaction in abuja from geolo...
 
Spatial Analysis of Soil and Water Quality in Tsunami AffectedAreas of Nagapa...
Spatial Analysis of Soil and Water Quality in Tsunami AffectedAreas of Nagapa...Spatial Analysis of Soil and Water Quality in Tsunami AffectedAreas of Nagapa...
Spatial Analysis of Soil and Water Quality in Tsunami AffectedAreas of Nagapa...
 
Mt lasut 2005-ww-cms
Mt lasut 2005-ww-cmsMt lasut 2005-ww-cms
Mt lasut 2005-ww-cms
 
Assessment of the quality of shallow groundwater for irrigation in the atankw...
Assessment of the quality of shallow groundwater for irrigation in the atankw...Assessment of the quality of shallow groundwater for irrigation in the atankw...
Assessment of the quality of shallow groundwater for irrigation in the atankw...
 
Bd4301309313
Bd4301309313Bd4301309313
Bd4301309313
 
Ac4201197199
Ac4201197199Ac4201197199
Ac4201197199
 
Cation Concentrations of Anaocha, Ekwusigo And Ogbaru Local Government Areas ...
Cation Concentrations of Anaocha, Ekwusigo And Ogbaru Local Government Areas ...Cation Concentrations of Anaocha, Ekwusigo And Ogbaru Local Government Areas ...
Cation Concentrations of Anaocha, Ekwusigo And Ogbaru Local Government Areas ...
 
September 1 - 0830 - Zouheir Massri
September 1 - 0830 - Zouheir MassriSeptember 1 - 0830 - Zouheir Massri
September 1 - 0830 - Zouheir Massri
 
Rainy seasonal analysis of Physico-chemical parameters of Mukungwa River at N...
Rainy seasonal analysis of Physico-chemical parameters of Mukungwa River at N...Rainy seasonal analysis of Physico-chemical parameters of Mukungwa River at N...
Rainy seasonal analysis of Physico-chemical parameters of Mukungwa River at N...
 
Aptitude of Ground waters for Irrigation in the South-East Coastal Region of ...
Aptitude of Ground waters for Irrigation in the South-East Coastal Region of ...Aptitude of Ground waters for Irrigation in the South-East Coastal Region of ...
Aptitude of Ground waters for Irrigation in the South-East Coastal Region of ...
 
Influence of sokoto phosphate rock on some soil properties and the growth and...
Influence of sokoto phosphate rock on some soil properties and the growth and...Influence of sokoto phosphate rock on some soil properties and the growth and...
Influence of sokoto phosphate rock on some soil properties and the growth and...
 

Env. Geol 05

  • 1. Environ Geol (2005) 48: 908–919 DOI 10.1007/s00254-005-0029-8 ORIGINAL ARTICLE Adrian H. Gallardo Walter Reyes-Borja Flow and patterns of nitrate pollution in Norio Tase groundwater: a case study of an agricultural area in Tsukuba City, Japan Received: 15 May 2005 Abstract A numerical simulation crops and the associated agricultural Accepted: 17 June 2005 was applied to first characterize the practices may translate into de- Published online: 2 August 2005 groundwater flow and patterns of creases of contamination levels. Ó Springer-Verlag 2005 nitrate pollution of a small-agricul- A series of hypothetical scenarios tural catchment in Tsukuba City, demonstrated that replacing grass- Japan, for a 10-year period. There lands by other crops may reduce the was a good performance of the flow contamination levels up to 12%. As A. H. Gallardo (&) simulation. In contrast, although the the chosen field is a representative of National Institute of Advanced Industrial Science and Technology, transport model calculated the evo- many other agricultural areas in Ja- Geological Survey of Japan, lution of the plume, it only provided pan, the approach and results should 1-1-1, #7 Higashi, Tsukuba estimates of solute concentrations. also be applicable to similar cases 305-8567, Japan Groundwater contamination in- around the country. E-mail: ad.gallardo@aist.go.jp creased exponentially during the first Tel.: +81-29-8613240 Fax: +81-29-8613240 594 days of the simulation, reaching Keywords Groundwater then a near-equilibrium state. Fer- contamination Æ Nitrate Æ W. Reyes-Borja Æ N. Tase Æ A. Gallardo School of Life and Environmental Sciences, tilizer applications are responsible Agriculture Æ Fertilizers Æ University of Tsukuba, Tennodai 1-1-1, for most of the leaching of NO) to 3 Tsukuba City Æ Ibaraki Ibaraki 305-8572, Japan groundwater, therefore, shifting of prefecture Æ Japan Introduction for water supply. The lack of information emphasizes the need to urgently evaluate the sources and extent of Nitrate contamination is responsible of several diseases NO) pollution in the region in order to develop the 3 as hypertension, cancer and birth defects (Spalding and correspondent control and management strategies. As Exner 1993) thereby, a maximum of 45 mg/l for drink- the movement of solutes in groundwater is a three- ing purposes is worldwide accepted (WED 2001). As in dimensional process influenced by a multitude of vari- other parts of the world, there is evidence that NO) 3 ables with complex functions and interactions, it seldom concentrations in many aquifers of Japan are assuming can be overcome even by an extensive monitoring net- serious dimensions as a direct consequence of the work, so a simulation model may provide important intensification of agricultural activities (Ii et al. 1997; additional information (Uffink and Romkens 2001). ¨ Mohamed et al. 2003; Tase 2004). However, despite Although the model results are influenced by a relative being the most densely populated and economically uncertainty, they provide a framework for synthesizing most productive district of Japan, very little is known field information and for testing ideas about how the about the conditions in shallow groundwater within the system works (Woessner and Anderson 1994). Thus, the agricultural belt surrounding the Tokyo metropolis. present research complements geochemical information Contamination in this area causes particular concern with a finite-difference numerical simulation with the because of its proximity to urban centers, and the objective of generating quickly and at a relatively low important number of people still relying on groundwater cost, a first base model, which can help the authorities in
  • 2. 909 the implementation of proper environmental policies. area includes both a flatland with a maximum of 28 m While this might have been done elsewhere, this is the above mean sea level in the south, and a poorly drained first time it has been carried out in this part of Japan. lowland ranging from 22 to 16 m in the north. Steep Moreover, understanding the patterns and rates of slopes and valleys develop in between. A stream runs groundwater flow is essential to investigating the along most of the western edge of the site, while an open migration of contaminants in the system (Buxton and drain on the north removes the excess of water to the Modica 1992), so the paths of groundwater flow were Sakura River, about 1 km north of the area of study. determined as a preliminary step. At last, a simple Agriculture is the dominant land use in the uplands exercise was performed under some hypothetical situa- (Fig. 1). About 46% of the cultivated land is devoted to tions to gain insight into the sensitivity of aquifer con- pastures, while Chinese cabbage and wheat occupy a tamination to agricultural activities. respective 15 and 10% of this land. Most of the Finally, it must be said that the selection of a small remaining portion of the arable land is covered by a catchment allowed retaining enough complexity to forest or occasionally, partially cultivated with seasonal analyze the most relevant processes under various land crops. Given the small size of these parcels and the uses and hydrological conditions, being still small en- limited fertilizer application they can be neglected from ough to cope with the availability of observations and the analysis. According to the farmers’ information, measurements. inorganic fertilizers N:P:K 14–15% and urea CO(NH2)2 N-45% are applied for the three main crops at rates according to the type of plant (Table 1), while Site description Ca(Mg)CO3 is added to neutralize soils acidification. Aside from an orchard within the largest valley corridor, The site corresponds to a watershed of about 400 by the slopes and lowlands are not suitable for cultivation. 300 m within the Tamatori district in Tsukuba City, The 3- to 4-m thick sands of the Ryugasaki Fm approximately 60 km northeast of Tokyo, Japan. The constitute the upper aquifer in the area. On the other Fig. 1 Land use and monitor- ing network in the area of study
  • 3. 910 Table 1 Agricultural management of the main crops in the area Crop Planting Harvest Liming-fertilization Type Amount (kg/ha) Wheat Late February Mid June End February N:P:K 14% 400 – – Mid October Ca (Mg) CO3 10 Early November Early February Early November N:P:K 14% 400 Chinese cabbage – – Early February Ca (Mg) CO3 Late Feb/early March Early June Late Feb/early March N:P:K 15:15:10 1,000 – – Late March /early April Urea N 45% 400 Early August Ca (Mg) CO3 Mid August End November Mid August N:P:K 15:15:10 1,000 – – Mid September Urea N 45% 400 Grass April to August CaCO3 April September April to August N:P:K 14% 380 (monthly) hand, sands of the Narita Fm conform a deeper aquifer 1999), was used to simulate the evolution of NO) in 3 with a thickness no less than 5 m beneath the uplands, groundwater for a period of 10 years. reducing to 1–3 m toward the lowlands. Both aquifers are separated by a clay/sand aquitard, which disappears by erosion at the slopes. A silt layer that acts as an Results and discussion aquiclude is the local basement of the system. Groundwater chemistry Materials and methods Shallow waters around the cultivated fields are high in ions typical of agricultural settings, especially NO)3 A transect of 23 multilevel wells along the expected and SO2) (r=0.75), with a subordinated enrichment in 4 direction of shallow groundwater, and 20 additional Mg2+ as well (Fig. 2). More than 75% of the samples wells distributed all over the area allowed for sampling registered concentrations of NO) exceeding the maxi- 3 of groundwater and parameters determination. Samples mum recommended values of 45 mg/l. Under condi- were collected approximately on a monthly basis for tions of high oxygen and water solubility, part of the over 1 year, and analyzed for major cations and anions ammonium sulfate ((NH4)2SO4) and the urea following standard methods. (CO(NH2)2) applied on the ground would be rapidly Other samples were also collected on the drain and converted into NO) which, is not sorbed to the neg- 3 stream’s waters, and their stage measured at different atively charged sites on soil colloids and moves readily discharge rates both in summer and winter to be used as to the water table (Follet 1995). Furthermore, the high input data in the simulation. correlation between Ca2+ and Mg2+ (0.84) would Runoff was measured at the main slope by leading it result from the addition of dolomite [CaMg(CO3)2]. In into a single collecting tank. In the absence of direct contrast, there is a relative depletion of dissolved ele- measurements, evapotranspiration was interpolated ments beneath the forest associated to the absence of from the literature according to the land cover, while agricultural activities; mean NO) concentrations de- 3 mean precipitation in Tsukuba City was derived from creased in almost 55% with respect to the croplands, the AMEDAS database, of public domain. and only 23% of the samples showed values above the Hydraulic conductivity was determined by slug tests, maximum drinking standards. Moreover, there is a and other soil physical parameters obtained through drastic depletion of NO) near the wetland and the low 3 core samples. reaches of valley corridors, where denitrification would The three-dimensional flow of groundwater was be occurring (Sugawara 2004; Gallardo and Tase simulated under steady-state using the finite-difference 2005). program MODFLOW (McDonald and Harbaugh Unlike shallow waters, deep groundwater presents 1988). It was coupled with the particle tracking code low salinity and is characterized by a dominance of MODPATH (Pollock 1989), utilized to calculate flow HCO) and Ca2+, probably explained by the dissolution 3 paths and travel times of specified groundwater parti- of calcite/dolomite in a closed system (Apello and cles. In addition, the model was manually optimized Postma 1993). Under this situation infiltrating water adjusting the values of several parameters, and then becomes charged with CO2 from the soil–atmosphere calibrated through the use of the parameter estimator zone, and upon percolation it comes in contact with PEST (Doherty et al. 1994). Finally, the modular multi- calcite in the deep aquifer, in a zone isolated from the species transport model MT3DMS (Zheng and Wang gaseous source:
  • 4. 911 Fig. 2 Mean groundwater quality throughout the area most unit extends from the surface to the bottom of the CO2 ðgÞ þ H2 O þ CaCO3 $ Ca2þ þ 2HCOÀ 3 ð1Þ Ryugasaki aquifer. It was simulated as confined in the Thus, the dissolution of calcite adds Ca2+ to the solu- uplands to unconfined in the lowlands. The underlying tion, and the final concentration results in waters rich in sequence of interbedded sands and clays was modeled as both calcium and bicarbonate. Even though the validity three units: (1) an upper layer representing the top lenses of the hypothesis above, evidence suggests that at least of sand, (2) a layer which constitutes the main aquitard part of the HCO) would be a direct result of denitrifi- 3 between aquifers, and (3) a basal unit representing the cation reactions taking place within the deep aquifer lower sand lenses, with properties similar to the unit (Gallardo and Tase 2005), probably occurring in small described in (1). As these units disappear at the slope, zones (microcosms) in the subsurface where oxygen has the simulation was handled by reducing the layers been completely removed (Cey et al. 1999). The pro- thickness as much as possible in the lowlands, and by duction of HCO) decreases the pH and increases the 3 accommodating their properties to the ones of the local solubility of carbonate minerals, explaining then the rise sediments. The fifth layer represents the sands of the in Ca2+ concentrations (Kelly 1997). deep aquifer, and the lowermost unit in the model cor- responds to the silt basement. The system was divided in a nonuniform grid of 68 Flow and transport model rows and 69 columns, and the active cells were limited by physical and hydraulic boundaries selected far enough Conceptual model from the main transect so as not to influence the results in the area of interest (Fig. 4). Physical boundaries in- The conceptual model defined for the simulation con- clude both the drain and stream. The southern border of sists of six hydrogeological layers (Fig. 3). The upper- the model was coincident with the groundwater divide,
  • 5. 912 Fig. 3 Schematical block dia- gram of the conceptual model Fig. 4 Model boundaries and discretization deduced from the general hydrologic maps. No flow Dirichlet condition were selected at certain locations. boundaries were defined for most of the remaining Even though steady-state conditions assume that heads boundaries, although specified head boundaries of do not change with time, some small variations can
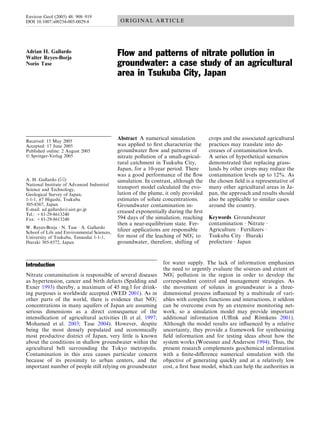
  • 6. 913 Table 2 Inputs for the flow simulation 26 Geological framework Topography Layers geometry 24 Calculated Heads (m) Boundary conditions Rivers–swamps Constant head—no flow cells 22 Groundwater divide Initial heads Surface water stage 20 Recharge Precipitation Overland flow Evapotranspiration 18 Hydrological properties Hydraulic conductivity of materials of sediments 16 Vertical hydraulic conductivity of streambeds Effective porosity 14 Channels geometry and dimensions 14 16 18 20 22 24 26 Elevation of canals bottom Observed Heads (m) Fig. 5 Calculated versus observed heads anyway be expected and therefore, specified head boundaries were introduced only to mimic the water except the upper one, which can be considered accurately table contours, without consideration of their absolute known due to the larger amount of measurements, in values. order to match heads between observed and simulated conditions. There was a good agreement for all heads Flow model inputs except at one well near the slopebreak, where the model calculation was severely underestimated (Fig. 5). This Inputs for the groundwater model included the topog- high residual resulted from the uncertainties in the local raphy of the surface and the hydrogeological units, geology beyond the bottom of the well. In addition, the geometry of the canals, sediment properties, initial small error in the mass balance over the entire domain heads, and recharge (Table 2). A constant hydraulic (0.02%) is another key indicator of the success of the conductivity was applied at each one of the layers except simulation, as it is acceptable provided it is less than for the upper unit, where the several measurements 0.5% (Reilly and Harbaugh 2004). Finally, the model available allowed for obtaining a distributed value of the adequacy was investigated through the normalized root parameter. Conductivity within the uplands is almost mean squared (NRMS), calculated by dividing the root uniform in the range of 5·10)5 cm/s, but there is a mean squared (RMS) or standard deviation by the substantial decrease down the hillslope (4·10)7 cm/s) maximum difference in the observed heads: associated to a better aggregation of the sands. For most of the lowlands, horizontal conductivity averages RMS Normalized RMS ¼ ð2Þ 9·10)4 cm/s. On the other hand, recharge was incorpo- ðxobs Þmax À ðXobs Þmin rated by dividing the area into four zones according to the type of land use/cover (croplands, forest, wetland, An acceptable value of NMRS is less than 10% slopes). Each zone has different evapotranspiration rates (Waterloo Hydrogeological 2003), satisfied by the model (ET) that condition the amount of water reaching the estimation of 8.3%. Moreover, the value reduces to aquifers therefore, recharge was set as the difference 6.7% when the anomalous well is disregarded from the between the mean annual precipitation fallen over the analysis. region since 1991, and ET losses estimated under similar conditions in neighbor areas. Runoff measured on the Groundwater flow patterns slopes was considered also as a recharge loss. Calcula- tions resulted in recharge rates of 735 mm/year within The simulated flow of groundwater is south to north in the cultivated fields, 628 mm/year in the forest, 610 mm/ the uplands, and southwest–northeast downward the year on the slopes, and 229 mm/year within the wetland. slopes (Fig. 6). Heads range from about 25.5 m at the divide to 15 m by the drainage. As expected, the Flow model calibration groundwater gradient is smooth at the uplands, with a decline of only 3.5 m in 245 m of distance, but increases After evaluating the reasonability of the conceptual drastically when reaching the slope and lowlands. The model, automatic calibration was carried out by adjust- drain canal is the main sink in the system, characterized ing the values of hydraulic conductivity for all layers by both ‘‘far-recharge’’, and ‘‘near-recharge’’ fluxes
  • 7. 914 Fig. 6 Groundwater heads and velocity distribution (Modica et al. 1997). Far-recharge particles are re- no attempts to strictly calibrate the transport model, and charged as far as the groundwater divide, traveling in the only a trial-and-error analysis was conducted to refine longest flowpaths up to 63 years. In contrast, near-re- the non-uniqueness of the results, and find a reasonable charge water is characterized by short pathways dis- match between calculations and NO) concentrations for 3 charging relatively close to its source, with an age rarely a set of wells within the wetland and some valley corri- exceeding 6 months. dors. Thus, although the simulation calculated the Groundwater beneath the uplands is mainly re- plume migration, it only provided rough estimates of stricted to two systems that follow predominantly concentrations values. Despite the simulation is simple horizontal flowpaths, and converge at the foot of the and easy to apply, it fits the purposes of the research, slopes. In contrast, the flow component is upward at the and does not lose applicability in the determination of lower edge of the lowlands, where the successive water NO) movement through the system under investigation. 3 fronts merge and discharge together. In addition, in spite The contaminant background in groundwater was set the clay/sand unit beneath the uplands acts as a sort of as zero due to the absence of previous data. Geochem- barrier, a part of the inflows is able to migrate into the istry indicated a fertilizer source for the bulk of solutes deep units, confirming then the partial connection be- in groundwater, so the NO) input was modeled by 3 tween aquifers. specifying those concentrations obtained within the water table at each well in the fertilized land. Concen- trations were apportioned all over the farms by assign- Nitrate model inputs ing to each cell in the upper layer the value registered at the closest well on the correspondent sampling event. The main concern stems from the evolution of the plume When the cell was equally influenced by several wells, in the near future so, the transport of NO) was simu- 3 the values were linearly interpolated. By this method, the lated for an arbitrary period of 10 years from the model calculated the transport of NO) already in 3 beginning of the study. Since calculations were based on groundwater without concern about the processes in the several (though quite rigorous) assumptions, there were unsaturated zone. It was assumed the type of crops and
  • 8. 915 fertilizers, and the leaching rate of NO) to the water 3 over a large part of the upper aquifer, where leaching table, will be constant from the start of the simulation to from fertilizers results in anomalous concentrations of 10 years onwards. NO), which is thermodynamically stable under the 3 Local longitudinal dispersivity (aL) in well-sorted prevailing oxic conditions (Fig. 7). Maximum pollution homogeneous materials is approximately equal to the occurs beneath the cultivated fields, and spreads down- mean grain size (Bear 1979). However, it is higher for gradient to the north through the valleys on the east of non-uniform distributions (Houseworth 1984). Then, the domain. The plume partially reaches the orchard and the dispersivity in the aquifers was calculated as twice the edges of the wetland, but vanishes almost totally the mean size measured for the sediments (Jussel et al. below the forest, supporting the hypotheses inferred 1994), from 1.1 to 3.1 mm. Horizontal transverse dis- from the field observations. In addition, there is a sharp persivities and vertical dispersivity were considered as decrease in concentrations at a depth approximately aL /10 and aL /100, respectively (Gelhar et al. 1992). coincident with the base of the clay aquitard beneath the The denitrification process was simulated as a reac- uplands, and the top of the Narita aquifer downgradi- tion of first-order decay: ent. The model predicted that the NO) plume com- 3 pletely disappears throughout the deep aquifer, except CðtÞ ¼ C0 expðÀktÞ ð3Þ for the presence of an elongated lobe of low concen- where C0 refers to the initial concentration and k cor- trations approximately 140·15 m along the breakslope responds to the decay rate [1/T]. Instead of k, the rate of on the eastern margin of the domain, and a few isolated decay is often expressed by the half-life time (Uffink and patches east of the wetland. The displayed patterns show Romkens 2001) which, was obtained from previous ¨ that although the clay unit effectively prevents the works. The rate of NO) degradation was a fitting 3 migration of pollutants to depth, the transport of NO) 3 parameter, where several models were run until finding to the deep layers would be facilitated downgradient the the most reasonable scenario between two extremes: no slopes as the aquitard thins, and both aquifers become in degradation, to a scenario of maximum decay rate with free connection. In this case, the absence of a physical a half-life of 17 days (Jansson et al. 1991). The most barrier is compensated by conditions more favorable for satisfactory match was finally obtained for a NO) half- 3 attenuation, which determine that NO) is essentially 3 life between 180 and 270 days. depleted throughout the lower aquifer. Patterns of nitrate concentration Nitrate mass removal In coincidence with chemical data, the simulation The total amount of NO) remaining in groundwater as 3 showed that the highest levels of contamination extend contamination, and the portion eliminated through a b Fig. 7 Nitrate distribution: a top aquifer; b basal aquifer
  • 9. 916 Table 3 Sources of NO) to groundwater after 10 years 3 it, denitrification along the channels would have a neg- ligible effect on the overall attenuation of pollution. Fertilizers Simulated NO) Agricultural- Natural Fertilizer N load in input to 3 derived NO) NO) leaching Considering a half-life between 180 and 270 days, re- moval of NO3 ) by denitrification results in 3.8 to 4.6% 3 3 surface groundwater (kg) (kg) (%) (kg) (kg) of the total amount entering groundwater. Depletion would peak in the first few meters of groundwater flow 11,605 9,656 7,212 2,444 62.1 through the valley corridors and wetland and therefore, there still would be a significant potential for NO) 3 reduction, since a large portion of these sites would not denitrification were determined by means of a mass be actively denitrifying due to the lack of NO) in 3 balance. Sources of NO) included leaching from the 3 groundwater (Gallardo and Tase 2005). ground, while sinks were represented by outflows A simple way to verify the accuracy of the calcula- through the drainage and stream, and denitrification. tions consisted in comparing those concentrations Other factors were not a need since NO) fluxes were 3 measured within the stream and drainage, with the mean calculated exclusively for the groundwater system. The NO) value simulated to leave the system through these 3 model estimated that 9,656 kg of NO) leached to 3 sinks after reaching the near-equilibrium. The calculated groundwater after 10 years. Based on the background flow of groundwater discharged out of the domain is concentrations measured beneath the forest, 2,444 kg of 614,745 m3, while the NO) in the outflow totalized 3 this NO) (25.2% of the total) were estimated to be of 3 8000.6 kg. Thus, at the actual rates the aquifer is ex- natural origin therefore, the leaching from fertilizers pected to release an average of 13 mg/l of NO) during 3 would correspond to 62% of the total N loads in the the period. This value presents an excellent fit with the surface (Table 3). mean of NO) obtained at the upstream reaches of the 3 The accumulation of NO) within groundwater grew 3 drainage (12 mg/l), and a satisfactory agreement with exponentially during the first 594 days of the simulation, the remaining sampling points (14.5–19.7 mg/l). Calcu- and then tended to reach a near-equilibrium situation lated concentrations in the groundwater outflow are (Fig. 8). As a whole, the stream and the drainage dis- usually smaller than the mean of the observations which, charge 77.5% of the NO) inputs, while the rest is par- 3 is attributed to the fact that the channels (especially the tially eliminated through denitrification or remain in the artificial drain), are flushing waters from neighbor areas system as contamination. The maximum degradation beyond the study site. that can be expected under optimum conditions (half-life of 17 days) is 7.7% of the leached NO). On the other 3 Implications for land management hand, the possibility of high-rates of denitrification in the vicinities of the streams’ banks and some other areas As reported by Feng et al. (2005) NO) levels in 3 surrounding the wetland, were mentioned by Sugawara groundwater increase significantly after certain agricul- (2004) therefore, a simulation extending the process to tural activities as for example irrigation or fertilization, these zones was undertaken. The model was little af- so it is clear that the water quality of the region will fected by the modifications made, with an increase in the continue to be threatened unless a more suitable scheme removal efficiency of only 0.8% with respect to the ori- of nitrogen inputs and management practices is applied. ginal scenario. These results suggest that given the scale More than half of the N contributions over the of the catchment and the amount of NO) flowing within 3 catchment are derived from the pastures fields, so Fig. 8 Cumulative mass of NO) as a function of time 3
  • 10. 917 Table 4 Simulated mass Fertilizer Leaching Inputs Outflows Mass in Contamination balance of NO) after 10 years, 3 load (kg N) (kg) (%) through groundwater level (%) under some hypothetical sinks (kg) (kg) scenarios of agricultural management Actual conditions 11,605 9,656 100 8,791 866 100 Grass into wheat 8,057 7,872 82 7,086 787 91 Grass into cabbage 20,700 8,919 92 8,060 858 99 Grass into cabbage 10,173 7,048 73 6,320 755 87 (no urea additions) shifting them into other crops with more uptake of NO) 3 families can rapidly germinate and establish an extensive might be an alternative to reduce leaching to ground- root system, many of the crops have good winter-har- water. The root zone of the pastures is a very thin layer diness and exhibit vigorous spring regrowth, and accu- (15 cm approximately) that permits an easy migration of mulate sizeable amounts of dry matter and N N into groundwater, requiring then for a surplus of (Hermanson et al. 2000). In addition, actively growing fertilizers to compensate for what cannot be taken by the cover crops transpire soil water, reducing the rate of plants. Thus, additional NO) balances were calculated 3 recharge and the potential for NO) leaching (Wagger 3 for the 10-year period to gain an insight of what would and Mengel 1988). Recovery rates for some Brassica happen in case the pastures were totally shifted to wheat were estimated to range from 18 to 96% in the top or Chinese cabbage. Moreover, urea constitutes about 25 cm of soil and from 26 to 98% in the top 50 cm of 54% of the N loads for cabbage, so a third scenario soil (Smith et al. 1988). considering its suppression was explored. The NO) in- 3 In addition, the importance of urea in the growth and puts for the new scenarios were generated after extrap- yield of Chinese cabbage must be carefully analyzed, olating the groundwater concentrations already since its suppression results in further reductions of the measured for a certain crop, into those fields that shifted contamination. Leaching of NO) to groundwater re- 3 to the same type of plant. It was assumed that the time duces in nearly 27%, and the total mass finally and rates of fertilizer application for a given crop will remaining in the aquifers drop in about 12% respect the not change over time. actual situation. Replacing grass by wheat has a limited effect. Despite The findings above suggest that there is an opportu- there is a reduction of 31% in the fertilizer amounts, and nity to manipulate the NO) exports by altering the type 3 of 18% in the NO) mass leaching to the aquifer, con- 3 of crop and indirectly, the management techniques. Al- tamination levels decreases in only 4.3% respect the though there are no great reductions in NO) losses 3 actual situation (Table 4). In other words, the reduction during the studied period, management strategies will in NO) inputs is not corresponded with an equivalent 3 result in a more effective control of contamination in the decrease of pollution, probably because of a more lim- long term. The simple conversion of grasslands into ited nutrient absorption by the wheat plants in relation wheat or Chinese cabbage is not enough to restrict NO) 3 to grass, and because of the more limited degradation losses to the water table, however, a more effective rates within the aquifers at the time of the fertilization control is achieved when eliminating the urea additions (February–November). as well. The economical and the agronomic viability Converting pastures into cabbage requires and addi- must be evaluated in order to assess the real possibilities tional of 1,820 kg/year of fertilizer, however, there is still of this practice. Inter-planting tillage has also been certain reduction (8%) in the mass of leaching, and a shown to be an effective measure to control groundwater decrease of about 3% in the NO) amounts finally 3 pollution (Feng et al. 2005). In addition, the application remaining in the aquifer. These reductions might be of optimized minimum amounts of water and nitrogen explained by the higher uptake efficiency of the cabbage to meet realistic yield goals, as well as the timely appli- plants with respect to grass: although recovery of ap- cation of fertilizers, and the use of slow release fertilizers plied N by turfgrass reaches a maximum of 74% (Pet- can be viable measures to minimize NO) leaching. The 3 rovic 1990), it does not have much anion exchange analyzed alternatives scenarios are hypothetical cases capacity within the root zone and therefore, NO) moves 3 that only illustrate how developments of agriculture easily with the percolating water, in some cases very practices may reduce NO) inputs to the water system, 3 rapidly (Camberato 2001). In contrast, Chinese cabbage but it must be emphasized that the approach is only an (Brassica campestris) is a cover crop, plants able to re- exercise providing a preliminary insight into land man- cycle N and reduce leaching losses and groundwater agement implications, and need further development to contamination (Hermanson et al. 2000). The Brassica improve its resolution.
  • 11. 918 Summary and conclusions for the rest of the analyzed period. Even though the system approximated to a near-equilibrium situation, A simple three-dimensional model incorporating deni- groundwater storage is still below its saturation level, trification was developed to assess the patterns and which means NO) contamination may still grow further 3 evolution of NO) in groundwater for a period of 3 if there are no reductions in the inputs. The appearance 10 years. Determination of the geologic framework and of NO) in groundwater would be essentially dependent 3 groundwater pathways was a necessary step before on fertilizer applications and its subsequent leaching proceeding to the investigation of contaminant trans- therefore, manipulation of the type of crops and man- port. Simulated and observed heads within the area are agement techniques within specific areas of the catch- in good agreement, confirming the validity of the flow ment translates into a decrease in contamination levels. model. In contrast, the transport simulation focused in Shifting pastures into wheat or Chinese cabbage resulted providing an insight into the migration of NO) in 3 in a slight reduction of the nutrient inputs to ground- groundwater, without concern about absolute concen- water but, a maximum drop of 12% in the pollution trations. levels are achieved when urea additions are also sup- The simulation predicted that a maximum 7.7% of pressed. the influx of NO) into the aquifers can be degraded. 3 In spite conclusions are not definitive the simulation Depletion may reach 8.5% of the inputs when extending does not lose applicability, and still constitutes a quick the denitrification process to the channels’ banks. and relatively inexpensive tool to get a preliminary However, a removal of 3.8 to 4.6% of the NO) leaching 3 understanding of the system dynamics. The present over the entire area seems to be a more realistic esti- investigation may therefore serve as a guide for future mation. Since it is likely that the wetland zone is capable studies within the area. of removing larger applications of NO), the estimated 3 removal capacity would be somewhat conservative. Acknowledgements The authors wish to thank the Ministry of Groundwater contamination rose sharply during the Education, Culture, Sport, Science and Technology of Japan for providing the financial support to carry out the present research. first 594 days of the simulation, but tended to stabilize References Apello CAJ, Postma D (1993) Geochemis- Follet RF (1995) Fate and transport of Ii H, Hirata T, Matsuo H, Nishikawa M, try, groundwater and pollution. Balk- nutrients:nitrogen. USDA, Agricultural Tase N (1997) Surface water chemistry, ema, Rotterdam Research Service, Soil-Plant-Nutrient particularly concentration of NO) and 3 Bear J (1979) Hydraulics of groundwater. Research Unit, Working Paper No. 7:p DO and d15 N values, near a tea plan- McGraw-Hill, New York 33 tation in Kyushu, Japan. J Hydrol Buxton HT, Modica E (1992) Patterns and Gallardo AH, Tase N (2005) Role of small 202:341–352 rates of ground-water flow on Long Is- valleys and wetlands in attenuation of a Jansson PE, Eckersten H, Johnsson H land, New York. Groundwater rural-area groundwater contamination. (1991) SOILN model, user’s manual. 30(6):857–866 In: Heathwaite L (ed) Dynamics and Department of Soil Science, Swedish Camberato JJ (2001) Nitrogen in soils and biogeochemistry of river Corridors and University of Agricultural Science, Up- fertilizers. SC Turfgrass Found News Wetlands. IAHS Publ 294, pp 86–92 sala 8(1):6–10 Gelhar LW, Welty C, Rehfeldt KR (1992) Jussel P, Stauffer F, Dracos T (1994) Cey EE, Rudolph DL, Aravena R, Parkin A critical review of data of field-scale Transport modeling in heterogeneous G (1999) Role of the riparian zone in dispersion in aquifers. Water Resour aquifers: Statistical description and controlling the distribution and fate of Res 28(7):1955–1974 numerical generation of gravel deposits. agricultural nitrogen near a small Hermanson R, Pan W, Perillo C, Stevens Water Resour Res 30(6):1803–1817 stream in southern Ontario. J Contam R, Stockle C (2000) Nitrogen use by Kelly WR (1997) Heterogeneities in Hydrol 37:45–67 crops and the fate of nitrogen in the soil ground-water geochemistry in a sand Doherty J, Brebber L, Whyte P (1994) and vadose zone. a literature search. aquifer beneath an irrigated field. PEST—Model independent parameter Washington State University and J Hydrol 198:154–176 estimation User’s manual. Watermark Washington Department of Ecology McDonald MG, Harbaugh AW (1988) A Computing, Australia Interagency Agreement No. C9600177, modular three-dimensional finite-differ- Feng ZZ, Wang XK, Feng ZW (2005) Soil Publication No. 00-10-015, Washington ence groundwater flow model. Tech- N and salinity leaching after the autumn Houseworth JE (1984) Longitudinal dis- niques of Water Resources irrigation and its impact on groundwa- persion in non-uniform isotropic por- Investigations of the U.S. Geological ter in Hetao Irrigation District, China. ous media, Rep KH-R-45, WM Keck Survey, Book 6 Agric Water Manag 71:131–143 Lab, Calif Inst of Technol, Pasadena
  • 12. 919 Modica E, Reilly TE, Pollock DW (1997) Smith CJ, Wright GC, Wooroofe MR Water Environmental Department (2001) Patterns and age distribution of (1988) The effect of irrigation and Water environment management in Ja- ground-water flow to streams. nitrogen fertilizer on rapeseed (Brassica pan. Environmental Management Bu- Groundwater 35(3):523–537 napus) production in southeastern reau, Ministry of the Environment, Mohamed AAM, Terao H, Suzuki R, Australia II Nitrogen accumulation and Tokyo, Japan Babiker IS, Ohta K, Kaori K, Kato K oil yield. Irrig Sci 9:15–25 Waterloo Hydrogeologic Inc (2003) Visual (2003) Natural denitrification in the Spalding RF, Exner ME (1993) Occurrence MODFLOW v 3.1 User’s Manual. Kakamigahara groundwater basin, of nitrate in groundwater—a review. Ontario, Canada Gifu prefecture, central Japan. Sci. To- J Env Qual 22:392–402 Woessner WW, Anderson MP (1994) Ap- tal Environ 307:191–201 Sugawara Y (2004) Three-dimensional plied groundwater modeling. Simula- Petrovic AM (1990) The fate of nitrogenous nitrate dynamics in groundwater at the tion of flow and advective transport, fertilizers applied to turfgrass. J Envi- edge of upland. MSc Thesis, University 2nd edn. Academic Press, New York ron Qual 19:1–14 of Tsukuba, Ibaraki, Japan. (in Zheng C, Wang P (1999) MT3DMS, A Pollock, DW (1989) Documentation of Japanese) modular three-dimensional multi- spe- computer programs to compute and Tase (2004) Groundwater contamination cies transport model for simulation of display pathlines using results from the by nitrate and nitrite. Environ Manage advection, dispersion, and chemical U.S. Geological Survey Modular Three- 40(3):47–55 reactions of contaminants in ground- Dimensional Finite-Difference Ground- Uffink GJM, Romkens PFAM (2001) Ni- ¨ water systems: documentation and Water Model, USGS Open File Report trate transport modeling in deep aqui- user’s guide. U. S. Army Corps of 89–381 fers. Comparison between Model Engineers, US. Army Engineer Re- Reilly TE, Harbaugh AW (2004) Guide- results and data from the groundwater search and Development Center, lines for evaluating ground-water flow monitoring network. RIVM-report Vicksburg, Mississippi, SERDP-99-1 models: US Geological Survey Scientific 711401010, Bilthoven Investigations Report 2004–5038, p 30 Wagger MG, Mengel DB (1988) The role of nonleguminous cover crops in the effi- cient use of water and nitrogen. In: Cropping Strategies for efficient use of water and nitrogen. Special pub. no. 51. ASA-CSSA-SSSA, Madison, Wiscon- sin, pp 115–127