SlideShare ist ein Scribd-Unternehmen logo
1 von 26
Downloaden Sie, um offline zu lesen
Galperin et al.                                                                     Broadband tariffs: Benchmarking and analysis


       Broadband tariffs in Latin America: Benchmarking and
                              analysis


                      Hernán Galperin                                                Christian Ruzzier
                  Universidad de San Andrés                                       Universidad de San Andrés
                   hgalperin@udesa.edu.ar                                          cruzzier@udesa.edu.ar


BIOGRAPHIES
Hernan Galperin (Ph.D., Stanford University) is Associate Professor at the Universidad de San Andrés and Independent
Researcher at CONICET.
Christian Ruzzier (Ph.D., Toulouse University) is Visiting Professor at the Universidad de San Andrés.


ABSTRACT
We analyze tariffs for fixed broadband services in Latin America and benchmark against tariffs in the OECD. We also
develop a new broadband development indicator (the Broadband Performance Index) that compares actual penetration rates
with those predicted by our regression model. The results shows that broadband services in Latin America are generally
expensive and of poor quality when benchmarked against OCED countries, and that Latin American countries are
underperforming in broadband development after wealth, education and demographics factors are accounted for. We also
provide price elasticity estimators for broadband demand in Latin America. The results reveal that an average price reduction
of 10% would result in an increase of almost 19% in the penetration rate, equivalent to 4.7 million additional broadband
connections. Finally we estimate the affordability of broadband services for households in a sample of countries in the region.
The results reveal that sharp price reductions would be needed to achieve household penetration rates comparable to the
OECD, and that public access initiatives will still be needed to provide services for the lowest-income households.


Keywords
BROADBAND, TARIFFS, PRICE ELASTICITY, LATIN AMERICA.

INTRODUCTION
The price level of a service is a key variable for understanding the decisions for its adoption and use by households and
businesses. It also reflects the performance and the degree of competition within a sector, making it possible to identify
opportunities for regulatory action to strengthen competition and expand market boundaries. However, there is limited
research that analyzes the price levels and how they affect demand for broadband Internet access services. This scarcity is
even greater for Latin America and the Caribbean, where even national broadband initiatives often lack a solid empirical
foundation as to their effect on adoption and use.
The lack of studies is due in part to methodological difficulties. First, the initiatives of governments and international
agencies to collect data about this service are recent, and there are no standardized methods to compare the multiplicity of
plans and packages offered by service operators in different markets.1 Second, the rapid evolution of access technologies
(both fixed and mobile) presents another challenge, which is reflected in the multiple business models and service features
offered by each operator. Finally, fragmentation into multiple markets at the local or regional level and looser regulatory
control, compared to basic telecommunications services, make it difficult to establish market boundaries as well as the
universe of service operators to be considered.


1
    For a discussion regarding the methodological options, see Wallsten (2009).

Proceedings of the 5th ACORN-REDECOM Conference, Lima, May 19-20th, 2011                                                    317
Galperin et al.                                                                     Broadband tariffs: Benchmarking and analysis


This paper presents a first approach to analyzing the price levels of broadband Internet access in Latin America and the
Caribbean and their effect on demand and penetration levels. It presents a multidimensional approach to the broadband
market that combines penetration levels (how many people or households have broadband), quality (service speeds offered by
operators), price (how much users have to pay for the service) and affordability (how much this expenditure represents in
terms of a household or user’s income).
In order to evaluate the performance of the countries in the region in terms of service penetration, this paper presents a metric
called the broadband performance index (BPI). This index, developed following the work of Ford, Koutsky and Spiwak
(2007) for OECD countries, considers a country’s economic endowments in analyzing the state of broadband development in
each nation. In other words, the observed levels of penetration are compared against the predicted levels based on the
country’s economic resources and other characteristics that affect broadband adoption.
The analysis of the service quality and price levels offered by the leading broadband providers in each country is based on a
survey of plans and tariffs conducted by the authors during the second half of May 2010. The survey covered 323 service
plans offered by 54 operators in 23 countries in the region. Collected data corresponds to the capital or main city in each
country and the universe of operators includes, at a minimum, the leading provider of access via DSL (typically the former
telecommunications incumbent), and the largest provider of services via cable modem (if present). In this first approach
mobile broadband services were not included. Though several studies reveal the importance of this platform for Internet
access in the region, including these services necessitates a broader discussion about the complementarity or competition
between fixed and mobile broadband, as well as metrics for comparing service quality levels, all of which goes beyond the
scope of this paper.
The analysis of broadband affordability aims at comparing observed tariff levels against household income and willingness to
pay for the service. This is a valuable tool for designing universal service plans and makes it possible to set realistic goals and
to define appropriate policy instruments. Furthermore, disaggregation by income groups within each country allows a better
approximation as to the potential effect of tariff reductions on service penetration among lower income households and
micro-enterprises.
Considering each of the dimensions of broadband services (i.e., penetration, price, quality and affordability) separately, one
could reach very different conclusions regarding the development of broadband in the countries of the region. The
multidimensional approach taken in this paper makes it possible to analyze simultaneously the different factors that determine
the level of broadband development in each country, while taken into account its economic endowments and demographic
characteristics. This approach also makes it possible to isolate the effect of the variables of interest to policymakers,
identifying best international practices and opportunities to align public policy objectives with the policymaking tools
available to governments in the region. Ultimately, the goal is to support broadband development initiatives in Latin America
and the Caribbean, offering recommendations to orient private investment, to optimize the use of public resources and to
maximize the impact of universal service programs.
The paper is organized as follows: the next section presents the broadband performance index (BPI) and discusses its results
against traditional penetration indexes. The third section presents the findings of the tariff survey, while the fourth presents
the estimates about the effects of these tariffs on penetration levels in the region. The fifth section discusses findings with
respect to the affordability of broadband services, while the conclusion outlines policy recommendations drawn from the
analysis.
THE BROADBAND PERFORMANCE INDEX
The measurement most commonly used to establish the level of broadband development in a country is service penetration
rate, defined as the number of subscriptions per 100 inhabitants or households. The results obtained with these indicators are
often predictable: wealthy developed countries are also those with the highest level of broadband penetration, while less
developed countries lag behind in the deployment and adoption of this new technology. As argued by Ford et al. (2007), these
results only confirm the findings of an extensive literature that shows a close relationship between economic development
and new technology adoption, and in particular between indicators of wealth and the deployment and use of
telecommunications networks, which is known as the Jippe Curve.2
In this paper, we use an alternative approach to compare broadband development between countries. The approach is based
on comparing, for each country, observed penetration levels with expected penetration levels given a set of economic and
demographic factors that previous studies identify as determinants of the adoption and deployment of telecommunications


2
    For a general overview of this research, see the World Bank (2008).

Proceedings of the 5th ACORN-REDECOM Conference, Lima, May 19-20th, 2011                                                     318
Galperin et al.                                                                   Broadband tariffs: Benchmarking and analysis


infrastructure. In other words, rather than comparing countries on the basis of observed penetration levels (the traditional
approach), our broadband performance index (BPI) compares countries on the basis of how close they are to expected
penetration levels given a set of economic and demographic characteristics that affect both supply and demand for broadband
in a given market.3 As such, this indicator is presented as a complement to traditional penetration indicators, rather than a
substitute.
To calculate the BPI, a simple model of regression is estimated, considering five factors identified in the literature as
determinants of the level of broadband penetration (PENET):
 GDP per capita in US$ PPP (PBICAP)
 Household density per km2 (DENSHH)
 Percentage of urban population (POPURB)
 Percentage of population between 15 and 64 years old (AGE)
 An education index (compiled by United Nations) that comprises the illiteracy rate and the rate of enrollment in primary,
  secondary and tertiary schools (EDUC).
The observed penetration data corresponds to 2009 and was taken from the ITU database (ITU World Telecommunication
Indicators ICT 2010). The household data density was calculated for 2008 by the authors based on the number of households
reported by the ITU and the surface area of each country. All other variables refer to 2008 and were obtained from the World
Bank (World Development Indicators database). The temporal lag in the explanatory variables responds to the availability of
data, but can also mitigate potential endogeneity problems because, as shown by several studies, the development of
broadband has an impact on aggregate GDP.4
The countries analyzed are Argentina, Belize, Bolivia, Brazil, Chile, Colombia, Costa Rica, Ecuador, El Salvador,
Guatemala, Guyana, Honduras, Jamaica, Mexico, Nicaragua, Panama, Paraguay, Peru, Dominican Republic, Surinam,
Trinidad and Tobago, Uruguay and Venezuela.5 To obtain a greater number of observations for a proper statistical analysis,
29 OECD countries were included in the sample (all of the member countries, except for Mexico, which is already included
in the original sample).
The estimated model takes the following form (the subscript indicates the observation, i.e., the country):
                               PENETi = f (PBICAPi, DENSHHi, POPURBi, AGEi, EDUCi) + i
                    PENETi = 0 +1 PBICAPi + 2 DENSHHi + 3 POPURBi + 4 AGEi + 5 EDUCi + i
Based on the results of the literature reviewed, the expected results were:
 The higher income, the greater the penetration of broadband - 1> 0
 The higher the density, the greater the penetration of broadband - 2> 0
 The higher the percentage of urban population, the greater the penetration of broadband - 3> 0
 The higher percentage of people between 15 and 64 years old, the greater the penetration of broadband - 4> 0
 The higher the level of education, the greater the penetration of broadband - 5> 0
Table 1 shows the results of the analysis.6 The proposed model explains about 86% of the variability in broadband
penetration. This confirms the importance of the economic and demographic characteristics that affect the development of
broadband, and suggests that only a small proportion (14%) of the differences in penetration between countries could be


3
  An example illustrates the use of the BPI. It is assumed that a single factor of wealth ‘X’ determines broadband penetration
B and that, on average, for every unit of X broadband penetration increases 0.10 units. Thus, the expected penetration in a
country i would ßi = 0.1 * X. Now, if the assumption is for two countries A and Z with wealth levels 3 and 5 respectively, the
expected penetration would be 0.3 in country A and 0.5 in country Z. If it is found that the actual penetration is 0.35 in
country A and 0.45 in country Z, it can be concluded that, although absolute levels of penetration are higher in Z, the level of
broadband development is greater in country A when factor endowments are taken into account, while the broadband
penetration in country Z is below its potential. (Ford et al., 2007).
4
  See Dattaa and Agarwal (2004), Katz (2009), Koutroumpis (2009) and Röller and Waverman (2001).
5
  Honduras was excluded due to a lack of comparable data regarding broadband penetration.
6
  Estimates were made using Stata/SE 11.1 for Windows, calculating robust standard errors.

Proceedings of the 5th ACORN-REDECOM Conference, Lima, May 19-20th, 2011                                                  319
Galperin et al.                                                                     Broadband tariffs: Benchmarking and analysis


attributed to other factors. The signs of the coefficients of the determinants are in line with expectations and are significant at
5%, except for the age proxy.


                                 Variable          Coefficient      Statistic       p > |t|
                                 PBICAP            0.00047          3.65            0.001
                                 DENSHH            0.04992          3.74            0.001
                                 POPURB            0.09119          2.57            0.014
                                 AGE               -0.16804         -0.90           0.371
                                 EDUC              54.07643         2.41            0.020
                                 Constant          -41.50239        -2.39           0.021
                                 Observations      51
                                 F(5, 45)          53.77
                                 Prob > F          0.0000
                                 R2                0.8649
                                  Source: Prepared by the authors.
                                  Table 1. Determinants of Broadband Penetration (OLS Model)


The disparity in the magnitudes of the coefficients, in particular education (EDUC), is especially striking but it should be
noted that the units of measurement are different for each variable. In order to estimate the marginal effect of different
determinants and proceed to a comparison of the impact of each one separately, we examine the effect of a 1% increase in
each factor on penetration levels (the effects are observed on the averages for the different variables). Table 2 summarizes
these effects:


                                            Variable             Marginal effect
                                            PBICAP               +0.66%
                                            DENSHH               +0.12%
                                            POPURB               +0.39%
                                            AGE                  -0.65%
                                            EDUC                 +2.92%
                                            Sourced: Prepared by the authors.
                                              Table 2. Marginal effect on broadband
                                                          penetration.


With these results, we proceed to calculate the BPI. The model’s predicted penetration rate (PENETP) for each country
results from the following equation:
                       PENETPi = a0 +a1 PBICAPi + a2 DENSHHi + a3 POPURBi + a4 AGEi + a5 EDUCi
In which a represents the estimated coefficients presented in Table 1.
The difference between the observed and the predicted penetration is PENETi – PENETPi = ei, where ei is the estimator of i.
To facilitate the interpretation of the results, BPI is defined as:


Proceedings of the 5th ACORN-REDECOM Conference, Lima, May 19-20th, 2011                                                     320
Galperin et al.                                                                   Broadband tariffs: Benchmarking and analysis


                                                        BPI = ei / max{|ei|}.
Using this procedure, BPI values between -1 and +1 are obtained, where positive values indicate a performance that exceeded
expectations, while negative values indicate a performance below expectations. A value close to zero indicates that the
country is meeting performance expectations based on its economic endowments and demographic characteristics. Figure 1
presents a ranking of countries in Latin America and the Caribbean according to the BPI.7 For the purpose of comparison
with traditional indicators, the ranking of countries in terms of penetration per 100 inhabitants is presented in parentheses.
The BPI’s main results are that, in general, the countries of the region are below their potential for broadband development
based on their economic endowments and demographic characteristics. Some countries, such as Mexico and Brazil, stand out
for meeting expectations with respect to broadband penetration, whereas high penetration countries such as Argentina and
Uruguay are well below expected levels of service adoption, given their relatively high levels of income and education and
favorable demographics (i.e., high urbanization rates). Moreover, the BPI suggests that certain countries with low penetration
rates, such as Paraguay, Nicaragua and Guatemala, fall within their expected levels of penetration or even exceed them. For
its part, Chile, a country that leads traditional rankings of penetration in the region, is also below its expected level of
broadband development, although the gap is smaller than in the cases of Argentina and Uruguay.


                                                     Performance below            Performance above
                                                        expectations                 expectations
                                                                   Belize (15)                           0.17
                                                                Nicaragua (20)          0.05
                                                                Guatemala (21)
                                                                                        0.05
                                                                      -0.04      Mexico (2)
                                                                     -0.04       Brazil (5)
                                                                     -0.05       Paraguay (17)
                                                                    -0.05        Jamaica (11)
                                                                   -0.06         Costa Rica (8)
                                                              -0.09              Trinidad & Tobago (4)
                                                            -0.10                 Colombia (10)
                                                           -0.10                 El Salvador (16)
                                                          -0.11                  Bolivia (18)
                                                       -0.13                     Chile (1)
                                                     -0.14                       Surinam (19)
                                                   -0.15                         Guyana (22)
                                                   -0.15                         Dominican Rep. (12)
                                           -0.19                                 Panama (9)
                                   -0.23                                         Peru (14)
                                -0.25                                            Venezuela (7)
                               -0.25                                             Ecuador (18)
                  -0.34                                                          Argentina (3)
    -0.45                                                                        Uruguay (6)

Source: Prepared by the authors based on ITU (2010).
                                            Figure 1. Broadband Performance Index


7
  For some countries (Belize, Guatemala and Nicaragua) the model predicts negative penetration rates. In these cases, the
predicted value was forced to zero to calculate the BPI.

Proceedings of the 5th ACORN-REDECOM Conference, Lima, May 19-20th, 2011                                                  321
Galperin et al.                                                                   Broadband tariffs: Benchmarking and analysis


PRICE AND QUALITY INDICATORS
The second dimension of interest in the analysis of broadband in Latin America and the Caribbean relates to the observed
price levels and quality of service offered by the leading service providers. To account for this dimension—the main purpose
of this paper—a survey of all the plans and tariffs offered by the major operators in each country in the region was
undertaken. This survey was carried out following the methodology proposed by the OECD, which, among other advantages,
allows a comparison of the results for Latin America and the Caribbean with those available for developed countries.8 This
methodology considers as broadband all plans whose advertised download speed is greater than 256 kbps. In each country,
the universe of operators considered included at a minimum the leading provider of access via xDSL and the largest provider
of services via cable modem (if available). We surveyed 323 plans offered by 54 operators in 23 countries. The data
corresponds to the capital or main city in each country, and was compiled during the second half of May 2010.
Quality (speed)
The quality of Internet access services depends on a variety of factors, which include speed and connection stability
(measured in terms of fluctuations in latency and packet loss). It is a key variable that affects not only the type of possible
uses but also the service applications that can be offered upon the basic access services. The development and adoption of
advanced e-commerce, entertainment, online games and distance education, among many other broadband applications,
depends heavily on the deployment of high-quality broadband services that can support the high quality requirements of those
applications.
Typically, Internet access services vary in terms of the download speeds advertised by the service operator, though in some
cases the offering includes promises about particular upload speed and connection stability (QoS). In this paper, the
download speed advertised by the operator is considered a proxy for quality of service.9 As mentioned above, we follow the
ITU definition of broadband as any Internet access services with a minimum 256 kbps download speed. However, the
distinction between services proposed by the OECD—low speed (256kbps–2Mbps), average speed (2.5 Mbps–10Mbps), high
speed (10Mbps–32Mbps) and very high speed (+35 Mbps)—is added to this definition.
In terms of the maximum speeds offered, Chile is the best performer among the countries in the sample, followed by
Argentina, Brazil and Colombia (see Figure 2). Only Jamaica, Trinidad and Tobago, Mexico and the Dominican Republic
join the group of countries that offer speeds of at least 10 Mbps, the lower end of what the OECD considers "high" speed
access. At the other extreme, countries in the fifth quintile (Guatemala, Honduras, Belize, Surinam, Guyana) offer maximum
speeds that do not reach 2 Mbps–the 'low speed' access definition of the OECD. None of the countries surveyed at the time
had residential plans offering speeds higher than 35 Mbps (or "very high" speed), reflecting the limited deployment of high
capacity networks in the local segment in the region (especially FTTH). It is worth noting that the average maximum speed
offered in OECD countries is 9.3 times higher than that offered in Latin America and the Caribbean.


8
 See http://www.oecd.org/sti/ict/broadband.
9
 The speed advertised by the operators is no more than a promise of best efforts; the actual speed at any given time depends
on a variety of factors affecting service quality. However, in this paper it is assumed that the relationship between advertised
speed and actual speed remains constant between fixed broadband service operators and, therefore, does not affect
comparisons between the respective offerings.

Proceedings of the 5th ACORN-REDECOM Conference, Lima, May 19-20th, 2011                                                  322
Galperin et al.                                                                                                                                                                                                                                                                                                                         Broadband tariffs: Benchmarking and analysis


                  80
                  70
                  60
                  50
                  40
                  30
                  20
                  10
                   0


                                                                                                                                                                                                                               Average LATAM


                                                                                                                                                                                                                                                                                                                            Venezuela
                                      Average OCDE


                                                                               Argentina


                                                                                                                                 Colombia


                                                                                                                                                                                                                                                                                                                                                                                                     Guatemala
                                                                                                                                                                                                                                                                                                                Uruguay
                                                             Chile


                                                                                                    Brazil


                                                                                                                                                                                                                                                                                                    Peru
                                                                                                                                                                                            Mexico


                                                                                                                                                                                                                                                                                          Ecuador


                                                                                                                                                                                                                                                                                                                                                                                                                           Honduras


                                                                                                                                                                                                                                                                                                                                                                                                                                                  Belize


                                                                                                                                                                                                                                                                                                                                                                                                                                                                     Surinam
                                                                                                                                                    Jamaica


                                                                                                                                                                                                                                                   Panama


                                                                                                                                                                                                                                                                 Paraguay


                                                                                                                                                                                                                                                                                                                                                                                 Nicaragua
                                                                                                                                                                                                                                                                                                                                            Bolivia


                                                                                                                                                                                                                                                                                                                                                                                                                                                                                        Guyana
                                                                                                                                                                                                        Dominicana Rep.
                                                                                                                                                                    Trinidad & Tobago


                                                                                                                                                                                                                                                                             Costa Rica


                                                                                                                                                                                                                                                                                                                                                           El Salvador
              Source: Prepared by the authors.
                                                                                                                                                              Figure 2. Maximum speed offered (in Mbps)


The relative ranking of countries practically remains unaltered when considering the average speed for all plans offered in
each country (the correlation between the two rankings is 0.97). Chile remains the best performer in terms of the quality of
the broadband offering, but well below the average speed offered in OECD countries (which is seven times higher than the
regional average). Both indicators place the same countries in the same quintile of performance, with the exception of Bolivia
and Honduras, which switch places within the two lowest performing groups (see Figure 3).


             18
             16
             14
             12
             10
              8
              6
              4
              2
              0
                                                                                                                                                                                                                                                                                                                                                                                                                 Bolivia
                                                                     Jamaica


                                                                                                                                                                                                                                                                                                                  Uruguay


                                                                                                                                                                                                                                                                                                                                                                                         Nicaragua
                                                                                           Brazil


                                                                                                                                                                                                                                                                             Peru


                                                                                                                                                                                                                                                                                                                                                                                                                                                                               Belize
                                                                                                                                            Argentina


                                                                                                                                                                                        Mexico


                                                                                                                                                                                                                                                                Costa Rica


                                                                                                                                                                                                                                                                                                     Paraguay


                                                                                                                                                                                                                                                                                                                                                Honduras


                                                                                                                                                                                                                                                                                                                                                                                                                                                           Surinam


                                                                                                                                                                                                                                                                                                                                                                                                                                                                                                 Guyana
                                                     Chile


                                                                                                                                                                                                                                                                                                                                Venezuela


                                                                                                                                                                                                                                                                                                                                                                                                                                      Guatemala
                       Average OCDE


                                                                                                                                                              Colombia


                                                                                                                                                                                                     Panama


                                                                                                                                                                                                                                               Dominican Rep.


                                                                                                                                                                                                                                                                                          Ecuador
                                                                                                             Trinidad & Tobago


                                                                                                                                                                                                                          Average LATAM


                                                                                                                                                                                                                                                                                                                                                                   El Salvador


           Source: Prepared by the authors.
                                                                                                                                                              Figure 3. Average Speed Offered (in Mbps)


Finally, Table 3 presents the rankings generated by two measurements of speed. A ranking based on the simple average of
these indicators is also included. The results confirm Chile, Brazil and Argentina as the countries offering the highest quality
broadband service, while Guyana, Surinam, Belize and Guatemala lag behind.


Proceedings of the 5th ACORN-REDECOM Conference, Lima, May 19-20th, 2011                                                                                                                                                                                                                                                                                                                                                                                                                                  323
Galperin et al.                                                                 Broadband tariffs: Benchmarking and analysis


                                                   Maximum
                                                   speed offered Average speed Average
                           Country                 (Mbps)        offered (Mbps) Ranking
                           Chile                   1             1                 1.0
                           Brazil                  3             3                 3.0
                           Argentina               2             5                 3.5
                           Jamaica                 5             2                 3.5
                           Colombia                4             6                 5.0
                           Trinidad and Tobago     6             4                 5.0
                           Mexico                  7             7                 7.0
                           Panamá                  9             8                 8.5
                           Dominican Rep.          8             9                 8.5
                           Costa Rica              11            10                10.5
                           Paraguay                10            13                11.5
                           Ecuador                 12            12                12.0
                           Peru                    13            11                12.0
                           Uruguay                 14            14                14.0
                           Venezuela               15            15                15.0
                           El Salvador             17            17                17.0
                           Bolivia                 16            19                17.5
                           Honduras                20            16                18.0
                           Nicaragua               18            18                18.0
                           Guatemala               19            20                19.5
                           Belize                  21            22                21.5
                           Surinam                 22            21                21.5
                           Guyana                  23            23                23.0
                           Source: Prepared by the authors.
                                           Table 3. Ranking of Advertised Speeds


Tariffs
The multiplicity of plans, special discount deals and packages offered by broadband operators presents a challenge to
comparing tariff levels between countries. In this section we present various indicators that, when combined, provide an
approximation to the price level of broadband access in the countries of the region and in relation to developed countries
(OECD).10 Following standard methodology, tariffs are converted into US$ PPP to obtain comparable measurements among
different countries.
Our analysis begins by sorting countries according to the average advertised price of a broadband connection based on all the
plans surveyed (see Figures 4 and 5). List prices were computed separately from discounted prices (discounted prices

10
     OECD data corresponds to the fourth quarter of 2009.

Proceedings of the 5th ACORN-REDECOM Conference, Lima, May 19-20th, 2011                                                324
Galperin et al.                                                                                                                                                                                                                                     Broadband tariffs: Benchmarking and analysis


generally offer reduced rates during the first months of service), but the resulting rankings were essentially identical. Given
the similarity between the two rankings, list prices are used in the remainder analysis.
                  $350

                  $300

                  $250

                  $200

                  $150

                  $100

                   $50

                    $0

                                                                                                                           El Salvador


                                                                                                                                                                             Brazil
                           Uruguay


                                                                    Mexico


                                                                                                                                                                                                  Paraguay


                                                                                                                                                                                                                              Panama


                                                                                                                                                                                                                                                     Honduras


                                                                                                                                                                                                                                                                        Ecuador

                                                                                                                                                                                                                                                                                   Guyana


                                                                                                                                                                                                                                                                                                                  Surinam
                                                                              Chile


                                                                                                              Venezuela


                                                                                                                                         Guatemala


                                                                                                                                                                                                                                       Nicaragua
                                                                                                                                                     Colombia


                                                                                                                                                                                                                                                                 Peru


                                                                                                                                                                                                                                                                                                                              Belize

                                                                                                                                                                                                                                                                                                                                         Bolivia
                                       Jamaica


                                                                                                                                                                                      Argentina


                                                                                                                                                                                                             Average LATAM
                                                    Average OCDE


                                                                                                                                                                                                                                                                                             Dominican Rep.
                                                                                         Trinidad & Tobago


                                                                                                                                                                Costa Rica

              Source: Prepared by the authors.
                                               Figure 4. Broadband Tariffs – Average Plan (With Discounts) (In US$ PPP)


                  $400
                  $350
                  $300
                  $250
                  $200
                  $150
                  $100
                  $50
                    $0
                                                                                                                          El Salvador


                                                                                                                                                                             Brazil


                                                                                                                                                                                                                              Panama

                                                                                                                                                                                                                                        Nicaragua

                                                                                                                                                                                                                                                      Honduras


                                                                                                                                                                                                                                                                                                                    Surinam
                                                                             Chile


                                                                                                                                         Guatemala
                                     Uruguay


                                                                   Mexico


                                                                                                                                                     Colombia


                                                                                                                                                                                                  Paraguay


                                                                                                                                                                                                                                                                 Peru

                                                                                                                                                                                                                                                                         Ecuador

                                                                                                                                                                                                                                                                                    Guyana


                                                                                                                                                                                                                                                                                                                                Belize
                         Jamaica


                                                                                                             Venezuela


                                                                                                                                                                                                              Average LATAM


                                                                                                                                                                                                                                                                                                                                           Bolivia
                                                                                                                                                                                      Argentina


                                                                                                                                                                                                                                                                                                 Dominican Rep.
                                                 Average OCDE


                                                                                      Trinidad & Tobago


                                                                                                                                                                Costa Rica


              Source: Prepared by the authors.
                                                                    Figure 5. Broadband Tariffs – Average List Price (in US$ PPP)


The first interesting result is that countries with good performance in terms of penetration and quality of service do not
necessarily stand out in terms of average prices (in particular Argentina and Brazil). However, in general, the results confirm
the inhibitory effect exerted by prices on service adoption, as four of the five countries in the bottom quintile of service
penetration have tariffs well above average in the region. (the notable exception is Guatemala, with relatively low average
tariffs and limited service adoption).


Proceedings of the 5th ACORN-REDECOM Conference, Lima, May 19-20th, 2011                                                                                                                                                                                                                                                                             325
Galperin et al.                                                                                                                                                                                                         Broadband tariffs: Benchmarking and analysis


As a reference, average prices in the 30 OECD countries are included. On average, prices in Latin America and the Caribbean
are nearly 2.5 times higher than those observed in OECD countries, which explains part of the differences in penetration.
However, it is worth noting that the best performing countries (Uruguay, Jamaica, Mexico and Chile) have average tariffs
comparable to those in OECD countries, and virtually every country in the first and second quintiles offer average prices
within 1 standard deviation of the OECD average.
Another indicator commonly used is price per megabit per second (Mbps), which allows comparisons based upon a
standardized measure of price/quality. In other words, this indicator makes it possible to measure the value obtained in each
country for every dollar spent on broadband service. As shown Jamaica, Chile and Mexico still lead the region by offering the
lowest price per Mbps. On the other hand, Uruguay is negatively affected in the price per Mbps comparison due to the low
average speed offered by its main operator. Venezuela, El Salvador and Guatemala represent similar cases, falling from the
second to fourth quintile. This indicator favors, on the contrary, countries with high speed plans such as Argentina and Brazil,
since these plans tend to have a lower cost per Mbps (see Figure 6).
While countries in the first quintile have a comparable performance with the OECD average (± 1 standard deviation), the
average price per Mbps in the region is 15.5 times greater than in developed countries. Again, the key difference are the high
and very high speed plans offered in OECD countries; the price/quality ratio is therefore significantly less attractive in Latin
America and the Caribbean.
              $600

              $500

              $400

              $300

              $200

              $100

                  $0
                                                                                                Brazil
                                      Jamaica


                                                                                                                                                                Ecuador


                                                                                                                                                                                           Peru
                                                Chile

                                                        Mexico


                                                                                                                                        Costa Rica


                                                                                                                                                                                                                                                                                                            Belize
                                                                                                                                                                                                                                                                   Nicaragua


                                                                                                                                                                                                                                                                                         Guyana

                                                                                                                                                                                                                                                                                                  Bolivia
                                                                                     Colombia


                                                                                                                                                                                                                                                       Venezuela


                                                                                                                                                                                                                                                                               Surinam
                                                                                                         Argentina


                                                                                                                              Uruguay


                                                                                                                                                     Paraguay


                                                                                                                                                                          Dominican Rep.


                                                                                                                                                                                                                                            Honduras
                       Average OCDE


                                                                                                                     Panama


                                                                                                                                                                                                                Guatemala
                                                                                                                                                                                                  El Salvador
                                                                 Trinidad & Tobago


                                                                                                                                                                                                                            Average LATAM


            Source: Prepared by the authors.
                                                                                       Figure 6. Broadband Tariffs (in US$ PPP/Mbps)


In order to mitigate the bias of the previous indicator, the comparison of plans is segmented based on service speed (see
Figures 7, 8 and 9). In the low-speed access segment (256kbps-2Mbps) average tariffs in the region are three times higher
than those reported in the OECD countries, a difference that increases to 3.5 times in the medium speed tier (2.5Mbps-
10Mbps) and the high speed tier (10Mbps-32Mbps).


Proceedings of the 5th ACORN-REDECOM Conference, Lima, May 19-20th, 2011                                                                                                                                                                                                                                             326
Galperin et al.                                                                                                                                                                                                                                                                                              Broadband tariffs: Benchmarking and analysis


                  $300

                  $250

                  $200

                  $150

                  $100

                   $50

                    $0
                                                                                                    Average OCDE


                                                                                                                                                                                      Argentina


                                                                                                                                                                                                                                                     Venezuela
                                                                      Uruguay


                                                                                                                                                                                                             Paraguay
                                                                                                                                                    Chile


                                                                                                                                                                                                                                                                                                                                                                                                        Belize
                                                                                   Jamaica


                                                                                                                     Panama

                                                                                                                                  Brazil


                                                                                                                                                                                                                                 El Salvador
                                                                                                                                           Mexico


                                                                                                                                                                                                                                                                              Ecuador
                                                                                                                                                                                                                                                                 Guatemala


                                                                                                                                                                                                                                                                                                                                                  Nicaragua

                                                                                                                                                                                                                                                                                                                                                                     Honduras

                                                                                                                                                                                                                                                                                                                                                                                    Guyana

                                                                                                                                                                                                                                                                                                                                                                                             Surinam
                                                                                                                                                                                                                                                                                                                                      Peru


                                                                                                                                                                                                                                                                                                                                                                                                                                  Bolivia
                                   Trinidad & Tobago


                                                                                                                                                                   Costa Rica


                                                                                                                                                                                                  Colombia


                                                                                                                                                                                                                                                                                             Average LATAM

                                                                                                                                                                                                                                                                                                                     Dominican Rep.
             Source: Prepared by the authors.
                                                                                Figure 7. Broadband Tariffs-Average for Low Speed Plans (in US$ PPP)


           $800

           $700

           $600

           $500

           $400

           $300

           $200

           $100

             $0
                                                                                                                                                                                                                                               Venezuela


                                                                                                                                                                                                                                                                                                                                                                                Paraguay
                                                                                                                              Chile


                                                                                                                                                                                Colombia
                         Jamaica


                                                                                                                                                       Argentina


                                                                                                                                                                                                                                                                                                                                                              Peru
                                                                                                                                           Brazil


                                                                                                                                                                                                  Uruguay


                                                                                                                                                                                                                                                                                                                                      Nicaragua
                                                                                                                                                                                                                                                                                    Panama


                                                                                                                                                                                                                                                                                                                                                                                              Ecuador
                                                                                                            Mexico


                                                                                                                                                                                                                   El Salvador


                                                                                                                                                                                                                                                                                                                                                                                                                                            Bolivia
                                                       Average OCDE


                                                                                Trinidad & Tobago


                                                                                                                                                                                                                                                                 Costa Rica


                                                                                                                                                                                                                                                                                                             Average LATAM


                                                                                                                                                                                                                                                                                                                                                                                                                 Dominican Rep.


         Source: Prepared by the authors.
                                                                       Figure 8. Broadband Tariffs – Average for Medium Speed Plans (In US$ PPP)


Proceedings of the 5th ACORN-REDECOM Conference, Lima, May 19-20th, 2011                                                                                                                                                                                                                                                                                                                                                                              327
Galperin et al.                                                                                  Broadband tariffs: Benchmarking and analysis


             $600

             $500

             $400

             $300

             $200

             $100

                  $0


                                                                                                                                Dominican
                                                    Chile


                                                             Mexico


                                                                                   Brazil
                                          Jamaica


                                                                                            Average


                                                                                                                     Colombia
                                                                                                         Argentina
                       Average OCDE


                                                                      Trinidad &


                                                                                            LATAM
                                                                       Tobago


                                                                                                                                  Rep.
          Source: Prepared by the authors.
                                      Figure 9. Broadband Tariffs – Average for High Speed Plans (In US$ PPP)


Finally, the lowest tariffs for broadband Internet access were compared for the countries in the region (Figure 10). The price
of the entry-level plan is an important indicator because it establishes the minimum level of spending required by a household
or micro-enterprise to access broadband services, and is therefore used in several international comparisons. These plans are a
central element of the universal broadband initiatives adopted in various countries, which seek to reduce barriers to adoption
by fostering the provision of basic connectivity plans.
It comes as no surprise that Uruguay and Venezuela are the best performing countries in the region, since government control
over the main telecommunications operator makes it possible to offer basic connectivity plans (typically with low speed and
caps on data volume) at reduced tariffs. Something similar is underway in Brazil, where various private operators joined the
Banda Larga Popular plan implemented in the State of São Paulo, which offers tax benefits to operators joining the
initiative.11 Chile presents the opposite case, falling to the third quintile. Bolivia, Nicaragua, Guyana, Suriname, Honduras
and Belize are the worst performers in this indicator, which is consistent with their poor performance in other indicators
considered.


11
   In various counties in the region, basic plans targeting lower income households are available. These plans, which are
similar to subsidized tariffs in basic telecommunications services, contain diverse restrictions on download speed and
volumes, and, in some cases, include a pre-pay modality The pre-pay broadband plan offered by telco CANTV in Venezuela
for US$ 7 a month, is ADSL access with a download speed of 256 kbps (the minimum for broadband) and 128 kbps upload,
with a limit of 500Mb per month. In Uruguay, the state-run telco ANTEL offers a basic plan with a download speed of 1024
kbps and a 2Gb limit for US$ 9 per month (with special discounts). In Brazil, Telefónica offers a plan adhered to the
initiative ‘Popular Broadband’ of the State of São Paulo with a download speed of 256 kbps and a download limit of 10Gb
for approximately US$ 17 per month.

Proceedings of the 5th ACORN-REDECOM Conference, Lima, May 19-20th, 2011                                                                    328
Galperin et al.                                                                                                                                                                                                              Broadband tariffs: Benchmarking and analysis


                   $160
                   $140
                   $120
                   $100
                    $80
                    $60
                    $40
                    $20
                     $0


                                                                                                                              Jamaica


                                                                                                                                                                         Colombia

                                                                                                                                                                                    Ecuador
                                          Venezuela


                                                                                    Brazil

                                                                                             Mexico


                                                                                                                   Paraguay


                                                                                                                                                                 Chile


                                                                                                                                                                                                                                         Peru

                                                                                                                                                                                                                                                Bolivia
                                                                                                                                            Panama

                                                                                                                                                     Guatemala
                            Mínimo OCDE


                                                                                                                                                                                                                        Dominican Rep.


                                                                                                                                                                                                                                                                      Guyana


                                                                                                                                                                                                                                                                                                    Belize
                                                                                                      Costa Rica


                                                                                                                                                                                              El Salvador

                                                                                                                                                                                                            Argentina


                                                                                                                                                                                                                                                          Nicaragua


                                                                                                                                                                                                                                                                                         Honduras
                                                                                                                                                                                                                                                                               Surinam
                                                      Uruguay

                                                                Trinidad & Tobago


                  Source: Prepared by the authors.
                                                      Figure 10. Broadband Tariffs – Least expensive Plan (in US$ PPP)


Table 4 summarizes the results of the plans and tariffs survey, including a ranking based on the simple average of the various
indicators.


                                                                                             US$ PPP                                                                                                                                                                  Average
                                                                                                                                                                                         Least
                                                                                                                                        US$ PPP                                                                                                                       ranking
                                                                                             discount                                                                           US$ PPP expensive
                     Country                                                                 price                                      list price                              per Mbps plan
                     Jamaica                                                                 2                                          1                                       1                                            8                                        3.0
                     Mexico                                                                  3                                          3                                       3                                            5                                        3.5
                     Uruguay                                                                 1                                          2                                       9                                            2                                        3.5
                     Trinidad                                              and
                     Tobago                                                                  5                                          5                                       4                                            3                                        4.3
                     Chile                                                                   4                                          4                                       2                                            11                                       5.3
                     Venezuela                                                               6                                          6                                       18                                           1                                        7.8
                     Brazil                                                                  11                                         11                                      6                                            4                                        8.0
                     Colombia                                                                9                                          9                                       5                                            12                                       8.8
                     Costa Rica                                                              10                                         10                                      10                                           6                                        9.0
                     Guatemala                                                               8                                          8                                       16                                           10                                       10.5
                     El Salvador                                                             7                                          7                                       15                                           14                                       10.8
                     Paraguay                                                                13                                         13                                      11                                           7                                        11.0
                     Panama                                                                  14                                         14                                      8                                            9                                        11.3
                     Argentina                                                               12                                         12                                      7                                            15                                       11.5
                     Ecuador                                                                 18                                         18                                      12                                           13                                       15.3
                     Peru                                                                    17                                         17                                      14                                           17                                       16.3


Proceedings of the 5th ACORN-REDECOM Conference, Lima, May 19-20th, 2011                                                                                                                                                                                                                                     329
Galperin et al.                                                                   Broadband tariffs: Benchmarking and analysis


                     Nicaragua             15           15           19           19           17.0
                     Dominican Rep.        20           20           13           16           17.3
                     Honduras              16           16           17           22           17.8
                     Guyana                19           19           21           20           19.8
                     Surinam               21           21           20           21           20.8
                     Bolivia               23           23           22           18           21.5
                     Belize                22           22           23           23           22.5
                     Source: Prepared by the authors.
                                                   Table 4. Ranking of Tariffs


To conclude, the results reveal:
1. A high dispersion of tariffs in the region, even in markets with similar characteristics, suggesting the existence of
opportunities for regulatory action aimed at strengthening competition and addressing potential bottlenecks in the various
segments that comprise the Internet access market.
2. A lower quality offer and an average level of tariffs significantly higher than in OECD countries, particularly for medium-
speed (2.5 Mbps-10Mbps) and high-speed (10Mbps-32Mbps) plans. In the best performing countries in the region, however,
tariffs are comparable to those of the OECD, which reinforces the need for the actions mentioned in the previous paragraph.
3. The importance of basic connectivity plans to reduce current price levels and, thereby extend the boundaries of the
residential market for broadband Internet access. The results suggest the existence of a balance between price and quality
offered, by which some countries stand out in terms of value per Mbps while others do so in terms of low entry-level costs.
Uruguay and Venezuela are examples that suggest the potential for demand segmentation to extend connectivity to the base
of the income pyramid.
ESTIMATING THE EFFECT OF PRICE ON BROADBAND DEMAND
The results of the BPI discussed in the second section suggest that broadband adoption depends largely on the wealth and
demographic characteristics of individual countries. In other words, it depends on long-term variables upon which policy
makers have limited capacity for action in the short term. On the other hand, the price of broadband access services is a
variable that governments can act upon through various tools to promote competition and correct market failures. Henceforth
the estimated impact of tariff changes on the adoption of the service is a key ingredient in defining broadband policies.
The model used for calculating the BPI purposely omits the price variable, since as pointed out by Hauge and Prieto (2010)
the penetration level is determined by the interaction between the availability of services, the plans offered and the demand
for the service. Therefore, price and penetration are determined simultaneously, which requires other econometric tools to
isolate the effect of price on broadband penetration. This section addresses this issue.
The correlation between price and penetration indicators suggests that an association between the two variables exists. As an
example, Figure 11 shows the simple correlation between the price per Mbps (in PPP dollars) and the penetration rate per 100
households for the 22 countries of Latin America and the Caribbean and the 29 OECD countries in the sample.12 As expected,
the lower the price the higher the penetration.


12
     Honduras is excluded again due to a lack of comparable data regarding broadband penetration.

Proceedings of the 5th ACORN-REDECOM Conference, Lima, May 19-20th, 2011                                                  330
Galperin et al.                                                                                 Broadband tariffs: Benchmarking and analysis


                                 90

                                 80
                                                                                                   R² = 0.623
                                 70

                   Penetration   60

                                 50

                                 40

                                 30

                                 20

                                 10

                                 0
                                      $0      $100         $200          $300            $400          $500         $600
                                                                  Price (US$ per Mbps)

                  Source: The authors and UIT (2010).
                                 Figure 11. Correlation between Price (USD PPP/Mbps) and Broadband Penetration
                                                          (connections per 100 households)


In order to isolate the effect of price on broadband demand we start by estimating a simple regression model that considers
four demand factors identified by the literature as determinants of the level of broadband penetration (PENET).13
 Price: Monthly subscription cost in US$ PPP (PRICE)
 Income: GDP per capita in US$ PPP (PBICAP)
 Age: percentage of population between 15 and 64 years of age (AGE)
 Education: UN education index (EDUC)
In the case of PRICE, we use average discount prices in each country (see the third section). For the other variables the data
is similar to that used to compute the BPI (see the second section). Again, the temporal lag in the explanatory variables
responds to the availability of data, but also makes it possible to mitigate a potential endogeneity problem.
Price and digital illiteracy appear among the most frequently mentioned barriers to the adoption of broadband (Horrigan,
2009).14 Digital illiteracy—the inability to use digital technologies to find, use and create information—tends to be the most
important barrier among older people and those less educated (Hauge and Prieto, 2010). AGE and EDUC are included as
proxies of this determinant of broadband adoption.
The countries analyzed are Argentina, Belize, Bolivia, Brazil, Chile, Colombia, Costa Rica, Ecuador, El Salvador,
Guatemala, Guyana, Honduras, Jamaica, Mexico, Nicaragua, Panama, Paraguay, Peru, Dominican Republic, Suriname,
Trinidad and Tobago, Uruguay and Venezuela. In order to have a greater number of observations for proper statistical
analysis, 29 OECD countries were included in the sample (all the member countries, except for Mexico, which was already
included in the original sample).
The broadband demand function is estimated as follows (the subscript indicates the observation, i.e., the country):
PENETi = f (PRICEi, PBICAPi, AGEi, EDUCi) + ui
PENETi = 0 + 1 PRICEi + 2 PBICAPi + 3 AGEi + 4 EDUCi + ui
Based on previous studies, we expect:

13
   The selection of variables to include in the regression respond to theoretical considerations and data availability, as well as
the need to keep the number of parameters to be estimated low, given the limited number of observations.
14
   The lack of a computer at home is another major barrier, but the lack of current data prevents inclusion of this variable in
the specification. However, given the high correlation between penetration of personal computers and GDP per capita (Chinn
and Fairlie, 2006), the inclusion of PBICAP among the determinants should capture this effect, at least in part.

Proceedings of the 5th ACORN-REDECOM Conference, Lima, May 19-20th, 2011                                                                331
Broadband tariffs in latin america: Benchmarking and analysis - Hernán Galperin (2011)

Weitere ähnliche Inhalte

Was ist angesagt?

Investigating contracts: a how-to guide by open contracting, full of ideas fo...
Investigating contracts: a how-to guide by open contracting, full of ideas fo...Investigating contracts: a how-to guide by open contracting, full of ideas fo...
Investigating contracts: a how-to guide by open contracting, full of ideas fo...DataJournalismUK
 
Universal service a new definition james alleman, paul rappoport, aniruddha...
Universal service a new definition   james alleman, paul rappoport, aniruddha...Universal service a new definition   james alleman, paul rappoport, aniruddha...
Universal service a new definition james alleman, paul rappoport, aniruddha...ACORN-REDECOM
 
Telecommunications reform and effects of competition on availability, quality...
Telecommunications reform and effects of competition on availability, quality...Telecommunications reform and effects of competition on availability, quality...
Telecommunications reform and effects of competition on availability, quality...Alexander Decker
 
11.telecommunications reform and effects of competition on availability, qual...
11.telecommunications reform and effects of competition on availability, qual...11.telecommunications reform and effects of competition on availability, qual...
11.telecommunications reform and effects of competition on availability, qual...Alexander Decker
 
The Growth of the Broadband Internet Access Market in California
The Growth of the Broadband Internet Access Market in CaliforniaThe Growth of the Broadband Internet Access Market in California
The Growth of the Broadband Internet Access Market in CaliforniaJames Prieger
 
Insights Brussels - Oct 2015
Insights Brussels - Oct 2015Insights Brussels - Oct 2015
Insights Brussels - Oct 2015MSL
 
The impact of fixed mobile costs on competition policy
The impact of fixed mobile costs on competition policyThe impact of fixed mobile costs on competition policy
The impact of fixed mobile costs on competition policyroberto ercole
 
Cuba - Telecoms, Mobile, Broadband and Digital Media - Statistics and Analyses
Cuba - Telecoms, Mobile, Broadband and Digital Media - Statistics and AnalysesCuba - Telecoms, Mobile, Broadband and Digital Media - Statistics and Analyses
Cuba - Telecoms, Mobile, Broadband and Digital Media - Statistics and AnalysesMarketResearch.com
 
Empirical evidence on the impact of privatization of fixedline - F. Gasmi (2011)
Empirical evidence on the impact of privatization of fixedline - F. Gasmi (2011)Empirical evidence on the impact of privatization of fixedline - F. Gasmi (2011)
Empirical evidence on the impact of privatization of fixedline - F. Gasmi (2011)ACORN-REDECOM
 
Pricing trends for communication services in the UK - May 2018
Pricing trends for communication services in the UK - May 2018Pricing trends for communication services in the UK - May 2018
Pricing trends for communication services in the UK - May 2018Portal Mediatelecom
 
Kandiyohi county broadband feasibility study proposal 2
Kandiyohi county broadband feasibility study proposal 2Kandiyohi county broadband feasibility study proposal 2
Kandiyohi county broadband feasibility study proposal 2Rich Frank
 
Laffont tirole rey (engl)
Laffont tirole rey (engl)Laffont tirole rey (engl)
Laffont tirole rey (engl)gueste64d459f
 
Nooren net neutrality_tvx_in_industry_2017_v2.2_final_paper
Nooren net neutrality_tvx_in_industry_2017_v2.2_final_paperNooren net neutrality_tvx_in_industry_2017_v2.2_final_paper
Nooren net neutrality_tvx_in_industry_2017_v2.2_final_paperpanooren
 
Broadband Stimulus Opportunities
Broadband Stimulus OpportunitiesBroadband Stimulus Opportunities
Broadband Stimulus Opportunitiespbgrant
 
Status of telecom_competition_report_2012_387881_7
Status of telecom_competition_report_2012_387881_7Status of telecom_competition_report_2012_387881_7
Status of telecom_competition_report_2012_387881_7Translinked
 

Was ist angesagt? (19)

Investigating contracts: a how-to guide by open contracting, full of ideas fo...
Investigating contracts: a how-to guide by open contracting, full of ideas fo...Investigating contracts: a how-to guide by open contracting, full of ideas fo...
Investigating contracts: a how-to guide by open contracting, full of ideas fo...
 
Universal service a new definition james alleman, paul rappoport, aniruddha...
Universal service a new definition   james alleman, paul rappoport, aniruddha...Universal service a new definition   james alleman, paul rappoport, aniruddha...
Universal service a new definition james alleman, paul rappoport, aniruddha...
 
Telecommunications reform and effects of competition on availability, quality...
Telecommunications reform and effects of competition on availability, quality...Telecommunications reform and effects of competition on availability, quality...
Telecommunications reform and effects of competition on availability, quality...
 
11.telecommunications reform and effects of competition on availability, qual...
11.telecommunications reform and effects of competition on availability, qual...11.telecommunications reform and effects of competition on availability, qual...
11.telecommunications reform and effects of competition on availability, qual...
 
The Growth of the Broadband Internet Access Market in California
The Growth of the Broadband Internet Access Market in CaliforniaThe Growth of the Broadband Internet Access Market in California
The Growth of the Broadband Internet Access Market in California
 
Insights Brussels - Oct 2015
Insights Brussels - Oct 2015Insights Brussels - Oct 2015
Insights Brussels - Oct 2015
 
The impact of fixed mobile costs on competition policy
The impact of fixed mobile costs on competition policyThe impact of fixed mobile costs on competition policy
The impact of fixed mobile costs on competition policy
 
Cuba - Telecoms, Mobile, Broadband and Digital Media - Statistics and Analyses
Cuba - Telecoms, Mobile, Broadband and Digital Media - Statistics and AnalysesCuba - Telecoms, Mobile, Broadband and Digital Media - Statistics and Analyses
Cuba - Telecoms, Mobile, Broadband and Digital Media - Statistics and Analyses
 
Empirical evidence on the impact of privatization of fixedline - F. Gasmi (2011)
Empirical evidence on the impact of privatization of fixedline - F. Gasmi (2011)Empirical evidence on the impact of privatization of fixedline - F. Gasmi (2011)
Empirical evidence on the impact of privatization of fixedline - F. Gasmi (2011)
 
Pricing trends for communication services in the UK - May 2018
Pricing trends for communication services in the UK - May 2018Pricing trends for communication services in the UK - May 2018
Pricing trends for communication services in the UK - May 2018
 
Kandiyohi county broadband feasibility study proposal 2
Kandiyohi county broadband feasibility study proposal 2Kandiyohi county broadband feasibility study proposal 2
Kandiyohi county broadband feasibility study proposal 2
 
Analysys Mason UK Broadband Market Oct_2016
Analysys Mason UK Broadband Market Oct_2016Analysys Mason UK Broadband Market Oct_2016
Analysys Mason UK Broadband Market Oct_2016
 
ADL_TimeToBetterLeverageLTE
ADL_TimeToBetterLeverageLTEADL_TimeToBetterLeverageLTE
ADL_TimeToBetterLeverageLTE
 
Laffont tirole rey (engl)
Laffont tirole rey (engl)Laffont tirole rey (engl)
Laffont tirole rey (engl)
 
Pentingnya ict 2
Pentingnya ict 2Pentingnya ict 2
Pentingnya ict 2
 
Nooren net neutrality_tvx_in_industry_2017_v2.2_final_paper
Nooren net neutrality_tvx_in_industry_2017_v2.2_final_paperNooren net neutrality_tvx_in_industry_2017_v2.2_final_paper
Nooren net neutrality_tvx_in_industry_2017_v2.2_final_paper
 
Broadband Stimulus Opportunities
Broadband Stimulus OpportunitiesBroadband Stimulus Opportunities
Broadband Stimulus Opportunities
 
Policy guide
Policy guidePolicy guide
Policy guide
 
Status of telecom_competition_report_2012_387881_7
Status of telecom_competition_report_2012_387881_7Status of telecom_competition_report_2012_387881_7
Status of telecom_competition_report_2012_387881_7
 

Ähnlich wie Broadband tariffs in latin america: Benchmarking and analysis - Hernán Galperin (2011)

Tariffs and the affordability gap in mobile telephone services in latin ameri...
Tariffs and the affordability gap in mobile telephone services in latin ameri...Tariffs and the affordability gap in mobile telephone services in latin ameri...
Tariffs and the affordability gap in mobile telephone services in latin ameri...ACORN-REDECOM
 
Radio Spectrum Valuation by Using Censored Regression Method
Radio Spectrum Valuation by Using Censored Regression MethodRadio Spectrum Valuation by Using Censored Regression Method
Radio Spectrum Valuation by Using Censored Regression Methodwww.nbtc.go.th
 
Broadband economic impact in Brazil - Hildebrando Rodrigues (2011)
Broadband economic impact in Brazil - Hildebrando Rodrigues (2011)Broadband economic impact in Brazil - Hildebrando Rodrigues (2011)
Broadband economic impact in Brazil - Hildebrando Rodrigues (2011)ACORN-REDECOM
 
Broadband Around the World final
Broadband Around the World finalBroadband Around the World final
Broadband Around the World finalJennifer Terry
 
Next Generation National Broadband Network development - A ppp for an open ac...
Next Generation National Broadband Network development - A ppp for an open ac...Next Generation National Broadband Network development - A ppp for an open ac...
Next Generation National Broadband Network development - A ppp for an open ac...Mohamed Bouanane
 
Measuring competitive pressure in mobile telecommunication sectors using oecd...
Measuring competitive pressure in mobile telecommunication sectors using oecd...Measuring competitive pressure in mobile telecommunication sectors using oecd...
Measuring competitive pressure in mobile telecommunication sectors using oecd...ACORN-REDECOM
 
Introduction to effective spectrum pricing
Introduction to effective spectrum pricingIntroduction to effective spectrum pricing
Introduction to effective spectrum pricingNicolas Fichers
 
IEEE 2014 DOTNET NETWORKING PROJECTS Pricing under constraints_in_access_netw...
IEEE 2014 DOTNET NETWORKING PROJECTS Pricing under constraints_in_access_netw...IEEE 2014 DOTNET NETWORKING PROJECTS Pricing under constraints_in_access_netw...
IEEE 2014 DOTNET NETWORKING PROJECTS Pricing under constraints_in_access_netw...IEEEMEMTECHSTUDENTPROJECTS
 
Tprc 2008
Tprc 2008Tprc 2008
Tprc 2008rmf5
 
SharqStream and Sarkor eXtreme marketing analysis 2011
SharqStream and Sarkor eXtreme marketing analysis 2011SharqStream and Sarkor eXtreme marketing analysis 2011
SharqStream and Sarkor eXtreme marketing analysis 2011Miraziz Bazarov
 
2014 IEEE DOTNET NETWORKING PROJECT Pricing under constraints_in_access_netwo...
2014 IEEE DOTNET NETWORKING PROJECT Pricing under constraints_in_access_netwo...2014 IEEE DOTNET NETWORKING PROJECT Pricing under constraints_in_access_netwo...
2014 IEEE DOTNET NETWORKING PROJECT Pricing under constraints_in_access_netwo...IEEEFINALSEMSTUDENTSPROJECTS
 
Content for-all-the-potential-for-lte-broadcast-embms-white-paper
Content for-all-the-potential-for-lte-broadcast-embms-white-paperContent for-all-the-potential-for-lte-broadcast-embms-white-paper
Content for-all-the-potential-for-lte-broadcast-embms-white-paperKamal Kishor Pandey
 
Presentation Broadband Ecosystem (updated 20160119).pptx
Presentation Broadband Ecosystem (updated 20160119).pptxPresentation Broadband Ecosystem (updated 20160119).pptx
Presentation Broadband Ecosystem (updated 20160119).pptxChun Liu
 
Mobile and Broadband Competition
Mobile and Broadband CompetitionMobile and Broadband Competition
Mobile and Broadband Competitionnextgenweb1
 
High Speed Internet Take Rate Brief
High Speed Internet Take Rate BriefHigh Speed Internet Take Rate Brief
High Speed Internet Take Rate Briefradiowebst
 
COMPETE_White_Paper_Evolution_of_Revolution_Final
COMPETE_White_Paper_Evolution_of_Revolution_FinalCOMPETE_White_Paper_Evolution_of_Revolution_Final
COMPETE_White_Paper_Evolution_of_Revolution_FinalLucky Poulos
 
ESOMAR Telephone and Internet Coverage around the World 2016
ESOMAR Telephone and Internet Coverage around the World 2016ESOMAR Telephone and Internet Coverage around the World 2016
ESOMAR Telephone and Internet Coverage around the World 2016T.S. Lim
 

Ähnlich wie Broadband tariffs in latin america: Benchmarking and analysis - Hernán Galperin (2011) (20)

Tariffs and the affordability gap in mobile telephone services in latin ameri...
Tariffs and the affordability gap in mobile telephone services in latin ameri...Tariffs and the affordability gap in mobile telephone services in latin ameri...
Tariffs and the affordability gap in mobile telephone services in latin ameri...
 
Radio Spectrum Valuation by Using Censored Regression Method
Radio Spectrum Valuation by Using Censored Regression MethodRadio Spectrum Valuation by Using Censored Regression Method
Radio Spectrum Valuation by Using Censored Regression Method
 
International traffic
International trafficInternational traffic
International traffic
 
Broadband economic impact in Brazil - Hildebrando Rodrigues (2011)
Broadband economic impact in Brazil - Hildebrando Rodrigues (2011)Broadband economic impact in Brazil - Hildebrando Rodrigues (2011)
Broadband economic impact in Brazil - Hildebrando Rodrigues (2011)
 
Broadband Around the World final
Broadband Around the World finalBroadband Around the World final
Broadband Around the World final
 
Next Generation National Broadband Network development - A ppp for an open ac...
Next Generation National Broadband Network development - A ppp for an open ac...Next Generation National Broadband Network development - A ppp for an open ac...
Next Generation National Broadband Network development - A ppp for an open ac...
 
The Whole Picture: Where America’s Broadband Networks Really Stand
The Whole Picture: Where America’s Broadband Networks Really StandThe Whole Picture: Where America’s Broadband Networks Really Stand
The Whole Picture: Where America’s Broadband Networks Really Stand
 
Measuring competitive pressure in mobile telecommunication sectors using oecd...
Measuring competitive pressure in mobile telecommunication sectors using oecd...Measuring competitive pressure in mobile telecommunication sectors using oecd...
Measuring competitive pressure in mobile telecommunication sectors using oecd...
 
Introduction to effective spectrum pricing
Introduction to effective spectrum pricingIntroduction to effective spectrum pricing
Introduction to effective spectrum pricing
 
Assessment of Latin America Transport Data Availability and Quality
Assessment of Latin America Transport Data Availability and QualityAssessment of Latin America Transport Data Availability and Quality
Assessment of Latin America Transport Data Availability and Quality
 
IEEE 2014 DOTNET NETWORKING PROJECTS Pricing under constraints_in_access_netw...
IEEE 2014 DOTNET NETWORKING PROJECTS Pricing under constraints_in_access_netw...IEEE 2014 DOTNET NETWORKING PROJECTS Pricing under constraints_in_access_netw...
IEEE 2014 DOTNET NETWORKING PROJECTS Pricing under constraints_in_access_netw...
 
Tprc 2008
Tprc 2008Tprc 2008
Tprc 2008
 
SharqStream and Sarkor eXtreme marketing analysis 2011
SharqStream and Sarkor eXtreme marketing analysis 2011SharqStream and Sarkor eXtreme marketing analysis 2011
SharqStream and Sarkor eXtreme marketing analysis 2011
 
2014 IEEE DOTNET NETWORKING PROJECT Pricing under constraints_in_access_netwo...
2014 IEEE DOTNET NETWORKING PROJECT Pricing under constraints_in_access_netwo...2014 IEEE DOTNET NETWORKING PROJECT Pricing under constraints_in_access_netwo...
2014 IEEE DOTNET NETWORKING PROJECT Pricing under constraints_in_access_netwo...
 
Content for-all-the-potential-for-lte-broadcast-embms-white-paper
Content for-all-the-potential-for-lte-broadcast-embms-white-paperContent for-all-the-potential-for-lte-broadcast-embms-white-paper
Content for-all-the-potential-for-lte-broadcast-embms-white-paper
 
Presentation Broadband Ecosystem (updated 20160119).pptx
Presentation Broadband Ecosystem (updated 20160119).pptxPresentation Broadband Ecosystem (updated 20160119).pptx
Presentation Broadband Ecosystem (updated 20160119).pptx
 
Mobile and Broadband Competition
Mobile and Broadband CompetitionMobile and Broadband Competition
Mobile and Broadband Competition
 
High Speed Internet Take Rate Brief
High Speed Internet Take Rate BriefHigh Speed Internet Take Rate Brief
High Speed Internet Take Rate Brief
 
COMPETE_White_Paper_Evolution_of_Revolution_Final
COMPETE_White_Paper_Evolution_of_Revolution_FinalCOMPETE_White_Paper_Evolution_of_Revolution_Final
COMPETE_White_Paper_Evolution_of_Revolution_Final
 
ESOMAR Telephone and Internet Coverage around the World 2016
ESOMAR Telephone and Internet Coverage around the World 2016ESOMAR Telephone and Internet Coverage around the World 2016
ESOMAR Telephone and Internet Coverage around the World 2016
 

Mehr von ACORN-REDECOM

The role of social networks on regulation in the telecommunication industry t...
The role of social networks on regulation in the telecommunication industry t...The role of social networks on regulation in the telecommunication industry t...
The role of social networks on regulation in the telecommunication industry t...ACORN-REDECOM
 
The role of social networks on regulation in the
The role of social networks on regulation in theThe role of social networks on regulation in the
The role of social networks on regulation in theACORN-REDECOM
 
Restricted mobility or restricted competition fixed mobile convergence and un...
Restricted mobility or restricted competition fixed mobile convergence and un...Restricted mobility or restricted competition fixed mobile convergence and un...
Restricted mobility or restricted competition fixed mobile convergence and un...ACORN-REDECOM
 
De la tiza al ratón. escenarios de enseñanza en la formación de periodistas d...
De la tiza al ratón. escenarios de enseñanza en la formación de periodistas d...De la tiza al ratón. escenarios de enseñanza en la formación de periodistas d...
De la tiza al ratón. escenarios de enseñanza en la formación de periodistas d...ACORN-REDECOM
 
Comparing the impact of decline in leased line prices in india and indonesia ...
Comparing the impact of decline in leased line prices in india and indonesia ...Comparing the impact of decline in leased line prices in india and indonesia ...
Comparing the impact of decline in leased line prices in india and indonesia ...ACORN-REDECOM
 
Una alternativa hacia las ngn en las américas redes de banda ancha inalámbric...
Una alternativa hacia las ngn en las américas redes de banda ancha inalámbric...Una alternativa hacia las ngn en las américas redes de banda ancha inalámbric...
Una alternativa hacia las ngn en las américas redes de banda ancha inalámbric...ACORN-REDECOM
 
Restricted mobility or restricted competition fixed mobile convergence and un...
Restricted mobility or restricted competition fixed mobile convergence and un...Restricted mobility or restricted competition fixed mobile convergence and un...
Restricted mobility or restricted competition fixed mobile convergence and un...ACORN-REDECOM
 
The new economics of ict the regulatory implications of post neoclassical eco...
The new economics of ict the regulatory implications of post neoclassical eco...The new economics of ict the regulatory implications of post neoclassical eco...
The new economics of ict the regulatory implications of post neoclassical eco...ACORN-REDECOM
 
Tecnologia de informação e comunicação aplicada à educação marta de campos ...
Tecnologia de informação e comunicação aplicada à educação   marta de campos ...Tecnologia de informação e comunicação aplicada à educação   marta de campos ...
Tecnologia de informação e comunicação aplicada à educação marta de campos ...ACORN-REDECOM
 
Regulation and innovation in the argentinean telecommunications sector mart...
Regulation and innovation in the argentinean telecommunications sector   mart...Regulation and innovation in the argentinean telecommunications sector   mart...
Regulation and innovation in the argentinean telecommunications sector mart...ACORN-REDECOM
 
Reforma legislativa de la televisión ante el futuro digital en chile ¿hacia l...
Reforma legislativa de la televisión ante el futuro digital en chile ¿hacia l...Reforma legislativa de la televisión ante el futuro digital en chile ¿hacia l...
Reforma legislativa de la televisión ante el futuro digital en chile ¿hacia l...ACORN-REDECOM
 
Promoción de la salud sexual y reproductiva y prevención del vihsida en jóven...
Promoción de la salud sexual y reproductiva y prevención del vihsida en jóven...Promoción de la salud sexual y reproductiva y prevención del vihsida en jóven...
Promoción de la salud sexual y reproductiva y prevención del vihsida en jóven...ACORN-REDECOM
 
Políticas y marco normativo orientados al acceso universal y la expansión de ...
Políticas y marco normativo orientados al acceso universal y la expansión de ...Políticas y marco normativo orientados al acceso universal y la expansión de ...
Políticas y marco normativo orientados al acceso universal y la expansión de ...ACORN-REDECOM
 
Only a few roads lead to rome the regulation of entry and broadband performan...
Only a few roads lead to rome the regulation of entry and broadband performan...Only a few roads lead to rome the regulation of entry and broadband performan...
Only a few roads lead to rome the regulation of entry and broadband performan...ACORN-REDECOM
 
O paradoxo da internet regulada a desregulação dos serviços de valor adiciona...
O paradoxo da internet regulada a desregulação dos serviços de valor adiciona...O paradoxo da internet regulada a desregulação dos serviços de valor adiciona...
O paradoxo da internet regulada a desregulação dos serviços de valor adiciona...ACORN-REDECOM
 
La infografía digital género periodístico y recurso pedagógico beatriz elen...
La infografía digital género periodístico y recurso pedagógico   beatriz elen...La infografía digital género periodístico y recurso pedagógico   beatriz elen...
La infografía digital género periodístico y recurso pedagógico beatriz elen...ACORN-REDECOM
 
Inclusión y cohesión social de las políticas públicas vinculadas con las tics...
Inclusión y cohesión social de las políticas públicas vinculadas con las tics...Inclusión y cohesión social de las políticas públicas vinculadas con las tics...
Inclusión y cohesión social de las políticas públicas vinculadas con las tics...ACORN-REDECOM
 
Inclusión digital estudio comparado de políticas públicas de colombia y de br...
Inclusión digital estudio comparado de políticas públicas de colombia y de br...Inclusión digital estudio comparado de políticas públicas de colombia y de br...
Inclusión digital estudio comparado de políticas públicas de colombia y de br...ACORN-REDECOM
 
Impacto de la telefonía celular en zonas rurales pobres del perú liliana ru...
Impacto de la telefonía celular en zonas rurales pobres del perú   liliana ru...Impacto de la telefonía celular en zonas rurales pobres del perú   liliana ru...
Impacto de la telefonía celular en zonas rurales pobres del perú liliana ru...ACORN-REDECOM
 
Factores socioeconómicos y tecnológicos que incidirán en la adopción de la te...
Factores socioeconómicos y tecnológicos que incidirán en la adopción de la te...Factores socioeconómicos y tecnológicos que incidirán en la adopción de la te...
Factores socioeconómicos y tecnológicos que incidirán en la adopción de la te...ACORN-REDECOM
 

Mehr von ACORN-REDECOM (20)

The role of social networks on regulation in the telecommunication industry t...
The role of social networks on regulation in the telecommunication industry t...The role of social networks on regulation in the telecommunication industry t...
The role of social networks on regulation in the telecommunication industry t...
 
The role of social networks on regulation in the
The role of social networks on regulation in theThe role of social networks on regulation in the
The role of social networks on regulation in the
 
Restricted mobility or restricted competition fixed mobile convergence and un...
Restricted mobility or restricted competition fixed mobile convergence and un...Restricted mobility or restricted competition fixed mobile convergence and un...
Restricted mobility or restricted competition fixed mobile convergence and un...
 
De la tiza al ratón. escenarios de enseñanza en la formación de periodistas d...
De la tiza al ratón. escenarios de enseñanza en la formación de periodistas d...De la tiza al ratón. escenarios de enseñanza en la formación de periodistas d...
De la tiza al ratón. escenarios de enseñanza en la formación de periodistas d...
 
Comparing the impact of decline in leased line prices in india and indonesia ...
Comparing the impact of decline in leased line prices in india and indonesia ...Comparing the impact of decline in leased line prices in india and indonesia ...
Comparing the impact of decline in leased line prices in india and indonesia ...
 
Una alternativa hacia las ngn en las américas redes de banda ancha inalámbric...
Una alternativa hacia las ngn en las américas redes de banda ancha inalámbric...Una alternativa hacia las ngn en las américas redes de banda ancha inalámbric...
Una alternativa hacia las ngn en las américas redes de banda ancha inalámbric...
 
Restricted mobility or restricted competition fixed mobile convergence and un...
Restricted mobility or restricted competition fixed mobile convergence and un...Restricted mobility or restricted competition fixed mobile convergence and un...
Restricted mobility or restricted competition fixed mobile convergence and un...
 
The new economics of ict the regulatory implications of post neoclassical eco...
The new economics of ict the regulatory implications of post neoclassical eco...The new economics of ict the regulatory implications of post neoclassical eco...
The new economics of ict the regulatory implications of post neoclassical eco...
 
Tecnologia de informação e comunicação aplicada à educação marta de campos ...
Tecnologia de informação e comunicação aplicada à educação   marta de campos ...Tecnologia de informação e comunicação aplicada à educação   marta de campos ...
Tecnologia de informação e comunicação aplicada à educação marta de campos ...
 
Regulation and innovation in the argentinean telecommunications sector mart...
Regulation and innovation in the argentinean telecommunications sector   mart...Regulation and innovation in the argentinean telecommunications sector   mart...
Regulation and innovation in the argentinean telecommunications sector mart...
 
Reforma legislativa de la televisión ante el futuro digital en chile ¿hacia l...
Reforma legislativa de la televisión ante el futuro digital en chile ¿hacia l...Reforma legislativa de la televisión ante el futuro digital en chile ¿hacia l...
Reforma legislativa de la televisión ante el futuro digital en chile ¿hacia l...
 
Promoción de la salud sexual y reproductiva y prevención del vihsida en jóven...
Promoción de la salud sexual y reproductiva y prevención del vihsida en jóven...Promoción de la salud sexual y reproductiva y prevención del vihsida en jóven...
Promoción de la salud sexual y reproductiva y prevención del vihsida en jóven...
 
Políticas y marco normativo orientados al acceso universal y la expansión de ...
Políticas y marco normativo orientados al acceso universal y la expansión de ...Políticas y marco normativo orientados al acceso universal y la expansión de ...
Políticas y marco normativo orientados al acceso universal y la expansión de ...
 
Only a few roads lead to rome the regulation of entry and broadband performan...
Only a few roads lead to rome the regulation of entry and broadband performan...Only a few roads lead to rome the regulation of entry and broadband performan...
Only a few roads lead to rome the regulation of entry and broadband performan...
 
O paradoxo da internet regulada a desregulação dos serviços de valor adiciona...
O paradoxo da internet regulada a desregulação dos serviços de valor adiciona...O paradoxo da internet regulada a desregulação dos serviços de valor adiciona...
O paradoxo da internet regulada a desregulação dos serviços de valor adiciona...
 
La infografía digital género periodístico y recurso pedagógico beatriz elen...
La infografía digital género periodístico y recurso pedagógico   beatriz elen...La infografía digital género periodístico y recurso pedagógico   beatriz elen...
La infografía digital género periodístico y recurso pedagógico beatriz elen...
 
Inclusión y cohesión social de las políticas públicas vinculadas con las tics...
Inclusión y cohesión social de las políticas públicas vinculadas con las tics...Inclusión y cohesión social de las políticas públicas vinculadas con las tics...
Inclusión y cohesión social de las políticas públicas vinculadas con las tics...
 
Inclusión digital estudio comparado de políticas públicas de colombia y de br...
Inclusión digital estudio comparado de políticas públicas de colombia y de br...Inclusión digital estudio comparado de políticas públicas de colombia y de br...
Inclusión digital estudio comparado de políticas públicas de colombia y de br...
 
Impacto de la telefonía celular en zonas rurales pobres del perú liliana ru...
Impacto de la telefonía celular en zonas rurales pobres del perú   liliana ru...Impacto de la telefonía celular en zonas rurales pobres del perú   liliana ru...
Impacto de la telefonía celular en zonas rurales pobres del perú liliana ru...
 
Factores socioeconómicos y tecnológicos que incidirán en la adopción de la te...
Factores socioeconómicos y tecnológicos que incidirán en la adopción de la te...Factores socioeconómicos y tecnológicos que incidirán en la adopción de la te...
Factores socioeconómicos y tecnológicos que incidirán en la adopción de la te...
 

Kürzlich hochgeladen

TeamStation AI System Report LATAM IT Salaries 2024
TeamStation AI System Report LATAM IT Salaries 2024TeamStation AI System Report LATAM IT Salaries 2024
TeamStation AI System Report LATAM IT Salaries 2024Lonnie McRorey
 
Dev Dives: Streamline document processing with UiPath Studio Web
Dev Dives: Streamline document processing with UiPath Studio WebDev Dives: Streamline document processing with UiPath Studio Web
Dev Dives: Streamline document processing with UiPath Studio WebUiPathCommunity
 
Take control of your SAP testing with UiPath Test Suite
Take control of your SAP testing with UiPath Test SuiteTake control of your SAP testing with UiPath Test Suite
Take control of your SAP testing with UiPath Test SuiteDianaGray10
 
Tampa BSides - Chef's Tour of Microsoft Security Adoption Framework (SAF)
Tampa BSides - Chef's Tour of Microsoft Security Adoption Framework (SAF)Tampa BSides - Chef's Tour of Microsoft Security Adoption Framework (SAF)
Tampa BSides - Chef's Tour of Microsoft Security Adoption Framework (SAF)Mark Simos
 
Transcript: New from BookNet Canada for 2024: BNC CataList - Tech Forum 2024
Transcript: New from BookNet Canada for 2024: BNC CataList - Tech Forum 2024Transcript: New from BookNet Canada for 2024: BNC CataList - Tech Forum 2024
Transcript: New from BookNet Canada for 2024: BNC CataList - Tech Forum 2024BookNet Canada
 
Nell’iperspazio con Rocket: il Framework Web di Rust!
Nell’iperspazio con Rocket: il Framework Web di Rust!Nell’iperspazio con Rocket: il Framework Web di Rust!
Nell’iperspazio con Rocket: il Framework Web di Rust!Commit University
 
Advanced Computer Architecture – An Introduction
Advanced Computer Architecture – An IntroductionAdvanced Computer Architecture – An Introduction
Advanced Computer Architecture – An IntroductionDilum Bandara
 
Designing IA for AI - Information Architecture Conference 2024
Designing IA for AI - Information Architecture Conference 2024Designing IA for AI - Information Architecture Conference 2024
Designing IA for AI - Information Architecture Conference 2024Enterprise Knowledge
 
SAP Build Work Zone - Overview L2-L3.pptx
SAP Build Work Zone - Overview L2-L3.pptxSAP Build Work Zone - Overview L2-L3.pptx
SAP Build Work Zone - Overview L2-L3.pptxNavinnSomaal
 
Connect Wave/ connectwave Pitch Deck Presentation
Connect Wave/ connectwave Pitch Deck PresentationConnect Wave/ connectwave Pitch Deck Presentation
Connect Wave/ connectwave Pitch Deck PresentationSlibray Presentation
 
Story boards and shot lists for my a level piece
Story boards and shot lists for my a level pieceStory boards and shot lists for my a level piece
Story boards and shot lists for my a level piececharlottematthew16
 
H2O.ai CEO/Founder: Sri Ambati Keynote at Wells Fargo Day
H2O.ai CEO/Founder: Sri Ambati Keynote at Wells Fargo DayH2O.ai CEO/Founder: Sri Ambati Keynote at Wells Fargo Day
H2O.ai CEO/Founder: Sri Ambati Keynote at Wells Fargo DaySri Ambati
 
Unleash Your Potential - Namagunga Girls Coding Club
Unleash Your Potential - Namagunga Girls Coding ClubUnleash Your Potential - Namagunga Girls Coding Club
Unleash Your Potential - Namagunga Girls Coding ClubKalema Edgar
 
Advanced Test Driven-Development @ php[tek] 2024
Advanced Test Driven-Development @ php[tek] 2024Advanced Test Driven-Development @ php[tek] 2024
Advanced Test Driven-Development @ php[tek] 2024Scott Keck-Warren
 
CloudStudio User manual (basic edition):
CloudStudio User manual (basic edition):CloudStudio User manual (basic edition):
CloudStudio User manual (basic edition):comworks
 
"ML in Production",Oleksandr Bagan
"ML in Production",Oleksandr Bagan"ML in Production",Oleksandr Bagan
"ML in Production",Oleksandr BaganFwdays
 
Hyperautomation and AI/ML: A Strategy for Digital Transformation Success.pdf
Hyperautomation and AI/ML: A Strategy for Digital Transformation Success.pdfHyperautomation and AI/ML: A Strategy for Digital Transformation Success.pdf
Hyperautomation and AI/ML: A Strategy for Digital Transformation Success.pdfPrecisely
 
Ensuring Technical Readiness For Copilot in Microsoft 365
Ensuring Technical Readiness For Copilot in Microsoft 365Ensuring Technical Readiness For Copilot in Microsoft 365
Ensuring Technical Readiness For Copilot in Microsoft 3652toLead Limited
 
The Ultimate Guide to Choosing WordPress Pros and Cons
The Ultimate Guide to Choosing WordPress Pros and ConsThe Ultimate Guide to Choosing WordPress Pros and Cons
The Ultimate Guide to Choosing WordPress Pros and ConsPixlogix Infotech
 
"Debugging python applications inside k8s environment", Andrii Soldatenko
"Debugging python applications inside k8s environment", Andrii Soldatenko"Debugging python applications inside k8s environment", Andrii Soldatenko
"Debugging python applications inside k8s environment", Andrii SoldatenkoFwdays
 

Kürzlich hochgeladen (20)

TeamStation AI System Report LATAM IT Salaries 2024
TeamStation AI System Report LATAM IT Salaries 2024TeamStation AI System Report LATAM IT Salaries 2024
TeamStation AI System Report LATAM IT Salaries 2024
 
Dev Dives: Streamline document processing with UiPath Studio Web
Dev Dives: Streamline document processing with UiPath Studio WebDev Dives: Streamline document processing with UiPath Studio Web
Dev Dives: Streamline document processing with UiPath Studio Web
 
Take control of your SAP testing with UiPath Test Suite
Take control of your SAP testing with UiPath Test SuiteTake control of your SAP testing with UiPath Test Suite
Take control of your SAP testing with UiPath Test Suite
 
Tampa BSides - Chef's Tour of Microsoft Security Adoption Framework (SAF)
Tampa BSides - Chef's Tour of Microsoft Security Adoption Framework (SAF)Tampa BSides - Chef's Tour of Microsoft Security Adoption Framework (SAF)
Tampa BSides - Chef's Tour of Microsoft Security Adoption Framework (SAF)
 
Transcript: New from BookNet Canada for 2024: BNC CataList - Tech Forum 2024
Transcript: New from BookNet Canada for 2024: BNC CataList - Tech Forum 2024Transcript: New from BookNet Canada for 2024: BNC CataList - Tech Forum 2024
Transcript: New from BookNet Canada for 2024: BNC CataList - Tech Forum 2024
 
Nell’iperspazio con Rocket: il Framework Web di Rust!
Nell’iperspazio con Rocket: il Framework Web di Rust!Nell’iperspazio con Rocket: il Framework Web di Rust!
Nell’iperspazio con Rocket: il Framework Web di Rust!
 
Advanced Computer Architecture – An Introduction
Advanced Computer Architecture – An IntroductionAdvanced Computer Architecture – An Introduction
Advanced Computer Architecture – An Introduction
 
Designing IA for AI - Information Architecture Conference 2024
Designing IA for AI - Information Architecture Conference 2024Designing IA for AI - Information Architecture Conference 2024
Designing IA for AI - Information Architecture Conference 2024
 
SAP Build Work Zone - Overview L2-L3.pptx
SAP Build Work Zone - Overview L2-L3.pptxSAP Build Work Zone - Overview L2-L3.pptx
SAP Build Work Zone - Overview L2-L3.pptx
 
Connect Wave/ connectwave Pitch Deck Presentation
Connect Wave/ connectwave Pitch Deck PresentationConnect Wave/ connectwave Pitch Deck Presentation
Connect Wave/ connectwave Pitch Deck Presentation
 
Story boards and shot lists for my a level piece
Story boards and shot lists for my a level pieceStory boards and shot lists for my a level piece
Story boards and shot lists for my a level piece
 
H2O.ai CEO/Founder: Sri Ambati Keynote at Wells Fargo Day
H2O.ai CEO/Founder: Sri Ambati Keynote at Wells Fargo DayH2O.ai CEO/Founder: Sri Ambati Keynote at Wells Fargo Day
H2O.ai CEO/Founder: Sri Ambati Keynote at Wells Fargo Day
 
Unleash Your Potential - Namagunga Girls Coding Club
Unleash Your Potential - Namagunga Girls Coding ClubUnleash Your Potential - Namagunga Girls Coding Club
Unleash Your Potential - Namagunga Girls Coding Club
 
Advanced Test Driven-Development @ php[tek] 2024
Advanced Test Driven-Development @ php[tek] 2024Advanced Test Driven-Development @ php[tek] 2024
Advanced Test Driven-Development @ php[tek] 2024
 
CloudStudio User manual (basic edition):
CloudStudio User manual (basic edition):CloudStudio User manual (basic edition):
CloudStudio User manual (basic edition):
 
"ML in Production",Oleksandr Bagan
"ML in Production",Oleksandr Bagan"ML in Production",Oleksandr Bagan
"ML in Production",Oleksandr Bagan
 
Hyperautomation and AI/ML: A Strategy for Digital Transformation Success.pdf
Hyperautomation and AI/ML: A Strategy for Digital Transformation Success.pdfHyperautomation and AI/ML: A Strategy for Digital Transformation Success.pdf
Hyperautomation and AI/ML: A Strategy for Digital Transformation Success.pdf
 
Ensuring Technical Readiness For Copilot in Microsoft 365
Ensuring Technical Readiness For Copilot in Microsoft 365Ensuring Technical Readiness For Copilot in Microsoft 365
Ensuring Technical Readiness For Copilot in Microsoft 365
 
The Ultimate Guide to Choosing WordPress Pros and Cons
The Ultimate Guide to Choosing WordPress Pros and ConsThe Ultimate Guide to Choosing WordPress Pros and Cons
The Ultimate Guide to Choosing WordPress Pros and Cons
 
"Debugging python applications inside k8s environment", Andrii Soldatenko
"Debugging python applications inside k8s environment", Andrii Soldatenko"Debugging python applications inside k8s environment", Andrii Soldatenko
"Debugging python applications inside k8s environment", Andrii Soldatenko
 

Broadband tariffs in latin america: Benchmarking and analysis - Hernán Galperin (2011)

  • 1. Galperin et al. Broadband tariffs: Benchmarking and analysis Broadband tariffs in Latin America: Benchmarking and analysis Hernán Galperin Christian Ruzzier Universidad de San Andrés Universidad de San Andrés hgalperin@udesa.edu.ar cruzzier@udesa.edu.ar BIOGRAPHIES Hernan Galperin (Ph.D., Stanford University) is Associate Professor at the Universidad de San Andrés and Independent Researcher at CONICET. Christian Ruzzier (Ph.D., Toulouse University) is Visiting Professor at the Universidad de San Andrés. ABSTRACT We analyze tariffs for fixed broadband services in Latin America and benchmark against tariffs in the OECD. We also develop a new broadband development indicator (the Broadband Performance Index) that compares actual penetration rates with those predicted by our regression model. The results shows that broadband services in Latin America are generally expensive and of poor quality when benchmarked against OCED countries, and that Latin American countries are underperforming in broadband development after wealth, education and demographics factors are accounted for. We also provide price elasticity estimators for broadband demand in Latin America. The results reveal that an average price reduction of 10% would result in an increase of almost 19% in the penetration rate, equivalent to 4.7 million additional broadband connections. Finally we estimate the affordability of broadband services for households in a sample of countries in the region. The results reveal that sharp price reductions would be needed to achieve household penetration rates comparable to the OECD, and that public access initiatives will still be needed to provide services for the lowest-income households. Keywords BROADBAND, TARIFFS, PRICE ELASTICITY, LATIN AMERICA. INTRODUCTION The price level of a service is a key variable for understanding the decisions for its adoption and use by households and businesses. It also reflects the performance and the degree of competition within a sector, making it possible to identify opportunities for regulatory action to strengthen competition and expand market boundaries. However, there is limited research that analyzes the price levels and how they affect demand for broadband Internet access services. This scarcity is even greater for Latin America and the Caribbean, where even national broadband initiatives often lack a solid empirical foundation as to their effect on adoption and use. The lack of studies is due in part to methodological difficulties. First, the initiatives of governments and international agencies to collect data about this service are recent, and there are no standardized methods to compare the multiplicity of plans and packages offered by service operators in different markets.1 Second, the rapid evolution of access technologies (both fixed and mobile) presents another challenge, which is reflected in the multiple business models and service features offered by each operator. Finally, fragmentation into multiple markets at the local or regional level and looser regulatory control, compared to basic telecommunications services, make it difficult to establish market boundaries as well as the universe of service operators to be considered. 1 For a discussion regarding the methodological options, see Wallsten (2009). Proceedings of the 5th ACORN-REDECOM Conference, Lima, May 19-20th, 2011 317
  • 2. Galperin et al. Broadband tariffs: Benchmarking and analysis This paper presents a first approach to analyzing the price levels of broadband Internet access in Latin America and the Caribbean and their effect on demand and penetration levels. It presents a multidimensional approach to the broadband market that combines penetration levels (how many people or households have broadband), quality (service speeds offered by operators), price (how much users have to pay for the service) and affordability (how much this expenditure represents in terms of a household or user’s income). In order to evaluate the performance of the countries in the region in terms of service penetration, this paper presents a metric called the broadband performance index (BPI). This index, developed following the work of Ford, Koutsky and Spiwak (2007) for OECD countries, considers a country’s economic endowments in analyzing the state of broadband development in each nation. In other words, the observed levels of penetration are compared against the predicted levels based on the country’s economic resources and other characteristics that affect broadband adoption. The analysis of the service quality and price levels offered by the leading broadband providers in each country is based on a survey of plans and tariffs conducted by the authors during the second half of May 2010. The survey covered 323 service plans offered by 54 operators in 23 countries in the region. Collected data corresponds to the capital or main city in each country and the universe of operators includes, at a minimum, the leading provider of access via DSL (typically the former telecommunications incumbent), and the largest provider of services via cable modem (if present). In this first approach mobile broadband services were not included. Though several studies reveal the importance of this platform for Internet access in the region, including these services necessitates a broader discussion about the complementarity or competition between fixed and mobile broadband, as well as metrics for comparing service quality levels, all of which goes beyond the scope of this paper. The analysis of broadband affordability aims at comparing observed tariff levels against household income and willingness to pay for the service. This is a valuable tool for designing universal service plans and makes it possible to set realistic goals and to define appropriate policy instruments. Furthermore, disaggregation by income groups within each country allows a better approximation as to the potential effect of tariff reductions on service penetration among lower income households and micro-enterprises. Considering each of the dimensions of broadband services (i.e., penetration, price, quality and affordability) separately, one could reach very different conclusions regarding the development of broadband in the countries of the region. The multidimensional approach taken in this paper makes it possible to analyze simultaneously the different factors that determine the level of broadband development in each country, while taken into account its economic endowments and demographic characteristics. This approach also makes it possible to isolate the effect of the variables of interest to policymakers, identifying best international practices and opportunities to align public policy objectives with the policymaking tools available to governments in the region. Ultimately, the goal is to support broadband development initiatives in Latin America and the Caribbean, offering recommendations to orient private investment, to optimize the use of public resources and to maximize the impact of universal service programs. The paper is organized as follows: the next section presents the broadband performance index (BPI) and discusses its results against traditional penetration indexes. The third section presents the findings of the tariff survey, while the fourth presents the estimates about the effects of these tariffs on penetration levels in the region. The fifth section discusses findings with respect to the affordability of broadband services, while the conclusion outlines policy recommendations drawn from the analysis. THE BROADBAND PERFORMANCE INDEX The measurement most commonly used to establish the level of broadband development in a country is service penetration rate, defined as the number of subscriptions per 100 inhabitants or households. The results obtained with these indicators are often predictable: wealthy developed countries are also those with the highest level of broadband penetration, while less developed countries lag behind in the deployment and adoption of this new technology. As argued by Ford et al. (2007), these results only confirm the findings of an extensive literature that shows a close relationship between economic development and new technology adoption, and in particular between indicators of wealth and the deployment and use of telecommunications networks, which is known as the Jippe Curve.2 In this paper, we use an alternative approach to compare broadband development between countries. The approach is based on comparing, for each country, observed penetration levels with expected penetration levels given a set of economic and demographic factors that previous studies identify as determinants of the adoption and deployment of telecommunications 2 For a general overview of this research, see the World Bank (2008). Proceedings of the 5th ACORN-REDECOM Conference, Lima, May 19-20th, 2011 318
  • 3. Galperin et al. Broadband tariffs: Benchmarking and analysis infrastructure. In other words, rather than comparing countries on the basis of observed penetration levels (the traditional approach), our broadband performance index (BPI) compares countries on the basis of how close they are to expected penetration levels given a set of economic and demographic characteristics that affect both supply and demand for broadband in a given market.3 As such, this indicator is presented as a complement to traditional penetration indicators, rather than a substitute. To calculate the BPI, a simple model of regression is estimated, considering five factors identified in the literature as determinants of the level of broadband penetration (PENET):  GDP per capita in US$ PPP (PBICAP)  Household density per km2 (DENSHH)  Percentage of urban population (POPURB)  Percentage of population between 15 and 64 years old (AGE)  An education index (compiled by United Nations) that comprises the illiteracy rate and the rate of enrollment in primary, secondary and tertiary schools (EDUC). The observed penetration data corresponds to 2009 and was taken from the ITU database (ITU World Telecommunication Indicators ICT 2010). The household data density was calculated for 2008 by the authors based on the number of households reported by the ITU and the surface area of each country. All other variables refer to 2008 and were obtained from the World Bank (World Development Indicators database). The temporal lag in the explanatory variables responds to the availability of data, but can also mitigate potential endogeneity problems because, as shown by several studies, the development of broadband has an impact on aggregate GDP.4 The countries analyzed are Argentina, Belize, Bolivia, Brazil, Chile, Colombia, Costa Rica, Ecuador, El Salvador, Guatemala, Guyana, Honduras, Jamaica, Mexico, Nicaragua, Panama, Paraguay, Peru, Dominican Republic, Surinam, Trinidad and Tobago, Uruguay and Venezuela.5 To obtain a greater number of observations for a proper statistical analysis, 29 OECD countries were included in the sample (all of the member countries, except for Mexico, which is already included in the original sample). The estimated model takes the following form (the subscript indicates the observation, i.e., the country): PENETi = f (PBICAPi, DENSHHi, POPURBi, AGEi, EDUCi) + i PENETi = 0 +1 PBICAPi + 2 DENSHHi + 3 POPURBi + 4 AGEi + 5 EDUCi + i Based on the results of the literature reviewed, the expected results were:  The higher income, the greater the penetration of broadband - 1> 0  The higher the density, the greater the penetration of broadband - 2> 0  The higher the percentage of urban population, the greater the penetration of broadband - 3> 0  The higher percentage of people between 15 and 64 years old, the greater the penetration of broadband - 4> 0  The higher the level of education, the greater the penetration of broadband - 5> 0 Table 1 shows the results of the analysis.6 The proposed model explains about 86% of the variability in broadband penetration. This confirms the importance of the economic and demographic characteristics that affect the development of broadband, and suggests that only a small proportion (14%) of the differences in penetration between countries could be 3 An example illustrates the use of the BPI. It is assumed that a single factor of wealth ‘X’ determines broadband penetration B and that, on average, for every unit of X broadband penetration increases 0.10 units. Thus, the expected penetration in a country i would ßi = 0.1 * X. Now, if the assumption is for two countries A and Z with wealth levels 3 and 5 respectively, the expected penetration would be 0.3 in country A and 0.5 in country Z. If it is found that the actual penetration is 0.35 in country A and 0.45 in country Z, it can be concluded that, although absolute levels of penetration are higher in Z, the level of broadband development is greater in country A when factor endowments are taken into account, while the broadband penetration in country Z is below its potential. (Ford et al., 2007). 4 See Dattaa and Agarwal (2004), Katz (2009), Koutroumpis (2009) and Röller and Waverman (2001). 5 Honduras was excluded due to a lack of comparable data regarding broadband penetration. 6 Estimates were made using Stata/SE 11.1 for Windows, calculating robust standard errors. Proceedings of the 5th ACORN-REDECOM Conference, Lima, May 19-20th, 2011 319
  • 4. Galperin et al. Broadband tariffs: Benchmarking and analysis attributed to other factors. The signs of the coefficients of the determinants are in line with expectations and are significant at 5%, except for the age proxy. Variable Coefficient Statistic p > |t| PBICAP 0.00047 3.65 0.001 DENSHH 0.04992 3.74 0.001 POPURB 0.09119 2.57 0.014 AGE -0.16804 -0.90 0.371 EDUC 54.07643 2.41 0.020 Constant -41.50239 -2.39 0.021 Observations 51 F(5, 45) 53.77 Prob > F 0.0000 R2 0.8649 Source: Prepared by the authors. Table 1. Determinants of Broadband Penetration (OLS Model) The disparity in the magnitudes of the coefficients, in particular education (EDUC), is especially striking but it should be noted that the units of measurement are different for each variable. In order to estimate the marginal effect of different determinants and proceed to a comparison of the impact of each one separately, we examine the effect of a 1% increase in each factor on penetration levels (the effects are observed on the averages for the different variables). Table 2 summarizes these effects: Variable Marginal effect PBICAP +0.66% DENSHH +0.12% POPURB +0.39% AGE -0.65% EDUC +2.92% Sourced: Prepared by the authors. Table 2. Marginal effect on broadband penetration. With these results, we proceed to calculate the BPI. The model’s predicted penetration rate (PENETP) for each country results from the following equation: PENETPi = a0 +a1 PBICAPi + a2 DENSHHi + a3 POPURBi + a4 AGEi + a5 EDUCi In which a represents the estimated coefficients presented in Table 1. The difference between the observed and the predicted penetration is PENETi – PENETPi = ei, where ei is the estimator of i. To facilitate the interpretation of the results, BPI is defined as: Proceedings of the 5th ACORN-REDECOM Conference, Lima, May 19-20th, 2011 320
  • 5. Galperin et al. Broadband tariffs: Benchmarking and analysis BPI = ei / max{|ei|}. Using this procedure, BPI values between -1 and +1 are obtained, where positive values indicate a performance that exceeded expectations, while negative values indicate a performance below expectations. A value close to zero indicates that the country is meeting performance expectations based on its economic endowments and demographic characteristics. Figure 1 presents a ranking of countries in Latin America and the Caribbean according to the BPI.7 For the purpose of comparison with traditional indicators, the ranking of countries in terms of penetration per 100 inhabitants is presented in parentheses. The BPI’s main results are that, in general, the countries of the region are below their potential for broadband development based on their economic endowments and demographic characteristics. Some countries, such as Mexico and Brazil, stand out for meeting expectations with respect to broadband penetration, whereas high penetration countries such as Argentina and Uruguay are well below expected levels of service adoption, given their relatively high levels of income and education and favorable demographics (i.e., high urbanization rates). Moreover, the BPI suggests that certain countries with low penetration rates, such as Paraguay, Nicaragua and Guatemala, fall within their expected levels of penetration or even exceed them. For its part, Chile, a country that leads traditional rankings of penetration in the region, is also below its expected level of broadband development, although the gap is smaller than in the cases of Argentina and Uruguay. Performance below Performance above expectations expectations Belize (15) 0.17 Nicaragua (20) 0.05 Guatemala (21) 0.05 -0.04 Mexico (2) -0.04 Brazil (5) -0.05 Paraguay (17) -0.05 Jamaica (11) -0.06 Costa Rica (8) -0.09 Trinidad & Tobago (4) -0.10 Colombia (10) -0.10 El Salvador (16) -0.11 Bolivia (18) -0.13 Chile (1) -0.14 Surinam (19) -0.15 Guyana (22) -0.15 Dominican Rep. (12) -0.19 Panama (9) -0.23 Peru (14) -0.25 Venezuela (7) -0.25 Ecuador (18) -0.34 Argentina (3) -0.45 Uruguay (6) Source: Prepared by the authors based on ITU (2010). Figure 1. Broadband Performance Index 7 For some countries (Belize, Guatemala and Nicaragua) the model predicts negative penetration rates. In these cases, the predicted value was forced to zero to calculate the BPI. Proceedings of the 5th ACORN-REDECOM Conference, Lima, May 19-20th, 2011 321
  • 6. Galperin et al. Broadband tariffs: Benchmarking and analysis PRICE AND QUALITY INDICATORS The second dimension of interest in the analysis of broadband in Latin America and the Caribbean relates to the observed price levels and quality of service offered by the leading service providers. To account for this dimension—the main purpose of this paper—a survey of all the plans and tariffs offered by the major operators in each country in the region was undertaken. This survey was carried out following the methodology proposed by the OECD, which, among other advantages, allows a comparison of the results for Latin America and the Caribbean with those available for developed countries.8 This methodology considers as broadband all plans whose advertised download speed is greater than 256 kbps. In each country, the universe of operators considered included at a minimum the leading provider of access via xDSL and the largest provider of services via cable modem (if available). We surveyed 323 plans offered by 54 operators in 23 countries. The data corresponds to the capital or main city in each country, and was compiled during the second half of May 2010. Quality (speed) The quality of Internet access services depends on a variety of factors, which include speed and connection stability (measured in terms of fluctuations in latency and packet loss). It is a key variable that affects not only the type of possible uses but also the service applications that can be offered upon the basic access services. The development and adoption of advanced e-commerce, entertainment, online games and distance education, among many other broadband applications, depends heavily on the deployment of high-quality broadband services that can support the high quality requirements of those applications. Typically, Internet access services vary in terms of the download speeds advertised by the service operator, though in some cases the offering includes promises about particular upload speed and connection stability (QoS). In this paper, the download speed advertised by the operator is considered a proxy for quality of service.9 As mentioned above, we follow the ITU definition of broadband as any Internet access services with a minimum 256 kbps download speed. However, the distinction between services proposed by the OECD—low speed (256kbps–2Mbps), average speed (2.5 Mbps–10Mbps), high speed (10Mbps–32Mbps) and very high speed (+35 Mbps)—is added to this definition. In terms of the maximum speeds offered, Chile is the best performer among the countries in the sample, followed by Argentina, Brazil and Colombia (see Figure 2). Only Jamaica, Trinidad and Tobago, Mexico and the Dominican Republic join the group of countries that offer speeds of at least 10 Mbps, the lower end of what the OECD considers "high" speed access. At the other extreme, countries in the fifth quintile (Guatemala, Honduras, Belize, Surinam, Guyana) offer maximum speeds that do not reach 2 Mbps–the 'low speed' access definition of the OECD. None of the countries surveyed at the time had residential plans offering speeds higher than 35 Mbps (or "very high" speed), reflecting the limited deployment of high capacity networks in the local segment in the region (especially FTTH). It is worth noting that the average maximum speed offered in OECD countries is 9.3 times higher than that offered in Latin America and the Caribbean. 8 See http://www.oecd.org/sti/ict/broadband. 9 The speed advertised by the operators is no more than a promise of best efforts; the actual speed at any given time depends on a variety of factors affecting service quality. However, in this paper it is assumed that the relationship between advertised speed and actual speed remains constant between fixed broadband service operators and, therefore, does not affect comparisons between the respective offerings. Proceedings of the 5th ACORN-REDECOM Conference, Lima, May 19-20th, 2011 322
  • 7. Galperin et al. Broadband tariffs: Benchmarking and analysis 80 70 60 50 40 30 20 10 0 Average LATAM Venezuela Average OCDE Argentina Colombia Guatemala Uruguay Chile Brazil Peru Mexico Ecuador Honduras Belize Surinam Jamaica Panama Paraguay Nicaragua Bolivia Guyana Dominicana Rep. Trinidad & Tobago Costa Rica El Salvador Source: Prepared by the authors. Figure 2. Maximum speed offered (in Mbps) The relative ranking of countries practically remains unaltered when considering the average speed for all plans offered in each country (the correlation between the two rankings is 0.97). Chile remains the best performer in terms of the quality of the broadband offering, but well below the average speed offered in OECD countries (which is seven times higher than the regional average). Both indicators place the same countries in the same quintile of performance, with the exception of Bolivia and Honduras, which switch places within the two lowest performing groups (see Figure 3). 18 16 14 12 10 8 6 4 2 0 Bolivia Jamaica Uruguay Nicaragua Brazil Peru Belize Argentina Mexico Costa Rica Paraguay Honduras Surinam Guyana Chile Venezuela Guatemala Average OCDE Colombia Panama Dominican Rep. Ecuador Trinidad & Tobago Average LATAM El Salvador Source: Prepared by the authors. Figure 3. Average Speed Offered (in Mbps) Finally, Table 3 presents the rankings generated by two measurements of speed. A ranking based on the simple average of these indicators is also included. The results confirm Chile, Brazil and Argentina as the countries offering the highest quality broadband service, while Guyana, Surinam, Belize and Guatemala lag behind. Proceedings of the 5th ACORN-REDECOM Conference, Lima, May 19-20th, 2011 323
  • 8. Galperin et al. Broadband tariffs: Benchmarking and analysis Maximum speed offered Average speed Average Country (Mbps) offered (Mbps) Ranking Chile 1 1 1.0 Brazil 3 3 3.0 Argentina 2 5 3.5 Jamaica 5 2 3.5 Colombia 4 6 5.0 Trinidad and Tobago 6 4 5.0 Mexico 7 7 7.0 Panamá 9 8 8.5 Dominican Rep. 8 9 8.5 Costa Rica 11 10 10.5 Paraguay 10 13 11.5 Ecuador 12 12 12.0 Peru 13 11 12.0 Uruguay 14 14 14.0 Venezuela 15 15 15.0 El Salvador 17 17 17.0 Bolivia 16 19 17.5 Honduras 20 16 18.0 Nicaragua 18 18 18.0 Guatemala 19 20 19.5 Belize 21 22 21.5 Surinam 22 21 21.5 Guyana 23 23 23.0 Source: Prepared by the authors. Table 3. Ranking of Advertised Speeds Tariffs The multiplicity of plans, special discount deals and packages offered by broadband operators presents a challenge to comparing tariff levels between countries. In this section we present various indicators that, when combined, provide an approximation to the price level of broadband access in the countries of the region and in relation to developed countries (OECD).10 Following standard methodology, tariffs are converted into US$ PPP to obtain comparable measurements among different countries. Our analysis begins by sorting countries according to the average advertised price of a broadband connection based on all the plans surveyed (see Figures 4 and 5). List prices were computed separately from discounted prices (discounted prices 10 OECD data corresponds to the fourth quarter of 2009. Proceedings of the 5th ACORN-REDECOM Conference, Lima, May 19-20th, 2011 324
  • 9. Galperin et al. Broadband tariffs: Benchmarking and analysis generally offer reduced rates during the first months of service), but the resulting rankings were essentially identical. Given the similarity between the two rankings, list prices are used in the remainder analysis. $350 $300 $250 $200 $150 $100 $50 $0 El Salvador Brazil Uruguay Mexico Paraguay Panama Honduras Ecuador Guyana Surinam Chile Venezuela Guatemala Nicaragua Colombia Peru Belize Bolivia Jamaica Argentina Average LATAM Average OCDE Dominican Rep. Trinidad & Tobago Costa Rica Source: Prepared by the authors. Figure 4. Broadband Tariffs – Average Plan (With Discounts) (In US$ PPP) $400 $350 $300 $250 $200 $150 $100 $50 $0 El Salvador Brazil Panama Nicaragua Honduras Surinam Chile Guatemala Uruguay Mexico Colombia Paraguay Peru Ecuador Guyana Belize Jamaica Venezuela Average LATAM Bolivia Argentina Dominican Rep. Average OCDE Trinidad & Tobago Costa Rica Source: Prepared by the authors. Figure 5. Broadband Tariffs – Average List Price (in US$ PPP) The first interesting result is that countries with good performance in terms of penetration and quality of service do not necessarily stand out in terms of average prices (in particular Argentina and Brazil). However, in general, the results confirm the inhibitory effect exerted by prices on service adoption, as four of the five countries in the bottom quintile of service penetration have tariffs well above average in the region. (the notable exception is Guatemala, with relatively low average tariffs and limited service adoption). Proceedings of the 5th ACORN-REDECOM Conference, Lima, May 19-20th, 2011 325
  • 10. Galperin et al. Broadband tariffs: Benchmarking and analysis As a reference, average prices in the 30 OECD countries are included. On average, prices in Latin America and the Caribbean are nearly 2.5 times higher than those observed in OECD countries, which explains part of the differences in penetration. However, it is worth noting that the best performing countries (Uruguay, Jamaica, Mexico and Chile) have average tariffs comparable to those in OECD countries, and virtually every country in the first and second quintiles offer average prices within 1 standard deviation of the OECD average. Another indicator commonly used is price per megabit per second (Mbps), which allows comparisons based upon a standardized measure of price/quality. In other words, this indicator makes it possible to measure the value obtained in each country for every dollar spent on broadband service. As shown Jamaica, Chile and Mexico still lead the region by offering the lowest price per Mbps. On the other hand, Uruguay is negatively affected in the price per Mbps comparison due to the low average speed offered by its main operator. Venezuela, El Salvador and Guatemala represent similar cases, falling from the second to fourth quintile. This indicator favors, on the contrary, countries with high speed plans such as Argentina and Brazil, since these plans tend to have a lower cost per Mbps (see Figure 6). While countries in the first quintile have a comparable performance with the OECD average (± 1 standard deviation), the average price per Mbps in the region is 15.5 times greater than in developed countries. Again, the key difference are the high and very high speed plans offered in OECD countries; the price/quality ratio is therefore significantly less attractive in Latin America and the Caribbean. $600 $500 $400 $300 $200 $100 $0 Brazil Jamaica Ecuador Peru Chile Mexico Costa Rica Belize Nicaragua Guyana Bolivia Colombia Venezuela Surinam Argentina Uruguay Paraguay Dominican Rep. Honduras Average OCDE Panama Guatemala El Salvador Trinidad & Tobago Average LATAM Source: Prepared by the authors. Figure 6. Broadband Tariffs (in US$ PPP/Mbps) In order to mitigate the bias of the previous indicator, the comparison of plans is segmented based on service speed (see Figures 7, 8 and 9). In the low-speed access segment (256kbps-2Mbps) average tariffs in the region are three times higher than those reported in the OECD countries, a difference that increases to 3.5 times in the medium speed tier (2.5Mbps- 10Mbps) and the high speed tier (10Mbps-32Mbps). Proceedings of the 5th ACORN-REDECOM Conference, Lima, May 19-20th, 2011 326
  • 11. Galperin et al. Broadband tariffs: Benchmarking and analysis $300 $250 $200 $150 $100 $50 $0 Average OCDE Argentina Venezuela Uruguay Paraguay Chile Belize Jamaica Panama Brazil El Salvador Mexico Ecuador Guatemala Nicaragua Honduras Guyana Surinam Peru Bolivia Trinidad & Tobago Costa Rica Colombia Average LATAM Dominican Rep. Source: Prepared by the authors. Figure 7. Broadband Tariffs-Average for Low Speed Plans (in US$ PPP) $800 $700 $600 $500 $400 $300 $200 $100 $0 Venezuela Paraguay Chile Colombia Jamaica Argentina Peru Brazil Uruguay Nicaragua Panama Ecuador Mexico El Salvador Bolivia Average OCDE Trinidad & Tobago Costa Rica Average LATAM Dominican Rep. Source: Prepared by the authors. Figure 8. Broadband Tariffs – Average for Medium Speed Plans (In US$ PPP) Proceedings of the 5th ACORN-REDECOM Conference, Lima, May 19-20th, 2011 327
  • 12. Galperin et al. Broadband tariffs: Benchmarking and analysis $600 $500 $400 $300 $200 $100 $0 Dominican Chile Mexico Brazil Jamaica Average Colombia Argentina Average OCDE Trinidad & LATAM Tobago Rep. Source: Prepared by the authors. Figure 9. Broadband Tariffs – Average for High Speed Plans (In US$ PPP) Finally, the lowest tariffs for broadband Internet access were compared for the countries in the region (Figure 10). The price of the entry-level plan is an important indicator because it establishes the minimum level of spending required by a household or micro-enterprise to access broadband services, and is therefore used in several international comparisons. These plans are a central element of the universal broadband initiatives adopted in various countries, which seek to reduce barriers to adoption by fostering the provision of basic connectivity plans. It comes as no surprise that Uruguay and Venezuela are the best performing countries in the region, since government control over the main telecommunications operator makes it possible to offer basic connectivity plans (typically with low speed and caps on data volume) at reduced tariffs. Something similar is underway in Brazil, where various private operators joined the Banda Larga Popular plan implemented in the State of São Paulo, which offers tax benefits to operators joining the initiative.11 Chile presents the opposite case, falling to the third quintile. Bolivia, Nicaragua, Guyana, Suriname, Honduras and Belize are the worst performers in this indicator, which is consistent with their poor performance in other indicators considered. 11 In various counties in the region, basic plans targeting lower income households are available. These plans, which are similar to subsidized tariffs in basic telecommunications services, contain diverse restrictions on download speed and volumes, and, in some cases, include a pre-pay modality The pre-pay broadband plan offered by telco CANTV in Venezuela for US$ 7 a month, is ADSL access with a download speed of 256 kbps (the minimum for broadband) and 128 kbps upload, with a limit of 500Mb per month. In Uruguay, the state-run telco ANTEL offers a basic plan with a download speed of 1024 kbps and a 2Gb limit for US$ 9 per month (with special discounts). In Brazil, Telefónica offers a plan adhered to the initiative ‘Popular Broadband’ of the State of São Paulo with a download speed of 256 kbps and a download limit of 10Gb for approximately US$ 17 per month. Proceedings of the 5th ACORN-REDECOM Conference, Lima, May 19-20th, 2011 328
  • 13. Galperin et al. Broadband tariffs: Benchmarking and analysis $160 $140 $120 $100 $80 $60 $40 $20 $0 Jamaica Colombia Ecuador Venezuela Brazil Mexico Paraguay Chile Peru Bolivia Panama Guatemala Mínimo OCDE Dominican Rep. Guyana Belize Costa Rica El Salvador Argentina Nicaragua Honduras Surinam Uruguay Trinidad & Tobago Source: Prepared by the authors. Figure 10. Broadband Tariffs – Least expensive Plan (in US$ PPP) Table 4 summarizes the results of the plans and tariffs survey, including a ranking based on the simple average of the various indicators. US$ PPP Average Least US$ PPP ranking discount US$ PPP expensive Country price list price per Mbps plan Jamaica 2 1 1 8 3.0 Mexico 3 3 3 5 3.5 Uruguay 1 2 9 2 3.5 Trinidad and Tobago 5 5 4 3 4.3 Chile 4 4 2 11 5.3 Venezuela 6 6 18 1 7.8 Brazil 11 11 6 4 8.0 Colombia 9 9 5 12 8.8 Costa Rica 10 10 10 6 9.0 Guatemala 8 8 16 10 10.5 El Salvador 7 7 15 14 10.8 Paraguay 13 13 11 7 11.0 Panama 14 14 8 9 11.3 Argentina 12 12 7 15 11.5 Ecuador 18 18 12 13 15.3 Peru 17 17 14 17 16.3 Proceedings of the 5th ACORN-REDECOM Conference, Lima, May 19-20th, 2011 329
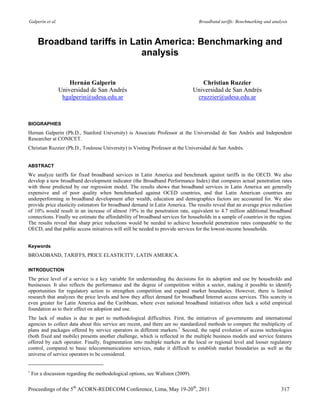
  • 14. Galperin et al. Broadband tariffs: Benchmarking and analysis Nicaragua 15 15 19 19 17.0 Dominican Rep. 20 20 13 16 17.3 Honduras 16 16 17 22 17.8 Guyana 19 19 21 20 19.8 Surinam 21 21 20 21 20.8 Bolivia 23 23 22 18 21.5 Belize 22 22 23 23 22.5 Source: Prepared by the authors. Table 4. Ranking of Tariffs To conclude, the results reveal: 1. A high dispersion of tariffs in the region, even in markets with similar characteristics, suggesting the existence of opportunities for regulatory action aimed at strengthening competition and addressing potential bottlenecks in the various segments that comprise the Internet access market. 2. A lower quality offer and an average level of tariffs significantly higher than in OECD countries, particularly for medium- speed (2.5 Mbps-10Mbps) and high-speed (10Mbps-32Mbps) plans. In the best performing countries in the region, however, tariffs are comparable to those of the OECD, which reinforces the need for the actions mentioned in the previous paragraph. 3. The importance of basic connectivity plans to reduce current price levels and, thereby extend the boundaries of the residential market for broadband Internet access. The results suggest the existence of a balance between price and quality offered, by which some countries stand out in terms of value per Mbps while others do so in terms of low entry-level costs. Uruguay and Venezuela are examples that suggest the potential for demand segmentation to extend connectivity to the base of the income pyramid. ESTIMATING THE EFFECT OF PRICE ON BROADBAND DEMAND The results of the BPI discussed in the second section suggest that broadband adoption depends largely on the wealth and demographic characteristics of individual countries. In other words, it depends on long-term variables upon which policy makers have limited capacity for action in the short term. On the other hand, the price of broadband access services is a variable that governments can act upon through various tools to promote competition and correct market failures. Henceforth the estimated impact of tariff changes on the adoption of the service is a key ingredient in defining broadband policies. The model used for calculating the BPI purposely omits the price variable, since as pointed out by Hauge and Prieto (2010) the penetration level is determined by the interaction between the availability of services, the plans offered and the demand for the service. Therefore, price and penetration are determined simultaneously, which requires other econometric tools to isolate the effect of price on broadband penetration. This section addresses this issue. The correlation between price and penetration indicators suggests that an association between the two variables exists. As an example, Figure 11 shows the simple correlation between the price per Mbps (in PPP dollars) and the penetration rate per 100 households for the 22 countries of Latin America and the Caribbean and the 29 OECD countries in the sample.12 As expected, the lower the price the higher the penetration. 12 Honduras is excluded again due to a lack of comparable data regarding broadband penetration. Proceedings of the 5th ACORN-REDECOM Conference, Lima, May 19-20th, 2011 330
  • 15. Galperin et al. Broadband tariffs: Benchmarking and analysis 90 80 R² = 0.623 70 Penetration 60 50 40 30 20 10 0 $0 $100 $200 $300 $400 $500 $600 Price (US$ per Mbps) Source: The authors and UIT (2010). Figure 11. Correlation between Price (USD PPP/Mbps) and Broadband Penetration (connections per 100 households) In order to isolate the effect of price on broadband demand we start by estimating a simple regression model that considers four demand factors identified by the literature as determinants of the level of broadband penetration (PENET).13  Price: Monthly subscription cost in US$ PPP (PRICE)  Income: GDP per capita in US$ PPP (PBICAP)  Age: percentage of population between 15 and 64 years of age (AGE)  Education: UN education index (EDUC) In the case of PRICE, we use average discount prices in each country (see the third section). For the other variables the data is similar to that used to compute the BPI (see the second section). Again, the temporal lag in the explanatory variables responds to the availability of data, but also makes it possible to mitigate a potential endogeneity problem. Price and digital illiteracy appear among the most frequently mentioned barriers to the adoption of broadband (Horrigan, 2009).14 Digital illiteracy—the inability to use digital technologies to find, use and create information—tends to be the most important barrier among older people and those less educated (Hauge and Prieto, 2010). AGE and EDUC are included as proxies of this determinant of broadband adoption. The countries analyzed are Argentina, Belize, Bolivia, Brazil, Chile, Colombia, Costa Rica, Ecuador, El Salvador, Guatemala, Guyana, Honduras, Jamaica, Mexico, Nicaragua, Panama, Paraguay, Peru, Dominican Republic, Suriname, Trinidad and Tobago, Uruguay and Venezuela. In order to have a greater number of observations for proper statistical analysis, 29 OECD countries were included in the sample (all the member countries, except for Mexico, which was already included in the original sample). The broadband demand function is estimated as follows (the subscript indicates the observation, i.e., the country): PENETi = f (PRICEi, PBICAPi, AGEi, EDUCi) + ui PENETi = 0 + 1 PRICEi + 2 PBICAPi + 3 AGEi + 4 EDUCi + ui Based on previous studies, we expect: 13 The selection of variables to include in the regression respond to theoretical considerations and data availability, as well as the need to keep the number of parameters to be estimated low, given the limited number of observations. 14 The lack of a computer at home is another major barrier, but the lack of current data prevents inclusion of this variable in the specification. However, given the high correlation between penetration of personal computers and GDP per capita (Chinn and Fairlie, 2006), the inclusion of PBICAP among the determinants should capture this effect, at least in part. Proceedings of the 5th ACORN-REDECOM Conference, Lima, May 19-20th, 2011 331