Composite Development Index for Indian States.
•
0 gefällt mir•1,615 views

Central Government in India transfers share of its revenue to states as assistance for the many centrally sponsored schemes. There are various formulas developed by different persons or committee to decide how best to distribute this central assistance. In 2012, Government of India tasked the Raghuram Rajan Committee to evolve yet another measure that would look at the need of the states in a more holistic fashion. This index was also called Underdevelopment or Need based Index and formed a component of the formula for central assistance that included a Fixed Share and Performance Based share apart from Need Based Share. Performance was also to be measured in terms of improvement in CDI over a period.

Empfohlen
Weitere ähnliche Inhalte
Was ist angesagt?
Was ist angesagt? (20)
Andere mochten auch
Andere mochten auch (16)
Ähnlich wie Composite Development Index for Indian States.
Ähnlich wie Composite Development Index for Indian States. (20)
Mehr von Sadanand Patwardhan
Mehr von Sadanand Patwardhan (20)
Kürzlich hochgeladen
Kürzlich hochgeladen (20)
Composite Development Index for Indian States.
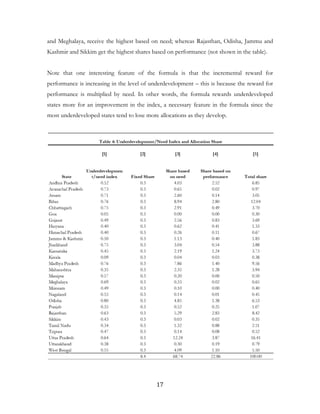
- 1. 17 and Meghalaya, receive the highest based on need; whereas Rajasthan, Odisha, Jammu and Kashmir and Sikkim get the highest shares based on performance (not shown in the table). Note that one interesting feature of the formula is that the incremental reward for performance is increasing in the level of underdevelopment – this is because the reward for performance is multiplied by need. In other words, the formula rewards underdeveloped states more for an improvement in the index, a necessary feature in the formula since the most underdeveloped states tend to lose more allocations as they develop. http://finmin.nic.in/reports/Report_CompDevState.pdf
- 2. 27 Table A1. Index for Underdevelopment: Sub-Components and Sources Variables Source (Base Year) Source (Current Year) 1. Income MPCE 2004-05, NSSO 2011-12, NSSO 2. Education Attendance Ratio No. of Education Institution in Primary/ Junior Basic School & Middle/Sr. Basic School 2004-05, NSSO Economic Survey(200 7-08) 2009-10, NSSO Economic Survey (2012-13) 3. Health IMR SRS Bulletin 2005- 06 SRS Bulletin October 2012 4. Household Amenities Index % of HH with drinking water within premises % of HH with no sanitation facilities % of HH with Telephone/ mobile service % of HH with no specified asset % of HH with electricity as primary source of lighting Census 2001 Census 2011 5. Poverty Ratio Planning Commission (2004- 05) Planning Commission (2011- 12) 6. Female Literacy Rate Primary Census Abstract (PCA, 2001) Primary Census Abstract (PCA, 2011)7. % of SC-ST population 8. Urbanization Rate 9. Financial Inclusion % of HH with banking facility Primary Census Abstract (PCA, 2001) Primary Census Abstract (PCA, 2011) 10. Connectivity Index Length of Surface National Highways per 100 sq km Length of Surface State Highways per 100 sq km Other Surface Road per 100 sq km Rail route per 100 sq km. Basic Road Statistics of India July 2010 Indian Railways: Year Book (2004- 05) Basic Road Statistics of India, August 2012 Indian Railways: Year Book (2010- 11)
- 3. 31 Appendix 5: Underdevelopment/ Need Index based on Per Capita Net State Domestic Product Underdevelopment/ Need Index Based on Per Capita NSDP5 Andhra Pradesh 0.54 Arunachal Pradesh 0.74 Assam 0.71 Bihar 0.76 Chhattisgarh 0.74 Goa 0.05 Gujarat 0.50 Haryana 0.43 Himachal Pradesh 0.42 Jammu & Kashmir 0.53 Jharkhand 0.74 Karnataka 0.48 Kerala 0.15 Madhya Pradesh 0.76 Maharashtra 0.37 Manipur 0.58 Meghalaya 0.70 Mizoram 0.52 Nagaland 0.57 Odisha 0.79 Punjab 0.39 Rajasthan 0.65 Sikkim 0.41 Tamil Nadu 0.36 Tripura 0.47 Uttar Pradesh 0.65 Uttarakhand 0.39 West Bengal 0.56 5 In this index per capita consumption is replaced by per capita NSDP. Other variables remain the same as they are in the index presented in Table 4.
- 4. 44 importantly, a correlation coefficient of 0.85 does not at all imply that one may be used in place of the other. I have already indicated that there are major omissions when one uses MPCE. 11. That the MPCE-based index is not able to adequately capture the disadvantages of the poorer States will be evident from the table below, where I arrange the States whose Per Capita GSDP is below the national average in 2011-12 in order of their Per Capita GSDP, going from the lowest to the highest in this category. I compute the Per Capita GSDP score using the same normalization procedure as per our Committee. It turns out that correlation coefficient between their PCI and backwardness scores is only 0.48 and between their ranks is only 0.41, both of which are very weak correlations by any standard. The table actually shows how distortionary the proposed backwardness index is, and how radically it alters the income gap of the backward States from the All-India average. State Per Capita GSDP 2011-12 PC Income Score Our Index Score Income Rank Our Index Rank Bihar 25,023 1.00 0.76 1 2 Uttar Pradesh 33,732 0.95 0.64 2 9 Manipur 36,871 0.93 0.57 3 11 Assam 41,098 0.91 0.71 4 7 Jharkhand 41,134 0.91 0.75 5 4 Madhya Pradesh 42,493 0.90 0.76 6 2 Odisha 51,130 0.85 0.80 7 1 Tripura 54,682 0.83 0.47 8 17 Chhattisgarh 54,712 0.83 0.75 9 4 Jammu & Kashmir 55,886 0.82 0.50 10 14 Mizoram 60,181 0.80 0.49 11 15 West Bengal 60,484 0.80 0.55 12 12 Rajasthan 60,868 0.79 0.63 13 10 Nagaland 60,903 0.79 0.55 14 12 Meghalaya 61,283 0.79 0.69 15 8 As can be seen from the table above, Odisha, which is by far the most backward according to the proposed index, has double the per capita income of Bihar which has the lowest per capita income; and as many as five states in between them have ranks varying wildly from 2 to 11. Similarly, Gujarat, one of the most economically
- 5. 45 prosperous states of India, appear in the list as a 'less developed' state, with an underdevelopment index of 0.49. By replacing Per Capita GSDP with MPCE, the suggested index will considerably deprive the poorer States of precious resources that are mediated through the Planning Commission and Finance Commissions. I honestly think that an index based on Per Capita GSDP is more likely to generate a consensus at the All-India level than the one based on MPCE. 12. In the proposed index, the income-deprivation of the disadvantaged States (the most serious of all deprivations) is underestimated first by considering MPCE, in place of Per Capita GSDP, and then by assigning a less than due weightage to even MPCE. The most preferred procedure for finding the relative importance of different variables in analysing multi-variate data is Principal Component Analysis (PCA). This was indeed done by the Committee, resulting in factor loadings that ranged from 0.02 to 0.16. These factor loadings do differ significantly and one wonders why the Report opts for equal weightage (0.10) for all variables. It does not make sense to assign equal weight to MPCE (factor loading 0.16) and Percentage of SC/ST Population (factor loading 0.01). In defence of the equal weights for all sub- components, the Report mentions that the exercise is 'simple'; but surprisingly for assigning weights to various indicators within a sub-component, the Committee has choosen the technique of Principal Component Analysis (PCA). Obviously, the well- established technique of PCA cannot be 'complex' in one point and 'simple' in another one, within the same exercise. 13. It is completely wrong to say that MPCE better measures the population well-being and that Per Capita Income does not adequately measure what reaches the people. As mentioned above, MPCE, which is only household consumption, gives only a part of the total picture. Manufacturing, mining and modern service sector generate wage, salaries and rental incomes for the local population, both directly and indirectly. It is well known that only a small part of the gross profit is distributed as dividend income, the largest part being ploughed back as investment, while tax
- 6. Sr. No. State Composite Index of (Under) Developme mnt Sr. No. State Composite Index of (Under) Developmem nt 1 Goa 0.05 1 Goa 0.05 2 Kerala 0.09 2 Kerala 0.15 3 Tamilnadu 0.34 3 Tamilnadu 0.36 4 Maharashtra 0.35 4 Maharashtra 0.37 5 Punjab 0.35 5 Punjab 0.39 6 Uttarakhand 0.38 6 Uttarakhand 0.39 7 Haryana 0.40 7 Sikkim 0.41 8 Himachal Pradesh 0.40 8 Himachal Pradesh 0.42 9 Sikkim 0.43 9 Haryana 0.43 10 Karnataka 0.45 10 Tripura 0.47 11 Tripura 0.47 11 Karnataka 0.48 12 Gujarat 0.49 12 Gujarat 0.50 13 Mizoram 0.49 13 Mizoram 0.52 14 Andhra Pradesh 0.52 14 Andhra Pradesh 0.54 15 Nagaland 0.55 15 West Bengal 0.56 16 West Bengal 0.55 16 Nagaland 0.57 17 Manipur 0.57 17 Manipur 0.58 18 Rajasthan 0.63 18 Rajasthan 0.65 19 Uttar Pradesh 0.64 19 Uttar Pradesh 0.65 20 Meghalaya 0.69 20 Meghalaya 0.70 21 Assam 0.71 21 Assam 0.71 22 Arunachal Pradesh 0.73 22 Arunachal Pradesh 0.74 23 Chhattisgarh 0.75 23 Chhattisgarh 0.74 24 Jharkhand 0.75 24 Jharkhand 0.74 25 Bihar 0.76 25 Bihar 0.76 26 Madhya Pradesh 0.76 26 Madhya Pradesh 0.76 27 Odisha 0.80 27 Odisha 0.79 Based on Monthly Per Capita Consumption Expenditure(MPCE) Based on Net State Domestic Product (NSDP)