A binary graphics recognition algorithm based on fitting function
•
0 gefällt mir•896 views

A binary graphics recognition algorithm based on fitting function

Empfohlen
Weitere ähnliche Inhalte
Was ist angesagt?
Was ist angesagt? (14)
Andere mochten auch
Andere mochten auch (20)
Ähnlich wie A binary graphics recognition algorithm based on fitting function
Ähnlich wie A binary graphics recognition algorithm based on fitting function (20)
Mehr von Lixun Peng
Mehr von Lixun Peng (20)
Kürzlich hochgeladen
Kürzlich hochgeladen (20)
A binary graphics recognition algorithm based on fitting function
- 1. A binary graphics recognition algorithm based on fitting recogni function Lixun Peng and Dechang Pi College of Information Science and Technology, Nanjing University of Aeronautics and Astronautics, Nanjing, Jiangsu, 210016, China 【Abstract】Graphics recognition is the identification of specific graphics from a print or a piece of handwriting. When the graphics are irregular and complex, especially the recognition function is required to classify exactly the graphics into the correct classification, and also high efficiency of implementation is demanded at the same time, to identify them will become very complicated. In this paper, a fitting function bases on the graphics recognition method has been proposed. The idea is that by using some polynomial to fit for the graphics, and then compare with sample fitting function in the template. Through the analysis of variance, the most similar template will be the result of recognition. Though testing we find that this algorithm is effective. 【Key Words】 Pattern Recognition; graphics; images; fitting; polynomial 1 Introduction Nowadays, the general graphics recognition algorithms base on the analysis of the dot-matrix of the graphics. This way has significant limitations to graphics which consist of complex lines. For example, there are specific ways to recognize Chinese characters, and so do the English words. As a result, even the same algorithms will be realized by different programs. Especially when a variety of types of symbols have been mixed together, most algorithms are difficult to identify them. And it becomes more complicated if the input is a piece of handwriting. Existing general graphics recognition algorithms, such as template matching algorithm, use the training samples to describe the average eigenvalue, and reorganization of classifier bases on the distance between input sample’s feature and reference characteristic of each character. Because of the existence of a wide variety of Chinese characters fonts, and the various deformations of handwritten Chinese characters, any feature of the documents has a distribution space. The more distribution spaces are considered, the more precise the classify recognition will be. Hence, it’s not enough to describe the characteristics only by the average of the eigenvalue. Another example is Bayesian classification algorithm, which takes piecewise linear function to describe the probability density function of the Chinese characters’ feature. In this way, the feature distribution of Chinese characters can be identified easily. However, the distribution of eigenvalue is not a simple statistical one. As a result, if there is no easy way to describe the probability density function, that means all the storage space of the probability density function of any dimensional features cannot be afforded by the practical system. Further, both these two ways don’t do well in complex graphics classification and are also implementation inefficient. This paper presents an algorithm, which bases on the lines fitting to the graphics. Meanwhile, the recognition algorithm will be generated and it will describe all the complex graphics by polynomial functions. The recognition will be done though the analysis of the similarity between
- 2. fitting functions and standard functions in template library. This sort of recognition is different with currently all other methods. According to the literature search of new knowledge, we have never seen any report based on this way of recognition. And this algorithm also contains a binary vector graphics method at the same time. 2 relevant definitions Definition 1 Line segment (LS) and Line Segment Set(LSS) If a set of continuous, constituted by a number of points, and the sequence of the points can be fitted at the same time, this will be defined as the Line Segment (this can be the curved segment or line segment). The sequence of segments consist the Line Segment Set. Definition: LS=((X1,Y1),(X2,Y2),...,(Xi,Yi),...,(Xn,Yn)),n is the number of the points LSS=(LS1,LS2,..LSi,...,LSm),m is the number of the line segments And Xi、Yi∈Z,LS∈LSS,i、n、m∈Z+,|Xi-Xi-1|<=1,|Yi-Yi-1|<=1。 Definition 2 Feature points of the line (LC) and feature points set(LCS) For a line segment LS which consists of n points, m points will be selected from it to fit. Every selected point is called the Feature Points of Line LS, and the sequence which is structured by m feature points will be known as Feature Points Set. Definition: LC∈LS。 LCS={LC1,LC2,...,LCi,…,LCm},m is the number of the feature points And LCi∈LS,0≤i≤m≤n。 Definition 3 Best fitting function (BFF): Make use of line feature points’ set LCS of line segment LS, through which to fit the line segment and n-degree polynomial Y(X) or X(Y) will be obtained. Polynomial Y(X) or X(Y) will be known as the fitting function of this line segment. Among all the functions, the best fitting one will be defined as Best Fitting Function. Definition: BFF(X)=An*+An-1*+…+A0*,Flag assigns 0。 BFF(Y)=An*+An-1*+…+A0*,Flag assigns 1. And Ai∈R,i、n∈Z+ Definition 4 Best Fitting Vector (BFV) Vector which is composed by best fitting function’s coefficient Ai and Flag of Type Y(X) or Type X(Y) will be defined as Best Fitting Vector. Definition: BFV=(Flag,An,An-1,…,Ai,…A0) And Ai∈R,i、n∈Z+ Definition 5 Strokes (SK) A set consists of best fitting functions which has similar properties will be defined as Strokes. And it is the smallest unit of divisible element in the identifiable symbols set. Definition: SK={BFV1,BFV2,…,BFVi,…,BFVn},n is the stroke’s template sample number And: i,n∈Z+ For instance, the fitting vectors which are approximately paralleling X-axis in all Chinese
- 3. characters will form a set. And this set will be defined as “Horizontal Line”. Definition 6 Strokes Set (SKS): All the strokes in the symbols set which can be identified will form a set, which will be defined as Strokes Set. Definition: SKS={SK1,SK2,…,SKi,…,SKn},n is the number of the strokes And i,n∈Z+ For instance, all Chinese characters are formed by “Horizontal Line”“Top-Down Vertical Line”“Left-Downward slope line” and some other basic stroke sets. Definition 7 Symbol Vector (SV): If a vector which is constructed by n stroke elements, can donate a vector which to be identified or can be identified, it will be defined as Symbol Vector. When necessary, a graphic element can be included to record a symbol’s graphic information, in order to identify more precisely. Definition: SV=(SK1,SK2,…,Ski,…,SKn),n is the number of the strokes which construct this symbol And: i,n∈Z+ For example, Chinese character “ 十 ” is constructed by “Horizontal Line” and “Top-Down Vertical Line” in Chinese character stroke sets. Thus, symbol “十” consists of vector (Horizontal Line, Top-Down Vertical Line). Definition 8 Symbols Set (SVS): The set which is constructed by all the identifiable symbol vectors will be defined as Symbols Set. Definition: SVS={SV1,SV2,…,SVi,…,SVn},n is the number of identifiable symbol vectors And i,n∈Z+ Definition 9 Knowledge Base (KB): Stroke set’s and symbols set’s template constitute a template library, which will be defined as Knowledge Base. Definition: KB=<SKS,SVS> Definition 10 Similarity Degree (Smlt): The degree of how similar the sample to be identified and the symbols set’s template in the knowledge base will be defined as Similarity Degree. 3 Data Structure Declaration typedef struct{ int x,y; }Point_Type; //definition of Point Type typedef queue<Point_Type> Queue_Type; // Queue typedef bool* Cov_Type; // Cover table type definition
- 4. typedef bool Flag_Type; // Flag of fitting type definition typedef vector<Point_Type> LS_Type; // Line segment type definition typedef vector<LS_Type> LSS_Type; // Line segment set type definition typedef Point_Type LC_Type; // Feature point type definition typedef vector<LC_Type> LCS_Type; // Feature point set type definition typedef struct{ Flag_Type Flag; // Line segment Y(X) Type assigned 0; Line segment X(Y) Type assigned 1; vector<double>A; // Vector of line segment fitting function’s coefficient long Length; // Length of line segment,it can be defined by users Point_Type Start; // Start of line segment,it can be defined by users LS_Type LS; // Point set of line segment,it can be defined by users LCS_Type LCS; // Feature point set of line segment,it can be defined by users }BFV_Type; // Best fitting vector type definition typedef struct{ set<BFV_Type> BFVS; // Best fitting vectors which constitute the stroke int Num; // Number of the strokes string Name; // Name of the stroke } SK_Type; typedef set<SK_Type> SKS_Type; // Set of stroke type definition typedef struct{ vector<SK_Type> SKV;//Stroke vector sets which constitute the symbol vector bool Is_Order // Whether the stroke is written orderly int Num; // Number of the symbol string Name; // Name of the symbol Bitmap Pic; // Image of the symbol,it can be defined by users }SV_Type; // vector of the symbol typedef set<SV> SVS_Type; // Set of symbol type definition typedef struct{ SKS_Type SKS; // Template Library of stroke set in knowledge base SVS_Type SVS; // Template Library of symbols set in knowledge base }KB_Type; // Knowledge base type definition 4 Ways to solve the problems One ways to deal with interference A. Thresholding(Image processing) This algorithm can only deal with binary images, so we use thresholding to create binary images first. Thresholding algorithms have been very sophisticated,this paper will not repeat them again. B. Notes extraction A sample from the handwriting must be extracted, if the lines are not thick at one pixel (key strokes). Then recognition can be done through the algorithms introduced by this paper. The algorithms about notes extract have been very sophisticated, this paper will not repeat them again.
- 5. C. Elimination buffeting in the line segment There are several reasons may directly lead to the existence of the line segment buffetings. Because of the delay of hardware and the problems of development environment itself, it is possible to break the line and the split part of buffeting into a segment. This paper will offer a simple way to eliminate buffeting. That is, we will random select some points of a certain density in the handwriting, and connect the most adjacent ones with lines and at the same time the distances between these points must be within a threshold. Usually, if we set the density and the threshold reasonably, a substantial portion of the jitter in the new image can be effectively eliminated, especially to the online input when the points’ input order can be approached. Meanwhile, contour vectorization algorithm in the citation [6] is also a good way to eliminate buffeting, and this paper will not repeat them again. D. Connection of the breakpoint When off-line identification is taken, various reasons may result in the unclear of the image. The accuracy of this algorithm depend on the correct split of the line segment, as result, if the original image is a line, and break points appear after recognition, and this will lead to a sharp decline in recognition accuracy. A lot of discussions about the treatment of this problem have been made, and this paper provides an easy way to connect the breakpoints. Similar to the ways to eliminate of the jitters in the line segment, we will random select some points of a certain density in the handwriting, and connect the most adjacent ones with lines and also the distances between these points must be within a threshold. Usually, if we set the density and the threshold reasonably, a substantial portion of the breakpoints caused by lack of clarity in the new image can be effectively eliminated. Two ways to deal with the spilt in line A. On-line recognition: (1) Initialize two cover tables CovX and CovY. They are used to record the coverage of X- axis and Y-axis, and set the items as False (it means that they are not covered). (2) Create two empty queues QueueX and Queue Y. The sequence of points will be pushed as Y(X) record type and X(Y) record type into the two queues separately. (3) Each time we get a point (Xi, Yi), we’ll check whether Xi’s and Yi’s status in CovX and CovY is False or not. If the status of Xi in CovX is False, (Xi, Yi) will be pushed into QueueX, and the status of Xi will be changed into True. Similarly, if the status of Yi in CovY is False, (Xi, Yi) will be pushed into QueueY, and the status of Yi in will be changed into True. Cycle this process until conflict occurred in one Cov table (that is, the corresponding status of Xi or Yi the algorithm going to set has already been True). Then the process will be moved to (4). If all the points have been haddled, the process will be moved to (5). (4) If conflict happened in one Cov table, all the elements in corresponding queue will be popped and reset Cov table. Another Cov table will continue step (3) until conflict occurred. Then pop the corresponding queue to the line segment LS [j], and clear table Cov. For instance, if the data we get is (Xi, Yi), and status of Xi in CovX is True, the QueueX will be cleared, and CovX will be reset as False. Meanwhile, CovY and QueueY will continue (3) until conflict occurred in CovY. Then, elements in QueueX will be
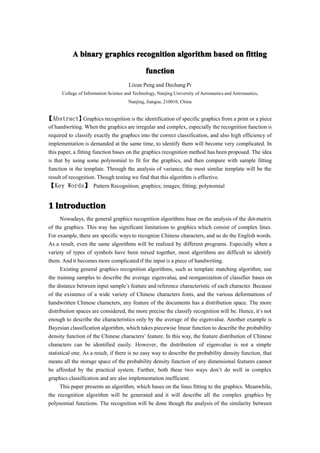
- 6. popped and stored in the LS[j], and reset CovY as False, j=j+1. After all these, the program will re-enter (3). (5) If one line is finished, the program will enter (1) and split the next one. If there is no more point can be obtained, the program comes to the end. B. Off-line recognition (1) In accordance with from left to right and from top to bottom of the scanning method, as long as the scan to one point, similar to the seed-filling method of proliferation on this point will be used. And all the possible lines will be connected , and then used online recognition ways to generate LS. And then switch into (2). (2) Each time a segment is token, it will be checked whether it has any crossing with other segments. If there is no cross on this segment, it will be deleted from the graphics. If there are crosses on this segment, cross-point will be added. And then, move to (1). Repeat this step until there is no point in the graphics. Reference [6] has offered an algorithm about how to estimate whether it has crossings with other lines. This paper will not repeat them again. Three Ways to choose feature points The starting point of line segment (X1, Y1) and end point (Xn, Yn) should be selected, and the rest of the points should base on certain rules from the various parts of the line. For instance, every (n +1) div m points will be chosen as a feature point. And it should ensure that feature points can describe in the outline of the original line segment. Four Ways to handle the best fitting function: A. ways to obtain the value of n (n is the degree of the best fitting function): n start to fit from 1, and get the value of (fitting similarity degree). Whenever n +1 can make increase by a threshold α, for example, α = 5%, and then get n +1 for the current n, and judge on it until the degree of the best fitting function equals n+1 and can’t make increase by a threshold α. B. Ways to obtain the value of Ai(Ai is the coefficient of the best fitting function): Ai is a coefficient, and if the absolute value is less than a threshold β. For instance, β = 1E-3, and then delete to test whether will decrease by a threshold γ. Let’s take γ = 5% as an example, if γ is not decreased by that much, will be removed, that is Ai equals 0. Briefly speaking, the expression with the least degree and the least terms will be chosen to express the highest possible fit. Let’s take segment in Graph 1 as an example. A series of feature points will be taken, and threshold α = 5%: LCS={(0,0),(1,1),(2,3),(3,6),(4,10),(5,15),(6,20),(7,28),(8,34),(9,45),(10,55),(11,66),(12,79),( 13,90),(14,104)}
- 7. (Graph 1. red for line segment, blue for first-order fitting, green for second-order fitting) When n = 1, after first-order fitting, the fitting function is Y1 = 7.439*X-22.58,= 936. When n = 2, after second-order fitting, the fitting function is Y2 = 0.504*-0.626*X+0.272,= 0.999. It is obvious that when n changes from 1 to 2, increases (0.999-0.936)/0.936=6.7%, and this is greater than threshold 5%. Thus, the present best fitting function is Y2=0.504*-0.626*X+0.272. (Graph 2. red for line segment, blue for first-order fitting, green for second-order fitting, black for third-order fitting) When n=3, after third-order fitting, the fitting function is Y3=8E-05*+0.502*+0.252,=0.999. It can be seen that when n changes from 2 to 3, has almost not changed, and the increment is less than threshold 5%. Thus, the best fitting function is Y2=0.504*-0.626*X+0.272. Way 5 Ways to handle with best fitting vectors When necessary, for example, the line segments with different length must be recognized as
- 8. different graphics, or the length of the line segments at different proportion of the overall situation will affect the identification results, a length element can be added to the fitting vectors, and the length of the line segments should be recorded. Only when it works as an image vectorization algorithm, a start point element can be added, and record the start point of the line segment at the same time. By these elements, the original graphics can be restored through the best fitting vectors. For instance, the best fitting function in Graph 2 is Y2=0.504*-0.626*X+0.272. If the optional part is not considered, it is a 3+1 dimensional vector BFV = (0,0.504,0.626,0.272). Way 6 split the character into stroke To split the identifiable symbols sets into stroke should base on the principle that it’s easy for the program to practice, rather than some everyday habits. Let’s take“ 马 ” as an example.(It’s a Chinese character.) In Chinese way of writing it, its stroke is “┐,ㄅ,ー”. However, in order to simply the process, “┐” should be split into . “Horizontal Line” “ Top-Down Vertical Line” two strokes. “ㄅ” should be split into “Top-Down Vertical Line” “Horizontal Line” “ Top-Down Vertical Line”, and the last part “丶” can be ignored. Considering the convenience for the program, the split solution should be “Horizontal Line” “Top- Down Vertical Line” “Top-Down Vertical Line” “Horizontal Line” “Top-Down Vertical Line” “Horizontal Line”. Assuming that “Horizontal Line” is marked by 1, and “Top-Down Vertical Line” is marked by 2, the result of the stroke sequence is 1 2 2 1 2 1. Way 7 Ways to deal with similarity degree First of all, according to the besting fitting vectors split by graphics, find the best fitting strokes in the knowledge base’s strokes set, and generate symbol vector. Secondly, use the best fitting symbol found by symbol vector in the knowledge base’s symbols set. On the one hand, if the strokes are in order, the search will be fit both in strokes and order. On the other hand, if the strokes are not in order, the order of search strokes’ number and type will not be considered. If not only the same number of strokes cannot be found, but also the exact same strokes cannot be searched, the closest match principle will be adopted to find the closest symbol. For orderly strokes character vector, then each character which matches to the maximum correct strokes number by sequence can be adopted. If strokes are disordered, then the character whose strokes can match a maximum number of strokes in characters to be identified will be adopted. And according to required, character vector’s image can be obtained. By contracting the images, the result will be confirmed. 5 The description of the algorithm 5.1.Language description: S1: Set up knowledge base; S2: Input samples; S3: Samples analysis (1) Separate the graphics of the stroke from the graphics; ????? (2) Analyze the graphics of the stroke, categorize it into the right stroke in the stroke set;?? (3) Generate the identified symbol sequence according to whether it is in order or not; S4: Samples recognition (1) To find the best fitting templates in the templates bases on whether it is in order or not;
- 9. (2) Extract the graphics of these templates and compare them with the sample; ??? (3) Choose the best fitting graphics as recognition result;??? (4) According to the user’s need to decide whether the new sample will be restored as a template; S5: Output the result 5.2. Description of related parameters: (1) LSS_Type LSS; //Line segment set type (2) LFS_Type LFS; //Sequence type of line segment feature points set (3) SVS_Type SVS; //Symbol sequence type (4) SV_Type SV; //Symbol vector type (5) KB_Type KB; //Knowledge base type 5.3. Annotation of related operation function: bool CreatKB(); //Create knowledge base bool LoadKB(KB_Type); //Load the knowledge base bool StoreKB(SV_Type); //Update the knowledge base Bitmap ReadSV(); //Input a sample to be recognized LSS_Type GetLSS(Bitmap); //Split the line segment LCS_Type GetLCS(LS_Type); //Generate the feature points set of line segment BFV_Type GetBFV(LCS_Type); //Obtain best fitting vectors according to feature points set fitting polynomial bool AnalysisSV(SV_Type); //Analyze a symbol vector SK_Type MatchingSK(BFV_Type); //Match the stroke by best symbol vector SVS_Type MatchingTP(SV_Type); //Match the templates by symbol vector SVS_Type MatchingSKV(SV_Type.SKV); //Process match according to stroke vector of symbol vector SVS_Type MatchingPIC(SV_Type.Pic, SVS_Type); //Process match according to graphics of symbol 5.4. Implementation process: S1. KB = CreatKB() or LoadKB(KB); //Create knowledge base or load knowledge base S2. SV.Pic = ReadSV(); S3. AnalysisSV (SV) //Sample analysis Begin LSS = GetLSS(SV.Pic); //Split the graphics into stroke set For i: = 1 To LSS.size() Do Begin //Generate feature points set LCS = GetLCS(LSS[i]); //Generate best fitting vector input symbol vector SV.SKV[i].BFV.add(GetBFV(LCS)); //Write symbol vector by fitting vector matching stroke SV.SKV[i] = MatchingSK(SV.SKV[i].BFV);
- 10. End return SUCCESS; End S4. SVS = MatchingTP(SV); //Match the template, SVS[1] is the most probable recognition result Begin //According to vector fitting, several symbol vectors can be obtained SVS = MatchingSV(SV.SKV); //If necessary, compare the sample graphics, and match it with every possible symbol //graphics SVS = MatchingPIC(SV.Pic); If(user need to update knowledge base) Then StoreKB(SV); return SVS; End S5. Write(SVS[0]); //Output the best fitting result 6 Algorithm Analysis Above algorithm has been carried out on PC, and some changes can be made on the parameters to adapt to certain circumstances according to actual situations and implementation efficiency is easy to control. Because the matching process bases on the sequence, efficiency can be highly improved by adding index and so on. It also has wide range of application. Whether handwriting or printing, as long as the proper parameters and treatments are set according to actual situation, it can be adapted to certain circumstances. Algorithm can be improved. For instance, it can be enabled to deal with non-positive input symbols. Chinese character is a good example. It is non-positive input, and a little bit tilt, and if we match it directly with knowledge base will probable get a wrong result. We can rotate the coordinate of fitting function polynomial, and by the function way, try to recognize after rotate certain angle. If matching rate is significantly increased, it is obvious that rotate is effective. Further, this algorithm can handle many specific symbols, not only numbers, letters, characters and so on. We can see from Figure 3.
- 11. (Figure 3. Online recognition of handwriting staff of the low note) (Upper left: handwriting sample,Upper right: feature points acquisition lower left: eliminate buffeting,lower right: line segment split) 7 Conclusion This paper presents a graphic recognition algorithm bases on fitting functions. And its effectiveness has been verified by the recognition of handwriting musical symbol. Through fitting the graphic by several polynomials, and compare it with samples in template library. And after analysis, the templates with highest similarity will be extracted as recognition result. According to the recognition way in this paper, it requires the input symbol should be in standard direction. For non-positive input symbols and symbols which vectors’ differences are not very apparent, the result is not very accurate. Thus, this system need further improvement, and make it more pratical. References: [1] Campbell C.Algorithmic approaches to training support vector machines:A survey[A].Proc ESANN’2000[C].Belgium:D-Facto Publications,2000.27-36. [2] Li Ping,Farkas I,Whinney B M.Early Lexical Development in a Self-organizing Neural Network[J].Neural Networks,2004,17(8/9):1345-1362. [3] Lin Zhiqing, Guo Jun. Bayesian classifier Handwritten Character Recognition Application [J]. Acta Electronica Sinica, 2002 [4] Shen Li, Zhang Chenxi. Method of Vectorizing the Monochrome Image [J]. Journal of Computer-Aided Design & Computer Graphics. 2000,12(3).-170-173