Cycle Management 7 20 2008
•
1 gefällt mir•376 views

How insurers can manage the underwriting cycle better

Empfohlen
Weitere ähnliche Inhalte
Was ist angesagt?
Was ist angesagt? (20)
Andere mochten auch
Ähnlich wie Cycle Management 7 20 2008
Ähnlich wie Cycle Management 7 20 2008 (20)
Cycle Management 7 20 2008
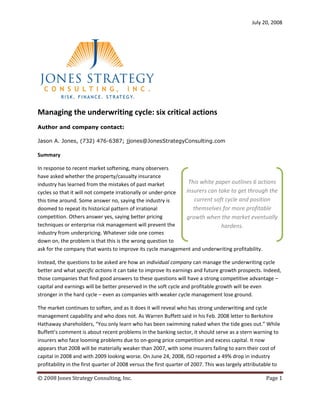
- 1. July 20, 2008 Managing the underwriting cycle: six critical actions Author and company contact: Jason A. Jones, (732) 476-6387; jjones@JonesStrategyConsulting.com Summary In response to recent market softening, many observers have asked whether the property/casualty insurance industry has learned from the mistakes of past market This white paper outlines 6 actions cycles so that it will not compete irrationally or under-price insurers can take to get through the this time around. Some answer no, saying the industry is current soft cycle and position doomed to repeat its historical pattern of irrational themselves for more profitable competition. Others answer yes, saying better pricing growth when the market eventually techniques or enterprise risk management will prevent the hardens. industry from underpricing. Whatever side one comes down on, the problem is that this is the wrong question to ask for the company that wants to improve its cycle management and underwriting profitability. Instead, the questions to be asked are how an individual company can manage the underwriting cycle better and what specific actions it can take to improve its earnings and future growth prospects. Indeed, those companies that find good answers to these questions will have a strong competitive advantage – capital and earnings will be better preserved in the soft cycle and profitable growth will be even stronger in the hard cycle – even as companies with weaker cycle management lose ground. The market continues to soften, and as it does it will reveal who has strong underwriting and cycle management capability and who does not. As Warren Buffett said in his Feb. 2008 letter to Berkshire Hathaway shareholders, “You only learn who has been swimming naked when the tide goes out.” While Buffett’s comment is about recent problems in the banking sector, it should serve as a stern warning to insurers who face looming problems due to on-going price competition and excess capital. It now appears that 2008 will be materially weaker than 2007, with some insurers failing to earn their cost of capital in 2008 and with 2009 looking worse. On June 24, 2008, ISO reported a 49% drop in industry profitability in the first quarter of 2008 versus the first quarter of 2007. This was largely attributable to © 2008 Jones Strategy Consulting, Inc. Page 1
- 2. Managing the Underwriting Cycle: Six Critical Actions declining underwriting profits and an “absolutely unprecedented” decline in overall written premiums for four successive quarters. Rate trend statistics from MarketScout’s June 2008 Market Barometer report show rate declines in every month since January 2005, with the annual rate of decline consistently in double digits since February 2007. These statistics reinforce the bleak picture for 2009. This white paper outlines 6 actions insurers can take to get through the current soft cycle and position themselves for more profitable growth when the market eventually hardens. While the timing of the next hard market is uncertain, now is the time to begin preparing. Those who don’t prepare will find the next few years painful indeed, while those who do prepare will stand out from the crowd and emerge stronger. Action 1: Improve your metrics The best metrics are essential tools to outperform the competition, and improving your profitability metrics can have a huge effect on how profitable a line of business appears. When the wrong metrics are used, it is possible that lines assumed to be very profitable are actually unprofitable and vice-versa. Getting the answers from the best metrics will help you focus growth on the most profitable opportunities and take corrective actions where profitability is weak. In order to develop the best metrics, a company can correct for some common weaknesses in 4 ways: • Recognize the reserving cycle. • Use underwriting or accident year data. • Recognize the time value of money. • Account for required capital. We will review these 4 ways to improve the measurement of underwriting profitability and discuss how to implement these improvements through adjustments to current metrics. Recognize the reserving cycle In a perfect world, losses would be exactly known and reserves could be set with certainty. In a slightly less perfect world, uncertainty would remain as to the amount of loss, but at least the estimate of loss would be reasonably accurate and there would be no bias toward under- or over-estimating loss. Unfortunately, these conditions are not true in the real world. There is an industry-wide pattern of over- reserving in hard markets and under-reserving in soft markets. Based on statistics from A.M. Best, it can be seen that reserves for accident years in the soft part of the cycle have consistently developed adversely, while accident years during the hard part of the cycle have consistently developed favorably. Prior loss experience, and hence reserves, are by far the most important data used in pricing business and monitoring loss cost inflation, so any bias in these figures will result in erroneous pricing. It can become an unseen vicious cycle where past reserving practices inadvertently hide the magnitude of change in loss cost inflation and cause estimated loss to diverge further and further away from actual loss until years later when under-reserving becomes obvious and a reserve increase must be taken. © 2008 Jones Strategy Consulting, Inc. Page 2
- 3. Managing the Underwriting Cycle: Six Critical Actions Accounting for the reserving cycle is a key step to breaking this vicious cycle and getting a better grasp on loss cost and exposure trends. In addition, as long as past data shows predictable periods of over- or under-reserving, suitable adjustments need to be made to avoid future pricing mistakes. In Table 1, below, we illustrate how an adjustment can be made to reflect past patterns of over or under-reserving to obtain a better measure of current profitability and to reduce the likelihood and magnitude of future miscalculation. Use underwriting or accident year data It is widely understood that calendar year results can be very misleading – to the point of indicating strong profitability when a company’s current activities are actively destroying value, or vice versa. It seems surprising how commonly people still rely on calendar year results as a gauge of profitability. One of the reasons is that calendar year results are reported in GAAP and statutory financials, so the figures are easily accessible. Fortunately, better metrics are available to management through better data collection, analysis and reporting. I recommend analyzing historical underwriting results and volatility by looking at accident year (or underwriting year) loss ratios as of the most recent evaluation date. Over the long term, this does not change how profitable a business appears, but it can dramatically change the view on when the profits are earned and how volatile the earnings are. It can also change the view on pricing and underwriting trends and give management advance warning of loss cost changes that get hidden in calendar year data. The following example illustrates how significant the difference between calendar year and accident year can be. I make two adjustments. The first removes prior year reserve development from the calendar year loss ratio in order to obtain the initial reported accident year loss ratio. The second adjustment recognizes that the accident year loss ratio has been re-estimated over time. While excluded from the example, a third adjustment can also be made to correct any bias that might exist within the accident year estimates based on an assessment of historical patterns of over- or under-reserving. Combining these adjustments provides a much more accurate picture of current profitability and shows a more accurate pricing trend for estimating next year. (Note: additional adjustments to reflect required capital and investment income are described later in this paper.) Table 1: U.S. Industry Aggregate – All Lines Combined 1997 1998 1999 2000 2001 2002 2003 2004 2005 2006 Calendar year 73.1 76.4 78.7 81.2 88.4 81.6 75.1 72.9 74.8 65.4 loss ratio Prior year (3.8) (3.3) (1.0) 0.1 3.4 6.5 4.2 3.1 1.1 (1.6) development(-) Subsequent (0.1) 4.0 6.4 7.1 3.2 0.3 (4.0) (4.7) (2.5) - development(+) Accident year 76.8 83.7 86.1 88.2 88.2 75.4 66.9 65.1 71.2 67.0 loss ratio Source: A.M. Best, Best’s Aggregates & Averages, 2007 P/C Edition © 2008 Jones Strategy Consulting, Inc. Page 3
- 4. Managing the Underwriting Cycle: Six Critical Actions Recognize the time value of money Casualty lines are often profitable at higher combined ratios than property lines. This is because casualty claims can take many years to be paid and the insurer gets the benefit of higher investment income while it holds the assets that will be used to support the risk and eventually pay claims. Thus, comparing combined ratios from one line of business to another is not useful in assessing relative profitability. For the sake of comparing results, planning, and providing incentive compensation, it is necessary to have a true apples-to-apples metric. By recalculating the combined ratio by taking present value of losses in the numerator (rather than nominal value), a more accurate comparison can be made. A note of caution is in order. If the discount rate were improperly set equal to the investment portfolio yield, there would be a perverse incentive to invest for higher yield to make the present value of underwriting results look better. This would be a recipe for disaster, and this kind of thinking has been used to justify “cash flow underwriting,” or managing the business for current cash flow without sufficient regard for underwriting or investment risk or long-term economic value. The upshot is that the discount rate must be chosen appropriately and that imprudent concepts such as cash flow underwriting should be avoided. Account for required capital Capital is needed to absorb unexpected losses if they should occur and to satisfy the requirements of regulators and rating agencies. The riskier the business written, the more capital it will require. For most property/casualty lines, the 3 biggest sources of risk are reserve risk (potential adverse development on loss reserves), pricing risk (potential underwriting losses on current business) and catastrophe risk (e.g., earthquake and hurricane losses). Since these risks vary widely from one line of business to another, the required capital will vary widely. The impact of capital on profitability can be easily seen. If capital requirements are doubled but profitability remains the same, the return-on-equity (ROE) is cut in half. Elsewhere in this paper, we discuss capital allocation and allocating capital to each line of business. When capital is allocated based on risk, a very different profitability story emerges versus what is apparent from looking at combined ratios only. Because many managers and underwriters are accustomed to monitoring and managing underwriting activities based on the loss ratio or combined ratio, it can be useful to determine the correct profitability hurdle rates based on capital requirements and then translate these back into familiar combined ratio terms. For example, if the company’s hurdle rate is a 12% ROE, that might translate into a combined ratio of 105% for one line and 90% for another. These hurdle combined ratios can be re-calculated periodically by actuarial staff and used to set target combined ratios used in business planning and incentive compensation arrangements. © 2008 Jones Strategy Consulting, Inc. Page 4
- 5. Managing the Underwriting Cycle: Six Critical Actions Finally, by making all 4 of the corrections to profitability metrics cited above, a company will have earnings metrics that reflect capital requirements, different risk profiles, investment income, and measure profitability consistently across lines of business and across time. While hard work must go into building the right metrics, the pay-off is significant and long-lasting. Because the right metrics are forward looking, management can act faster and with more confidence to steer future business. They are truly comparable across lines of business, so they can be used to determine which lines are doing better than others and to determine incentive compensation. They don’t obscure the economic profitability and provide a clear picture to management, so truly unprofitable lines can be fixed or exited and truly profitable ones can be grown. Action 2: Control terms and conditions One of the biggest reasons insurers underestimate how much the market is softening is that they broaden terms and conditions without realizing how much they are doing this and without pricing for it. When the market first softens and is still near the peak of pricing, this is like taking the forbidden fruit from the serpent. It seems harmless enough (there is plenty of cushion to absorb a point or two on the loss ratio) and tasty (it’s still very profitable.) However, as the market continues to soften over time and terms and conditions are whittled away, a dangerous point can be reached where underwriting seems to remain profitable but has actually become very unprofitable. Since the problem remains unrecognized, the company continues to write the business long after it has become unprofitable. The error shows up later and results in big reserve increases. Some of the key practices that can prevent this problem are the following: • Price all changes in terms and conditions. While obtaining data in order to price terms and conditions can be difficult, it is essential to do this and price these changes as accurately as possible. To support the better pricing, you will typically need better data collection and underwriting controls to know how terms and conditions are actually changing. • Clearly specify how much authority each underwriter has. This bit of common sense can fail in the implementation. Well-designed periodic reviews of underwriting authorities and policies are valuable undertakings that can identify the need for change in response to the cycle. The rationale for underwriting discretions should also be reviewed and a balance between responsiveness to a competitive market and managing risk should be achieved. • Monitor and audit underwriting, claims and actuarial functions. Underwriting rules and authorities are established, but are they adhered to? Are they communicated and well understood? You need to make underwriting audits to answer these questions and to check that underwriters don’t give away gratuitous coverage. It is not just underwriting practices that have to be monitored – claims adjusters must also understand the variations in terms and conditions and reflect them in reserve setting and claims adjustment, and actuaries must adjust for these changes in the claim development triangles. • Measure the risk: It is not enough to know the expected loss cost from a coverage extension. Risk is about real-world volatility around this value, and you need to be ready for the unexpected. Look at probable maximum losses, standard deviations or other risk metrics. Avoid © 2008 Jones Strategy Consulting, Inc. Page 5
- 6. Managing the Underwriting Cycle: Six Critical Actions terms and conditions where the added risk is too high, or at least charge a high price for it. Extending coverage for terrorism or natural catastrophes when these were formerly excluded are perfect examples of high risk coverage extensions. Lower risk approaches would impose sub- limits, allow only minor coverage extensions, or would extend coverage only when the loss experience is well known and exhibits low volatility. Action 3: Be careful of new business New business is often less profitable than renewal, sometimes by a wide margin. Of course, that doesn’t mean you should give up on new business. Far from it – every policy in your book of business was new at one time, and new business is essential for long-term growth. The point is to manage the risk and take on the right new business at the right time. The first thing to understand about new business is that it can be underpriced very easily. You know the loss experience of your renewal book of business better than that of new business. There is an informational asymmetry in which you know less about the risk characteristics and proper classification of a new piece of business relative to what the prospective policyholder knows. In addition, new business is being shopped around and will typically land with the low cost carrier. This kind of informational asymmetry and underwriting incentives that inadvertently emphasize growth over profitability are two of the main culprits for the under-performance of new business. I recommend taking more aggressive action on new business than you would for renewal – putting stricter limits on growth of new business as the cycle softens, investing more effort to make sure new business is properly classified before it is written, and using more restrictive terms and conditions to mitigate losses. Actions geared toward making underwriters more accountable for profitability and gaining as much underwriting information as possible can protect a company from significant underwriting losses. In addition, finer detail in data analysis to identify the most attractive and unattractive market sub-segments can help focus marketing activities toward the best new business, and more importantly in a soft market – away from unattractive business. While the primary need in the current environment is to closely monitor and control the growth of new business, don’t forget that new business will be a tremendous opportunity when the market hardens. In a hard market, there may be plenty of business at very attractive prices, and aggressive and opportunistic growth can be extremely profitable. However, at this point in the soft market, improving the granularity and quality of your data and segmenting your business in more precise ways is an important investment that can pay off handsomely. Action 4: Allocate capital When capital is allocated based on risk, a very different profitability In this section, we turn to the portfolio aspects of underwriting, where the important issues differ from story emerges versus what is those at the individual policy level. For the individual apparent from looking at combined policy, the key questions are the following: Is it ratios only. profitable? Is the level of risk acceptable? At the portfolio © 2008 Jones Strategy Consulting, Inc. Page 6
- 7. Managing the Underwriting Cycle: Six Critical Actions level, you must also ask: How do I choose among all the opportunities, and how much business do I plan to write in each line? Capital allocation is a powerful way to help answer these questions. For our purposes, capital allocation is a planning tool that recognizes a company has a finite amount of capital and that only so much premium can be written against that capital. Writing more in line A means you must write less in line B. It’s akin to a budget that puts discipline into the planning process. Capital allocation can also imply the building of a full-blown economic capital model: quantifying all risks a firm faces within a common framework and quantifying diversification benefits. If you have this tool, it applies here, but if not, the process of capital allocation remains valid and useful. We will not get into the technical details of capital allocation models here. It will suffice to cite some general principles that can be applied to any insurer’s situation: • Determine how much capital is needed to support each unit of premium by line. • Measure profitability of each line based on its return on capital. • Profitability is more important than diversification. Diversification is valuable, but always strive to write business that is economically profitable on a stand-alone basis. • Have each business unit compete for capital based on its risk-adjusted profitability as part of the regular planning and budgeting process. Action 5: Build a foundation of accountability Accountability across all business units and all levels of the organization is a proper foundation for cycle management. Without accountability, all other actions are weakened and typically become ineffective. Accountability for disciplined underwriting and smart decision-making can be grounded in three steps of equal importance: • Know-how: Know what the company is good at, how much risk it’s willing to take, and how it is performing in real-time. Invest in top quality data and analysis to address these points. • Communication: People can’t use information unless they know it and understand it. Getting the know-how out to every employee and explaining how it’s relevant to them and to the company is a critical step. Management and the board need top-notch earnings and risk reports. • Incentives: When people see how the behaviors that benefit the company are aligned with their own higher compensation, better job security, opportunities for advancement and training, they will be highly motivated to do the right thing, and they will be the ones who ultimately drive a company’s success. These principles apply for all departments and at all levels. Some questions to consider when setting incentives are the following: Is each person’s incentive aligned with activities he or she controls or influences? Do incentives reward risk mitigation as well as profitable growth? Are incentives long-term and do they encourage the right actions through all points in the underwriting cycle? © 2008 Jones Strategy Consulting, Inc. Page 7
- 8. Managing the Underwriting Cycle: Six Critical Actions Action 6: Act quickly and aggressively As indicated elsewhere in this article, traditional underwriting metrics are lagging indicators influenced more by past underwriting actions rather than future prospects. They also tend to underestimate how good things are in a hard market and how bad they are in a soft market. As a result, companies that use forward-looking metrics will be at a decided advantage when it comes to reacting to market changes. Armed with the proper metrics, a company can substantially outperform the industry. It’s more than simply gaining a small advantage on the combined ratio and letting the benefits compound over time, though this in itself is enough to justify the investment in cycle management. Rather, it is the ability to act quickly and aggressively through earlier and stronger growth in hardening markets and cut back in softening markets before competitors understand how far the market has turned. This ability allows a company to magnify its advantage to obtain stronger growth over the cycle, gain market share, and enjoy superior profitability. To illustrate the point, if a company improves its combined ratio by 1 point but changes nothing else, it will improve its ROE by roughly 1%. This is very good, but even more can be achieved by acting quickly and aggressively at key points in the cycle. Now suppose the company acts defensively in the soft cycle by initially reducing market share by 10% and growing more aggressively in the hard market. My estimates show that the company can increase its market share by 13% over the course of the entire cycle and increase its underwriting earnings over the whole cycle by 28%. There are many pressures to show short-term growth each quarter, but this analysis shows that companies should resist these pressures so they can obtain superior long-term profitable growth. The short-term thinkers dig themselves into a hole, while the long-term thinkers build for a brighter future. Conclusion I have presented 6 ways a company can manage the underwriting cycle better and thereby obtain higher profits and higher market share over the long-term. The market continues to soften, even though it has already become economically unprofitable in some lines of business and geographies. It is uncertain when the market will harden again, but given the historical pattern of a roughly 10-year cycle and taking 2004 to be the peak of the hard cycle, the next market peak could be 2014, with the upswing starting before then, perhaps in 2011. The exact timing is uncertain, and the key lesson is that it is essential to be prepared for the hard cycle and to protect the company’s capital and earnings in the short-term. Given the on-going market softening, cycle management will likely be the single more important issue for the industry in the next 2 or 3 years. © 2008 Jones Strategy Consulting, Inc. Page 8
- 9. Managing the Underwriting Cycle: Six Critical Actions Jones Strategy Consulting, Inc is a consultancy focused on risk, finance and strategy, and management of these issues to enhance long-term growth and profitability. Serving insurance and reinsurance clients globally, Jones Strategy Consulting is based in the New York metropolitan area, and its website address is www.jonesstrategyconsulting.com. Jones Strategy Consulting, Inc provides this report for general information purposes only. The information contained herein is based on sources we believe reliable, but we do not guarantee its accuracy, and it should be understood to be general insurance information only. Moreover, this document is not intended to recommend any particular product or service over another generally. Jones Strategy Consulting, Inc makes no representations or warranties, express or implied. The information is not intended to be taken as advice with respect to any individual situation and cannot be relied upon as such. Readers are cautioned not to place undue reliance on any historical, current or forward-looking statements. Jones Strategy Consulting, Inc undertakes no obligation to update or revise publicly any historical, current or forward-looking statements, whether as a result of new information, research, future events or otherwise. Statements concerning, tax, accounting, legal or regulatory matters should be understood to be general observations based solely on our experience as consultants, and may not be relied upon as tax, accounting, legal or regulatory advice which we are not authorized to provide. All such matters should be reviewed with your own qualified advisors in these areas. This document or any portion of the information it contains may not be copied or reproduced in any form without the permission of Jones Strategy Consulting, Inc, except that clients of Jones Strategy Consulting, Inc need not obtain such permission when using this report for their internal purposes. The trademark and service marks contained herein are the property of their respective owners. © 2008 Jones Strategy Consulting, Inc. Page 9