International Journal of Business and Management Invention (IJBMI) is an international journal intended for professionals and researchers in all fields of Business and Management. IJBMI publishes research articles and reviews within the whole field Business and Management, new teaching methods, assessment, validation and the impact of new technologies and it will continue to provide information on the latest trends and developments in this ever-expanding subject. The publications of papers are selected through double peer reviewed to ensure originality, relevance, and readability. The articles published in our journal can be accessed online.
1. International Journal of Business and Management Invention
ISSN (Online): 2319 – 8028, ISSN (Print): 2319 – 801X
www.ijbmi.org Volume 3 Issue 7 ǁ July. 2014 ǁ PP.23-32
www.ijbmi.org 23 | Page
An Analysis of Technical Efficiency of Education Organizer
(A Case Study at Junior High School in Mataram City – West
Nusa Tenggara)
Hadi Mahmudi1
, Munawar Ismail2
, Candra Fajri Ananda3
, Moh. Khusaini4
1
Doctor Program of Economic Sciences, Economics and Business Faculty, Brawijaya University, Indonesia
2,3,4
Lecturer of Economics and Business Faculty, Brawijaya University, Indonesia.
ABSTRACT: This study aims are 1) to assess the technical efficiency level of management at Private and
Public Junior High School. 2) to examine input - output variables that cause the lack of technical efficiency of
management at Private and Public Junior High School. This study uses a quantitative approach with Data
Envelopment Analysis (DEA) analysis method. Data comes from budget period of 2009/2010 to 2011/2012 at
31 Junior High School in Mataram City. Research results showed that: In 2009/2010 all Junior High School in
Mataram achieve maximum efficiency scores. But in 2010/2011 – 2011/2012 efficiency scores was dropped,
because input increase was greater than output increase. Private Junior High School was more efficient than
Public Junior High School. Input variables with dominant contribution to lower maximum efficiency scores
respectively are: a) training cost, monitoring, supervision and reporting per student, b) households cost per
student, c) number of computers per student, d) people`s welfare per students, e) professional development costs
per student, f) amount of non-educational personnel per student. Output variable was average of academic
achievement.
KEYWORDS: Technical Efficiency, Junior High School, Data Envelopment Analysis (DEA).
I. INTRODUCTION
Education in economic perspective is human investment to create reliable human beings to become
subject to drive national economic development. This confirmed by study of World Bank (1993) that education
investment is core activity in human resources development. It had very significant contribution to level of
economic profit. Educational investment is higher than the average ratio of physical investment with comparison
of 15.1% and 9.1%. This means that investment in education is an effort to get benefits both socially and
economically.
Education budget allocations for education both nationally and regionally for 2005-2011 period was
increased 3-fold. The problem was how to make education development also increased proportionally to its
budget? Based on UNDP Human Development Index (HDI) 2005-2011, Indonesia is ranked at 108 of 169
countries in 2010, then in 2011 the ranking dropped dramatically to 124 of 187 countries listed. Based on data
released by United Nations Development Program (UNDP), HDI Indonesia is 0.617 and categorized as
"medium". Within ASEAN scope, Indonesia is ranked only at 6 of 10 countries. Global Monitoring Report
(GMR) in 2011 stated that about 1 in 21 of Indonesian adults is illiterate. Two-thirds of total illiterate people in
this country are dominated by women, (http://www.surabayapost.co.id).
UNDP measure a country's education ranking from length of school time. UNDP stated that average
length of school time in Indonesia is still low, i.e., in 2010 is 5.7 years and 2011 is 5.8 years. It means they not
graduate from elementary school. Highest education performance in ASEAN is achieved by Malaysian, with
average school time is Junior High School or above.
Mataram as province capital city should become an example for other areas in NTB. However, the fact
show that educational attainment indicator namely net enrollment ratio (NER) was at 3 level and Gross
Enrolment Ratio (GER) was at 6th
level from 10 districts/cities in NTB. Overall attainment indicators of
education quality at national and regional levels are still far behind the neighbor countries (ASEAN).
Pattinasarany and Blane (2008) stated this can happen because management of education providers are not
professional. The increase in budget/finance of education management has not been good.
Based on vision and mission of national education as stipulated in Ministry of National for strategic plan 2010-
2014, there are two goals namely efficient allocation and equity. Equity concept is different from efficiency
concept. Anyone who interested in equities also want to achieve equity objectives in an efficient manner at
2. Efficiency Analysis of Education Implementatio….
www.ijbmi.org 24 | Page
lowest cost. If injustice remediation can not be achieved with lowest cost, it would become a resources waste. It
can achieve a higher level if there is improvement in an efficient use of resources in pursuit of equity objectives.
Production function in education is a relationship between the inputs used in education that can be transformed
into educational output. Fattah (2009) stated there are several factors of educational inputs such as student
characteristics, environment and school factors. Gian and Gilberto (2001) defines the relationship between
inputs and outputs in production function are Output school = function (Cost, teacher, non-teacher,
facilities/technology, student background and environment).
Sabiran (2003) stated that inconsistency of Indonesia education quality is caused by different
operational funding allocation for each school. Bigger fund can make better education quality. Adversely, Geert
and Andrew (2007) show that in Arab Republic relatively large expenditure in education sector does not always
produce the most efficient outcomes. According Pattinasarany and Blane (2008), Indonesia Elementary School
is still inefficient. While Muzakar Isa, (2009) said that efficiency scores of Surakarta high schools is lower than
private school. Gian and Gilberto (2001) stated that for-profit private schools in Italy more efficient than public
schools, meaning the efficiency of school management does not depend on magnitude and size of school
budget.
Research on education provider efficiency has been done by experts around the world, as Marijn,
Victoria and Stephane (2007), Geert et al. (2007), Etibar and Anna (2008). Input variable of cost/student ratio is
calculated globally, not specified according to posts usage. Furthermore, research results only explain level of
efficiency achieved by each samples school, without providing solutions on how to improve the efficiency
scores for schools that have not reached the maximum efficiency score. Meanwhile Etibar and Anna (2008)
stated school success does not depend on budget allocation, one factors to increase school success is efficiency
level of management. Therefore, previous studies result on education provider efficiency is not able to provide a
more real benchmark to improve school success.
This study become first step to improve school performance that measured by school efficiency. Input variable
of cost/student ratio is calculated in detail according to their items usage. Schools that have not reached the
maximum efficiency score was given information of a potential improvement related to input and output
variables to become a reference to improve the efficient score. This is because education providers, especially
Junior high School in Mataram still not managed efficiently. Score efficiency can be used as school performance
information. High efficiency score means that school performance is high school. Adversely, low efficiency
score means lower school performance. In addition, potential improvement also can be used as consideration to
achieve better equity in school management. Furthermore, it is necessary to measure technical efficiency and the
cause of lack of efficiency in Private and Public Junior High School in Mataram city for 2009-2012.
Based on explanation above, this study has the following objectives:
1) Assessing the technical efficiency level of management at Public and Private Junior High School.
2) Assessing the input-output variables that lead technical inefficiency of management at Public and Private
Junior High School.
II. LITERATURE
2.1. Production function
Production function is a relationship between the amount of output produced and inputs needed to
produce output, with a certain degree of technical knowledge. Production function shows the total units of a
product as a function of input units. In other words, nature of production function shows the relationship
between the factors of production and level of production.
Coelli (2005) describes a Decision Making Units (DMUs) using a number of N inputs (e.g., labor, facilities and
infrastructure) to produce a single output. The possibility of such DMUs technology can be summarized by
following production function:
q = f (x)
Where q represents output and x = (xl, x2, ..., xN)' is vector of input N x 1. The inputs should taken
into account in decision-making, while some other inputs outside the model (e.g., environmental) also
important, but usually it is better to put in general structure of function f (.).
Production function in education is a relationship between resources used in education that can be transformed
into educational output. Generally, education output is a function of a number input. Gian and Gilberto (2001)
abstractly defines the relationship between inputs and outputs in production function as follows: Output school
= function (cost, teacher, non-teacher personnel, facilities/technology, background students, and environment).
School cost or expenditure according to Fattah (2009) for operational needs is outlined as follows: 1)
3. Efficiency Analysis of Education Implementatio….
www.ijbmi.org 25 | Page
Salary/Employees welfare, 2) Improvement of teaching and learning activities, 3) Maintenance/replacement of
facilities and infrastructure, 4) Increased development of student activities, 5) Improved professional skills of
teachers, 6) Administration, 7) Monitoring/supervision/guidance.
2.2 Efficiency
2.2.1 Efficiency Type
Worthington (2001) and Nicholson (2003) stated there are three terms of efficiency based on economic
theory, namely technical efficiency, price efficiency and economic efficiency (allocative or price efficiency).
Samsubar (2000) states that economic efficiency consists of technical efficiency and allocative efficiency.
Technical efficiency is a combination of capacity and ability to produce economic units to a maximum output
level of number of inputs and technology. Allocation efficiency is the ability and willingness of economic units
to operate at level of marginal product equals with marginal cost (MP = MC).
2.2.2. Efficiency Based on Input Orientation
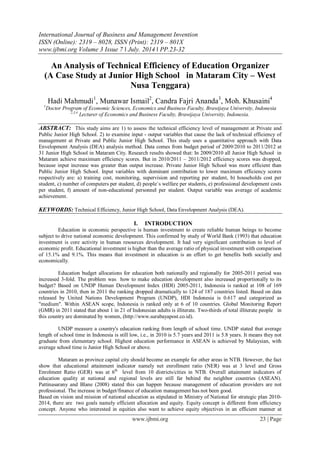
Coelli (2005) illustrates his ideas with simple example involving some DMUs using two inputs (x1 and
x2) to produce a single output (q) under the assumption of constant returns to scale. Some DMUs Isoquant really
efficient, it is represented by SS' in graph 2.1 to facilitates the measurement of technical efficiency. If certain
DMUs using input quantity, defined by point P, to produce a unit of output, the technical inefficiency of DMUs
that can be represented by a QP, which is sum of all inputs can be proportionally reduced without reduce output.
It is usually expressed in percentage by ratio QP/0P, which represent the percentage of all inputs that need to be
reduced to achieve technical efficient production.
Technical efficiency (TE) of DMUs is usually measured by following ratio:
TE = 0Q/0P
This equation will same as the equation 1 - QP/0P, where the values range between zero and one, and because it
produces an indicator degree of company technical efficiency. Value 1 implies that company has achieved full
efficient conditions. Graph 2.1 describes x1 = first input, x2= second input, q = output. If ratio of input prices
(represented by line AA') is also known, then the point is efficient allocative production can also be calculated.
For example, the point Q has achieved technical efficiency because it is above efficient isoquant curve.
Size of technical efficiency with input-oriented of DMUs can be expressed in a input functions (x, q) as
follows: Coelli (2005: 53):
TE = 1/(x, q)
DMUs technically efficient if it also lies at the limit, as far as TE = 1 and (x, q) = 1.
Input price information can be used to measure cost efficiency of DMUs. Suppose w represents the vector of
input prices and x represents the vector of observable inputs in relation to point P. Suppose x ^ and x *
represents the input vector associated with point Q for technical efficient and cost minimization input vector in
Q'. Cost efficiency is defined as ratio of DMUs input costs related to input vector, x and x *, which is related to
points P and Q'. Therefore,
Graph 2.1: Allocative and Technical Efficiency (Coelli (2005).
x2/q
Q’
A
Q
P
R
S
S’
A’
x1/q0
4. Efficiency Analysis of Education Implementatio….
www.ijbmi.org 26 | Page
If input price ratio, represented by slope of isocost line, AA' in graph 2.3, then these allocative
efficiency and technical efficiency measurement can be calculated using the isocost line. It is presented by
Coelli (2005) as follows:
This equation shows that distance RQ represents the reduction in production costs that would occur if
production occurs at point Q' (efficient allocative), but point Q which is inefficient allocative. Given technical
efficiency measurement, total cost efficiency (CE) can be expressed as a product of technical and allocative
efficiency measurement with follows formulation (Coelli (2005):
TExAE = (0Q/0P)x(0R/0Q) = (0R/0P) = CE
All measurement of this efficiency is limited by zero and one. Graphic illustration on efficiency measures uses
constant returns to scale. The use of constant returns to scale and two input variables can be described by two
dimensions graph.
2.2.3 Efficiency Based on Orientation-Output
Illustration of output orientation measurements involve production with two output (q1 and q2) and
single input (x). When considering the CRS, the technology can represent production curve in two dimensions.
This example is illustrated in graph 2.2 where the curve ZZ’ is a production possibility curve and point A in
accordance with inefficient DMUs. Note that inefficient DMUs operating at point A is located at bottom of
curve, because ZZ’ represents a bond for possible production.
Output efficiency orientation measures are defined as follows. Graph 2.2 AB represents technical inefficiency.
Output can be increased without requiring extra inputs. Therefore, a measure of technical efficiency output-
oriented is ratio of:
TE = 0A/0B = do (x, q)
Where do (x, q) is a output function on input of vector x and output of vector q. Income efficiency can
be defined for output price of vector p and represented by line DD’ . If q, q ^ and q * represents output vector of
observed DMUs, which is related to point A, which is an efficient vector production-related technical with
efficient vector of point B and revenue associated with point B’ , then the revenue efficiency is defined as
follows :
If no information about the price, it will be able to draw the line DD’ , and defining measures of allocative and
technical efficiency as follow:
This efficiency technique has the interpretation of revenues increase (equal with cost reduction of allocative
inefficiency in input oriented case). In addition, Coelli (2005) defines overall efficiency of revenue as product of
two sizes.
RE = (0A/0C) = 0A/0B) x (0B/0C) = TE x AE
These three sizes are constrained by zero and one. Size of technical efficiency output-oriented is equal to output
function.
2.3. Efficiency and Equity
Vision and mission of national education and Ministry of National Education 2010-2014 are To
expand and equalize access to education and gender equality at all levels in all provinces, districts, and cities;
Realizing governance, management control systems, and internal control systems that modern, effective, and
efficient. This vision and mission cover two goals namely allocation and equalization efficiency.
It should be stressed that anyone interested who equities also want to achieve equity objectives in an efficient
manner, namely lowest cost. If injustice improvement can not be achieved with lowest possible cost, it would
become a waste of resources. It can achieve a higher level if there is no improvement in an efficient usage of
resources in pursuit of equity objectives.
5. Efficiency Analysis of Education Implementatio….
www.ijbmi.org 27 | Page
III. CONCEPTUAL RESEARCH FRAMEWORK
3.1. Conceptual Framework
Input-output process is needed to determine how the inputs affect outputs. It needs to know the form of
production function of education. Gian and Gilberto (2001) defines relationship between inputs and outputs in
production function as follows: School output = function (cost, teacher, non-teacher personnel,
facilities/technology, student background, and environment). Furthermore Fattah (2009) also uses variable input
costs that specified in accordance with designation of format RAPBS.
Table 3.1. Basic Theory of Previous Research
Input-Output Variable
Basic Theories of Previous Research
Input
Cost/Student ratio is explained as follows : Rajiv D Banker, et al. (2000), Gian and Gilberto (2001),
Marijn, Victoria and Stephane (2007), Geert et.al
(2007), Etibar and Anna (2008), Pattinasarany and
Blane (2008).
1) Cost/Student Ratio Fattah (2009), Format RAPBS SLTP
2) Welfare/Student Ratio Fattah (2009), Format RAPBS SLTP
3) Ratio the cost to increase learning
process/student Ratio
Fattah (2009), Format RAPBS SLTP
4) Ratio the profession coaching cost/student Fattah (2009), Format RAPBS SLTP
5) Cost of maintenance and replacement of
facilities and infrastructure/student
Fattah (2009), Format RAPBS SLTP
6) Ratio of increase in extracurricular
guidance cost/student
Fattah (2009), Format RAPBS SLTP
7) Ratio of household school costs /student Fattah (2009), Format RAPBS SLTP
8) Ratio of monitoring, supervision and
reporting/student
Fattah (2009), Format RAPBS SLTP
9) Ratio of teacher/student Pattinasarany and Blane (2008), Marijn, Victoria and
Stephane (2007), Geert et.al (2007), Etibar and Anna
(2008)
10) Ratio of classroom/student Pattinasarany and Blane (2008)
11) Ratio of non-education/student Gian Paolo Barbeta and Gilberto Turati (2001), Rajiv D
Banker, et al. (2000)
12) Ratio of computer/student Etibar and Anna (2008)
Output
13) Ratio of graduation/student Marijn and Stephane (2007)
14) Ratio of academic achievement/student Marijn, et al.(2007), Geert, et al. (2007)
Etibar and Anna (2008)
15) Ratio not drop out /student Pattinasarany and Blane (2008)
Source: Author, 2013
Concept above underline this research to measure technical efficiency to improve productivity
performance evaluation of education providers to carry process of education. Based on description above, the
research model can be made as follows:
Graph 3.1: Research Model
6. Efficiency Analysis of Education Implementatio….
www.ijbmi.org 28 | Page
IV. METHODS
This study uses a positivist approach to explain how school expenditure can minimize input costs per
student and infrastructure per student to maximize output. Variables consists of two main variables, namely
input and output variables. Input variables consist of: 1) Ratio of salary/student, 2) Ratio Welfare/students, 3)
Ratio of cost increase in learning activity /student, 4) Ratio of cost of maintenance and replacement of facilities
and infrastructure/student, 5) Ratio of cost to increase extracurricular coaching/student, 6) ratio of household
school costs /student, 7) ratio the cost of training, monitoring, supervision and reporting/student, 8) ratio of
teacher/student, 9) Ratio classroom/student, 10) ratio of administrative staff/student, 11 ) ratio computer/student.
Output variables consist of: 1) Ratio graduation/student, 2) Ratio of total report weight /student, 3) ratio not
drop out /student.
This research object is all Junior high school under Dikpora coaching in Mataram city. It comprises 23
Public Junior High School and 8 Private Junior High School, total of 31 junior high school. Data was collected
by census method. The collected data was analyzed by Envelopment Analysis (DEA).
There are several approaches to measurement of efficiency in DEA, namely by maximizing output and
minimizing input (Ramanathan, 2009). In addition, measurement efficiency of a decision making units (DMUs)
is also used to determine benchmarking toward observed units (Bogetoft and Otto, 2011). Furthermore, DEA is
used to analyze annual data from 2009/2010 to 2011/2012 at Junior High School in Mataram as the study site.
V. RESULTS AND DISCUSSION
5.1. Efficiency Level Measurement at Junior High School in Mataram
Average efficiency score for period 2009/2010 to 2011/2012 at Public and Private Junior High School
in Mataram are follows. Year 2009/2010 show average of efficiency scores are 100% for Public and Private
Junior High School. 2010/2011 year average efficiency score of 99.09% Junior High School and the average
efficiency score of 99.73% Private Junior High School. In 2011/2012 average efficiency score of 98.19% Junior
High School and the average efficiency score of 100% Private Junior High School. Year 2011/2012 show
average of efficiency scores are 99.09% for Public Junior High School . It is smaller than Private Year
2009/2010 show average of efficiency score (99.91%). These results are in line with opinion of Gian and
Gilberto (2001) that private schools more efficient than public schools.
Adversely, Maria-Jesus Mancebon-Torrubia, at.al, (2010), revealed that public secondary schools in Spain is
more efficient than private schools. This conclusion is consistent with study conducted by Braun, Jenkins &
Grigg (2006); Lubienski & Lubienski (2006); Barbetta & Turati, 2003), where private school proved less
efficient compared to public school.
This difference due to more demand by public, so that new admissions process requirements are more
stringent for public school compared to private schools. As a result, public schools get new students with better
socioeconomic factors than private school. Conducive family background also become a significant factor for
development of student achievement.
These opinion was consistent with Braun, H., Jenkins, F., & Grigg, W. (2006); Lubienski, S.T., & Lubienski, C.
(2006); Barbetta, G.P., and Turati, G. (2003); Calero, J., & Escardíbul, J.O. (2007); Lubienski, C., Weitzel, P.,
& Lubienski, S.T. (2009) that factors of social group differences in school performance has no significant effect
on education. Differences in school performance is more closely related to external factors, namely student
school background.
Input and output conditions change for each year affect on level of efficiency score. Four Junior High
School of 4, 2, 11 and Dwi Jendra has a score of less than 100 percent, causing average efficiency become
99.50%. This indicates that there is still less optimal for usage and allocation of inputs to produce outputs that
have been performed by Junior High School in Mataram City. These results are in accordance with
Pattinasarany and Blane (2008) that achieve good performance, management of educational institutions must be
professional.
5.2. Effort in Improving Efficiency Scores
To determine school efficiency level, it conducted a maximum efficiency result measurement and
calculating where variables that contribute dominant value on efficiency. It is necessary to see contribution of
input variables on output variables at each school/DMUs. Therefore, it needs to see the value of "slack potential
improvement" at maximum efficient reference set. Comparison of less efficient school can be done by
benchmarking to school with 100 percent efficiency, as shown in Table 5.1.
Table 5.1 shows that at year 2010/2011 there are 3 junior with efficiency score below 100% efficiency (i.e.
Junior High School 2, 19 and Dwi Jendra). To get maximum efficiency, Junior High School 2 can benchmark
to Junior High School of 1, 6, 7 and 13. Furthermore, Junior High School 19 can benchmark to Junior High
7. Efficiency Analysis of Education Implementatio….
www.ijbmi.org 29 | Page
School of 1, 3, 7, 12, 13, 15 and Darul Hikmah. Junior High School of Dwi Jendra can benchmark to Junior
High School 3, 12, Darul Hikmah and Darul Falah.
Table 5.1. Efficient Reference Set of Junior High School in Mataram
Period 2010/2011 - 2011/2012
Inefficient School
Efficient Reference
2010/2011 2011/2012
Junior High School 2
Junior High School 1, 6, 7,
13
Junior High School 1, 6
Junior High School 11 -
Junior High School 1, 7,
12, 13,
16 and Salfiah Darul Falah
Junior High School 19
Junior High School 1, 3,
7, 12,
13, 15, and Darul Hikmah
Junior High School 1, 7,
13, Darul Hikmah
Junior High School Dwi
Jendra
Junior High School 3, 12,
Darul Falah, and Darul
Hikmah
-
Source: Secondary data processed (2010/2011 to 2011/2012)
In 2011/2012, Junior High School 2 can benchmark to Junior High School 1 and 6 to get maximum
efficiency 6. Furthermore, Junior High School 11 in can benchmark on Junior High School 1, 7, 12, 13 , 16 and
Salafiah Darul Falah. Junior High School 19 can benchmark to Junior High School 1, 7, 13, and Darul Hikmah
to get maximum efficiency.
5.3. Total Potential Improvement
DEA method assumes that not all entities are in a state of maximum efficient. DEA method can
measure input-oriented efficiency. Measurement be done to several input variables used by school as a factor of
production to produce output. It can be used as a reference strategy to reduce input to improve school
performance, as measured from maximum efficiency score (100 per cent).
Table 5.2. "Total Potential Improvement" Junior High School 2, 19 and Dwi Jendra
in Mataram Year 2010/2011
No Input
Total Potential
Improvement
1 Ratio of computer/student -12,05%
2 Ratio of household school costs /student -11,12%
3 Ratio of non-education/student -10,86%
4
Cost of maintenance and replacement of facilities and
infrastructure/student -9,24%
5 Welfare/Student Ratio -8,33%
6 Ratio the cost to increase learning process/student Ratio -8,3%
7 Ratio of monitoring, supervision and reporting/student -7,7%
8 Ratio of increase in extracurricular guidance cost/student -7,6%
9 Ratio the profession coaching cost/student -7,11%
10 Ratio of Wage/Student -6,81%
11 Ratio of classroom/student -5,38%
12 Ratio of teacher/student -5,05%
output
13 Ratio of graduation/student 0,44%
14 Ratio of academic achievement/student 0%
15 Ratio not drop out /student 0%
Source: Secondary data processed (2010/2011)
8. Efficiency Analysis of Education Implementatio….
www.ijbmi.org 30 | Page
Efficiency measurement results from DEA obtains total " potential improvement" for all Junior High
School that not reached maximum of efficiency. Table 5.2 shows 3 Junior High School has not reached
maximum efficiency, namely: Junior High School 2, 19 and Dwi Jendra. Input variable the cause of
inefficiency respectively are follows: computer ratio/student must be reduced by -12.05%. It means ratio
computers available is 78/1313 (1:17) or one computer for 17 students to be reduced by 12:05 % to become
69/1313 (1:19) or one computer for 19 students. Input variable of household school cost/student ratio must be
reduced by 11:12%. It means ratio of household school costs/student at 721.962/1313 (Rp 549,857 per student)
to become 641.680/1313 (or Rp 488,713 per student) for one year.
Input variable of non educator/student ratio must be reduced by -10.86%. It means that non-
educator/student ratio is 55/1313 (1:24) or one non-educator staff serve 24 students must be reduced by 10.86%
to become 49/1313 (1:27) or 1 non-educational personnel serve 27 students. Similarly, other variable inputs
should also be reduced as shown in Table 5.2.
Output variable of graduation/student ratio and not dropout/student ratio have "total potential
improvement" 0%. It means both output variable has reached the maximum efficiency with 100% graduation
and dropout rates are 0%. While academic achievement/student ratio still must be raised at 0:44 becomes
79.45% from 79.20, as shown in table 5.2.
Table 5.3. "Total Potential Improvement" of Junior High School 2, 11, and 19
in Mataram City for Year 2011/2012
No Input
Total Potential
Improvement
1 Ratio of monitoring, supervision and reporting/student -14,4%
2 Ratio of household school costs /student -12,47%
3 Welfare/Student Ratio -10,89%
4 Ratio the profession coaching cost/student -10,89%
5 Ratio of non-education/student -8,67%
6 Ratio of increase in extracurricular guidance cost/student -7,74%
7 Ratio the cost to increase learning process/student Ratio -7,62%
8 Ratio of computer/student -6,77%
9
Cost of maintenance and replacement of facilities and
infrastructure/student -6,35%
10 Ratio of Wage/Student -6,05%
11 Ratio of teacher/student -4%
12 Ratio of classroom/student -3,75%
output
13 Ratio of academic achievement/student 0,4%
14 Ratio of graduation/student 0%
15 Ratio of not drop out /student 0%
Source: Input-Output measurement results, secondary data processed 2011/2012
Table 5.3 shows in year 2011/2012 there are 3 Junior High School which has not reached the maximum
of efficiency, namely: Junior High School 2, 11 and 19. The cause of less maximum efficiency respectively are
follows: Ratio of monitoring, supervision and reporting/student should be reduced by 14.4%. It means Ratio of
monitoring, supervision and reporting/student 699,328/1743 (Rp 401,221/student) become 598,625/1743 (Rp
343,45/student).
Ratio of Welfare/student must be reduced by 10.89%. It means Ratio of household school costs /student should
be reduced from 967,237/1743 (per student/year People`s Welfare burden imposed by Rp 554,927) into
861,905/1743 (Rp 494,50/student). Other input variables should also be reduced, as shown in Table 5.2.
Output variable the ratio of graduation/student and not dropout /student have "total potential improvement" of
0%. It means that both output variable has reached the maximum efficiency with 100% graduation and dropout
rates 0%. While academic achievement/student still must be increased by 0.40% from 81.43 into 81.76. For
more details, see table 5.3.
9. Efficiency Analysis of Education Implementatio….
www.ijbmi.org 31 | Page
VI. CONCLUSIONS AND RECOMMENDATIONS
Conclusion
Based on analysis and discussion above, we can make following conclusions:
1) Average efficiency score of Private Junior High Schools are higher than Public Junior High Schools.
Efficiency of Junior High School in Mataram for 2009/2010 reaches the maximum scores. For
2010/2011 to 2011/2012 there are three (3) Junior High School inefficient.
2) Inefficiencies were caused by wastage in inputs usage and output is not maximal. Generally, wasted input
variables are:
a) Monitoring, supervision and reporting per student which includes: cost of development activities,
monitoring, and supervision at school level.
b) Household school costs per student which include: cost of administrative activities, meetings and
consumption.
c) Number of computers per student
d) Welfare per student which includes: wages and fees received by teachers and staff of upgrading
activities, business travel, overtime.
e) Cost of professional development per student which includes: school spending to improve the teaching
profession in form of training, upgrading and others.
f) Number of non-education staff per student
1. While its output variable that need to be improved is average academic performance improved.
Suggestions
1. Inefficient Junior High School should improve the ability in cost usage and allocation. Optimum cost
usage and allocation can minimize input and produces maximum output so that efficiency becomes
maximum.
2. Governance should be used to improve school budget allocation and monitoring systems. School's budget
is focused on activities that directly related to teaching and learning process to maximize quality of
academic achievement. The role of School Committee needs to be increased to prepare Budget School
Plan .
Research limitations and Future Research
1. Data are available only for 3 years. Future research should use longer data to see clearly impact of
changes.
2. DEA has several drawbacks, therefore future research should use stronger analysis tool.
REFERENCES
[1]. Bank Dunia, (1993), The East Asia Miracle, Oxford, University Press.
[2]. Barbetta, G.P., & Turati, G. (2003). Efficiency of junior high schools and the role of proprietary structure. Annals of Public and
Cooperative Economics, 74 (4), 529551.
[3]. Bogetoft, and Lars Otto. 2011. Benchmarking with DEA, SFA, and R. Heidelberg Springer Verlag.
[4]. Braun, H., Jenkins, F., & Grigg, W. (2006). Comparing private schools and public schools using hierarchical linear modeling.
Report 2006-461. Washington DC: National Center for Education Statistics.
[5]. Calero, J., & Escardíbul, J.O. (2007). Evaluación de servicios educativos: elrendimiento en los centros públicos y privados
medido en PISA-2003. Hacienda Pública Española, 183 (4), 33-66.
[6]. Coelli, T. et.al. 2005.An Introduction to Efficiency and Productivity Analysis. Springer, United State of America.
[7]. Depdiknas. 2001. Kep Mendiknas
no 053 tahun 2001 tentang Pedoman Penyususnan Standar Pelayanan Minimal Penyelenggaraan Persekolahan Bidang
Pendidikan Dasar dan Menengah.
[8]. ---------------. 2005. Rencana Strategis Departemen Pendidikan Nasional 2005-2009, Jakarta: Depdiknas. hal. 13-20.
---------------, 2009, Rencana Strategis Departemen Pendidikan Nasional Tahun 2010 – 2014 Jakarta, 17 September 2009.
[9]. Etibar, Jafarov , and Anna Ilyina . 2008.” Republic of Croatia: Selected Issues.” IMF Country Report No. 08/159.
http://www.imf.org/external/ pubs/ft/scr/2008 /cr08159.pdf. Diakses tanggal 7 Juli 2010.
[10]. Fattah, N. 2009. Ekonomi dan Pembiayaan Pendidikan. Bandung: Penerbit Rosdakarya.
[11]. Geert, Almekidenders, , Aloina Cebotari, and Andreas Billmeier. 2007. “ Arab r e p u b l i c O f E g y p t : s e l e c t e d
I s s u e s . ” I M F C o u n t r y R e p o r t N o . 07/381 . http://www.imf.org/external/pubs /ft/scr/2007/ cr07381.pdf.
Diakses pada tanggal 7 Juli 2010.
[12]. Gian Paolo Barbeta dan Gilberto Turati. 2001. Efficiency of Junior High Schools and The Role of Proprietary structure. Italy :
Journal, Stato o Mercato Intervento Publico e architektture dei mercati Pavia, Universita. 5-6 Ottobre 2001.
[13]. Lubienski, S.T., & Lubienski, C. (2006). School sector and academic achievement: a multilevel analysis of NAEP mathematics
data. American Educational Research Journal, 43 (4), 651-698.
[14]. Lubienski, C., Weitzel, P., & Lubienski, S.T. (2009). Is there a “consensus” on school choice and achievement? Educational
Policy, 23 (1), 161-193.
[15]. Mancebon, M. & Mar Molinero, C. (2000).Performance in primary schools. Journal of the Operational Research Society, 51,
843-854.
[16]. Maria-Jesus Mancebon-Torrubia and Jorge Calero and Alvaro Choi and Domingo Perez imenez-de-Embun ,2010, Effciency of
10. Efficiency Analysis of Education Implementatio….
www.ijbmi.org 32 | Page
public and publicly-subsidized high schools in Spain. Evidence from PISA 2006, Universidad de Zaragoza, Universidad de
Barcelona
[17]. Marijn, Verhoeven, Victoria Gunnarsson , and Stéphane Carcillo. 2007. “Education and Health in G7 Countries: Achieving
Better Outcomes with Less Spending .” IMF Working Paper No.26. http://www.imf.org /external/pubs/ft/wp
/2007/wp07263.pdf. Diakses tanggal 7 Juli 2010.
[18]. Muzakar Isa. (2009), Efisiensi Teknis Pendidikan Di Kota Surakarta: Aplikasi Data Envelopment Analysis (DEA), Benefit
Jurnal Manajemen dan Bisnis Volume 13, Nomor 1, Juni 2009, hlm.14-22
[19]. Nicholson, Walter. 2003. “Intermediate Microeconomics.” The McGraw-Hill Inc :New York.
[20]. Pattinasarany, Daan dan Blane Lewis . 2008. “Perencanaan dan Pembiayaan dalam Pencapaian SPM Bidang Pendidikan:
Berdasarkan Temuan Governance and Decentralization 2 (GDS2).” Departemen Dalam Negeri dengan dukungan ASSD (GTZ),
DSF, GRSII (CIDA). http://www.dsfindonesia.org /apps/dsfv2 /upload/20080516-104931-GDS2_SPM_Pendidikan.pdf. Diakses
pada tanggal 26 Juli 2010
[21]. Peraturan Pemerintah No.19 Tahun 2005 Tentang Standar Pendidikan Nasional.
[22]. Rajiv, D Banker,Surya Janakiraman dan Ram Natarajam. 2000. Analysis of Trends in Technical and Allocative Efficiency: an application
to texas public schooldistricts. Texas USA: School of Management, March 2000.
[23]. Ramanathan, (2003), An Intruduction to Data Envelopment Analysis: A Tool for Performance Measurement, Sage Publication
India Pvt Ltd B-42, Panchsheel Enclave, New Delhi 110017.
[24]. Sabiran. 2003. Profil Pembiayaan Pendidikan Untuk Meningkatkan Mutu dan Pemerataan Pendidikan Dasar.
WWW.Depdiknas.go.id download 2004.
[25]. Samsubar Saleh. 2000. Data Envelopment Analysis (DEA): Konsep Dasar. Yogyakarta: PAUSE UGM.
[26]. Worthington, Andrew (2001) An Empirical Survey of Frontier Efficiency Measurement Techniques in Education. Education
Economics 9(3):pp. 245-268.