
Empfohlen
Empfohlen
Weitere ähnliche Inhalte
Was ist angesagt?
Was ist angesagt? (18)
Andere mochten auch
Andere mochten auch (14)
Ähnlich wie International Journal of Computational Engineering Research(IJCER)
Ähnlich wie International Journal of Computational Engineering Research(IJCER) (20)
Kürzlich hochgeladen
Kürzlich hochgeladen (20)
International Journal of Computational Engineering Research(IJCER)
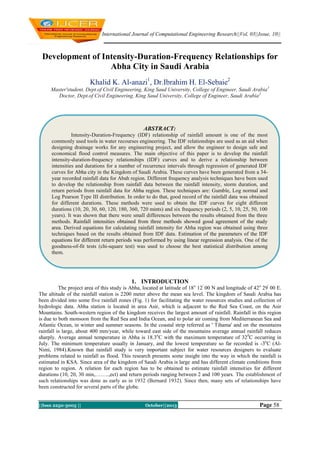
- 1. International Journal of Computational Engineering Research||Vol, 03||Issue, 10|| Development of Intensity-Duration-Frequency Relationships for Abha City in Saudi Arabia Khalid K. Al-anazi1, Dr.Ibrahim H. El-Sebaie2 Master'student, Dept.of Civil Engineering, King Saud University, College of Engineer, Saudi Arabia 1 Doctor, Dept.of Civil Engineering, King Saud University, College of Engineer, Saudi Arabia 2 ABSTRACT: Intensity-Duration-Frequency (IDF) relationship of rainfall amount is one of the most commonly used tools in water recourses engineering. The IDF relationships are used as an aid when designing drainage works for any engineering project, and allow the engineer to design safe and economical flood control measures. The main objective of this paper is to develop the rainfall intensity-duration-frequency relationships (IDF) curves and to derive a relationship between intensities and durations for a number of recurrence intervals through regression of generated IDF curves for Abha city in the Kingdom of Saudi Arabia. These curves have been generated from a 34year recorded rainfall data for Abah region. Different frequency analysis techniques have been used to develop the relationship from rainfall data between the rainfall intensity, storm duration, and return periods from rainfall data for Abha region. These techniques are: Gumble, Log normal and Log Pearson Type III distribution. In order to do that, good record of the rainfall data was obtained for different durations. These methods were used to obtain the IDF curves for eight different durations (10, 20, 30, 60, 120, 180, 360, 720 mints) and six frequency periods (2, 5, 10, 25, 50, 100 years). It was shown that there were small differences between the results obtained from the three methods. Rainfall intensities obtained from three methods showed good agreement of the study area. Derived equations for calculating rainfall intensity for Abha region was obtained using three techniques based on the results obtained from IDF data. Estimation of the parameters of the IDF equations for different return periods was performed by using linear regression analysis. One of the goodness-of-fit tests (chi-square test) was used to choose the best statistical distribution among them. 1. INTRODUCTION The project area of this study is Abha, located at latitude of 18 o 12' 00 N and longitude of 42o 29' 00 E. The altitude of the rainfall station is 2200 meter above the mean sea level. The kingdom of Saudi Arabia has been divided into some five rainfall zones (Fig. 1) for facilitating the water resources studies and collection of hydrologic data. Abha station is located in area Asir, which is adjacent to the Red Sea Coast, on the Asir Mountains. South-western region of the kingdom receives the largest amount of rainfall. Rainfall in this region is due to both monsoon from the Red Sea and India Ocean, and to polar air coming from Mediterranean Sea and Atlantic Ocean, in winter and summer seasons. In the coastal strip referred as ' Tihama' and on the mountains rainfall is large, about 400 mm/year, while toward east side of the mountains average annual rainfall reduces sharply. Average annual temperature in Abha is 18.3oC with the maximum temperature of 320C occurring in July. The minimum temperature usually in January, and the lowest temperature so far recorded is -3oC (AlNimi, 1984).Known that rainfall study is very important subject for water resources designers to evaluate problems related to rainfall as flood. This research presents some insight into the way in which the rainfall is estimated in KSA. Since area of the kingdom of Saudi Arabia is large and has different climate conditions from region to region. A relation for each region has to be obtained to estimate rainfall intensities for different durations (10, 20, 30 min,……..,ect) and return periods ranging between 2 and 100 years. The establishment of such relationships was done as early as in 1932 (Bernard 1932). Since then, many sets of relationships have been constructed for several parts of the globe. ||Issn 2250-3005 || October||2013 || 2013 Page 58
- 2. Development Of Intensity-Duration-Frequency… Many previous studies have been done on rainfall analysis in various regions of the world. Koutsoyiannis et al.,(1998) and Koutsoyiannis( 2003) cited that the IDF relationship is a mathematical relationship between the rainfall intensity i, the duration d, and the return period T (or, equivalently, the annual frequency of exceedance, typically referred to as "frequency" only).Lekan oyebande (1982), studied " Deriving rainfall intensity-duration-frequency relationship and estimates for regions with inadequate data" used type 1 extreme- value distribution (Gumbel) was applied to the annual extreme rainfall data sets generated by 11 rainfall zones to estimate the parameters and hence the intensity-duration-frequency (IDF) rainfall. The chisquare test confirmed the appropriateness of the fitted distribution. Gumbel graphical plots and the computed confidence limits also showed that the Gumbel EV-1 function fits well the empirical distributionIn 1998, a study performed in Texas, “Regionalization of Precipitation Maxima for Texas” (Asquith, 1998) determined that the annual maxima for the 12-hour and less durations were best fit using the generalized logistic distribution (GLO). However, Asquith found that the generalized extreme value (GEV) distribution best fit his longer durations. Mohammad Samawi and Najib Sabbagh (2004), studied application of motheds for analysis of rainfall intensity in areas of Israeli, Jordanian, and Palestinian Interest. The purpose of that study was to describe the meteorological conditions and precipitation data for a selected study area within the region, methods developed to analyze precipitation data in the region, and results of a pilot application of the methods to analyze precipitation data for selected precipitation stations in the study area. The methods included computer software developed specifically for rainfall data compilation and analysis by the core parties, the management and analysis of precipitation data. Naidal A. Hadadin, (2005), studied Rainfall Intensity–Duration–Frequency Relationship in the Mujib Basin in Jordan. IDF equations were developed for each of the 8 rainfall recording station in the basin. The 8 IDF equations obtained were compared with the curves obtained by Gumble method and Water Authority of Jordan (WAJ). The results predicted by the writer were close to the measured values. J.P.Raiford et al., (2007) developed Rainfall Depth-Duration-Frequency Relationships for South Carolina, North Carolina, and Georgia using the available rainfall data. In this study, the product moment method and the Lmoment method with regional analysis were investigated for developing iospluvial maps and IDF curves for the regions under study. The L-moment method with X-10 test was used to search for homogeneous regions within the study area. The Map series was obtained at each site and fitted to the normal, lognormal, generalized extreme value, Pearson type III, and log Pearson type III distribution for each duration. The distribution selected based on the chi-square test was then used to find depth-duration-frequency (DDF) values at 2,10,25,50,and 100 years. Marta bara et al, (2009), studied the estimation of IDF curves of extreme rainfall by simple scaling theory to the intensity-duration-frequency (IDF) characteristics of short duration rainfall in Slovakia. The rainfall data for the analysis consists of rainfall intensities of the durations ranging from 5 minutes to 180 minutes and daily rainfall amounts for 55 stations from the whole territory of Slovakia, taken from the historical database. Al-Shaikh.A(1985) performed a study on the rainfall frequency for Saudi Arabia ,the purpose of the study was to derive rainfall depth-duration-frequency relationship (DDF) for Saudi Arabia through analysis of available rainfall intensity data for individual stations by using the EV1 (Gumble) distribution with the application of maximum likelihood method. He divided Saudi Arabia to four regions by specifying certain criteria, with curves and equations for each region by using EV1 (Gumble) distribution with application of maximum likelihood method. Jebreen M.Al-jebreen(1985) studied flood frequency analysis and a regional analysis for three basins in South-Western region of the Kingdom. The magnitudes of floods for different return periods, 5,10,25,50 and 100 years, were calculated using the analytical and graphical extreme value Type I distribution and Log-Pearson Type III distribution. The results obtained from the two distribution showed that the extreme value type I distribution is the most suitable distribution for this region. And almost there is no difference between the results of graphical and analytical solution. The Log Person Type III distribution gives inconsistent results, sometimes over predicting magnitudes of floods, and in some cases the differences between say the 50 and 100 years floods are very small.Al-Saleh.M(1994), studied frequency analysis of rainfall in al-auwayiyah area, Saudi Arabia. The aim of this study was to identify the recurrence of the annual rainfall and the highest daily amount of rain per year in the region. He used the probability distribution of the values of the maximum, and the method of "chi" square (Goodness fit) to choose a good match for this distribution. He found that distribution is compatible with the rainfall data at the level of 0.10, indicating that this distribution is compatible to a satisfactory degree. He found also that the annual rainfall and the highest daily amount of rain per year follow the probability distribution of the maximum values (EV1) at the significance level 0.10. ||Issn 2250-3005 || October||2013 || 2013 Page 59
- 3. Development Of Intensity-Duration-Frequency… S.A. AlHassoun, 2011 developed empirical formulae to estimate rainfall intensity in Riyadh region. He found that there is no much difference in results of rainfall analysis of IDF curves in Riyadh area between Gumbel and LPT III methods. He attributed this to that Riyadh region has semi-arid climate and flat topography where variations of precipitation from is not big. Awadallah A.G. et al., 2011 presented a methodology to overcome the lack of ground stations rainfall by the joint use of the available ground data with TRMM satellite data to develop IDF curves and he used a method to develop ratios between 24-hr rainfall depth and shorter duration depths. Elsebaie, I.H., 2011 conducted a study for the formulation and construction of IDF curves using data from recording station in KSA by using two distribution methods (Gumbel and Log Pearson type III Distribution). He found that Gumbel method gave some larger rainfall intensities estimates compared to Log Pearson type III Distribution. Also, He derived IDF equations for the two regions (Najran and Central & Eastern province) for duration varying from 10 to 1440 min and return period from 2 to 100 years. In general, the results obtained using the two approaches is very close at most of the return periods and have the same trend. Fig. 1 Rainfall zones in Saudi Arabia. II. DATA COLLECTION Rainfall intensity data are important for civil engineering works, because they are the basis on which designs will be made. Data gathering are perhaps, the most difficult part of the paper. Historical rainfall intensity data from different climatological stations were available from the Ministry of Water and Electricity (MOWAE) in Riyadh, hydrology department (KSA), Abha station No.A-005. These data have been collected since 1969 till 2003. So we have 34 years of record, which relatively a good record. The station A-005 which collected the rainfall intensity is located at 18o 12' N and longitude of 42o 29' E and 2200 meter above the mean sea level. Annual maximum of these data was selected for each duration of (10, 20, 30, 60, 120, 180, 360, 720 minutes) and plotted on logarithmic scale paper to obtain intensity-duration-frequency relationship with few missing data and the other stations have very few records of the data which are not presentable at all to be considered in the study. III. DEVELOPMENT OFINTENSITY DURATIONFREQUENCY CURVES For many hydrologic analyses, planning or design problems, reliable rainfall intensity estimates are necessary. Rainfall intensity duration frequency relationship comprises the estimates of rainfall intensities of different durations and recurrence intervals. There are commonly used theoretical distribution function were applied in different regions all over the world (e.g. GEV, Gumbel, Log normal, Pearson type III distributions). Gumbel distribution methodology was applied on different region all over the world. Different commonly ||Issn 2250-3005 || October||2013 || 2013 Page 60
- 4. Development Of Intensity-Duration-Frequency… frequency analysis techniques were used to develop the relationship between the rainfall intensity, storm duration, and return periods from rainfall data for the regions under study. These techniques are: Gumbel distribution, Log normal distribution, and log Pearson Type III distribution. A. Gu mbel distribution This distribution was first proposed by Gumble in 1941 for analysis of flood frequencies. Gumble distribution methodology was selected to perform the flood probability analysis. The Gumble theory of distribution is the most widely used distribution for relationship intensity duration frequency (IDF) analysis and relatively simple and uses only extreme events (maximum values or peak rainfalls). The Gumbel method calculates the 2, 5, 10, 25, 50 and 100-year return intervals for each duration period and requires several calculations. In this method, from the raw data to compute the maximum precipitation (P) and the statistical variables (arithmetic average and standard deviation) for each duration (10, 20, 30, 60, 120, 180, 360, 720 minutes) were computed . B. Log Pearson type III The Log Pearson type III (LPIII) probability model is used to calculate the rainfall intensity at different rainfall durations and studies return periods to form the historical data IDF curves for each station. It is commonly used in Vietnam. Log Pearson type III distribution involves logarithms of the measured values. The mean and the standard deviation (statistical variables) are determined using the logarithmically transformed data, using these frequency distribution functions, the maximum rainfall intensity for considered durations 2, 5, 10, 20, 50 and 100 years studies return periods. In the same manner as with Gumbel method, the rainfall intensity duration frequency is obtained using LPIII method but using the logarithm of variables in the relations. C. Log normal distribution Application of normal logarithmic method requires converting rainfall values to logarithmic values (i.e. logarithm values of the statistical variables). This distribution follows the same procedure of the Log Pearson type III distribution but the Log normal distribution used KT by Gumbel method. Results of precipitation and intensities value for eight durations(10, 20, 30, 60, 120, 180, 360 and 720 minutes) and six return periods using Log normal distribution are obtained with same manner as before. IV. DERIVATION OF IDF EQUATION The intensity duration frequency (IDF) formulas are the empirical equations representing a relationship among maximum rainfall intensity (as dependant variable) and other parameters of interest such as rainfall duration and frequency (as independent variables). There are several commonly used functions relating those variables previously mentioned found in the literature of hydrology applications (V.T.Chow, 1988).To derive an equation for calculating rainfall intensity (It) for the regions of interest or the station, there are some required steps for establishing an equation suit the calculation of rainfall intensity (I t) for a certain recurrence interval and specific rainfall period which depends mainly on the results obtained from the intensity duration frequency (IDF) curves and the corresponding logarithmic conversion, where it is possible to convert the equation into a linear equation, and thus to calculate all the parameters related to the equation (see Chow (1988); Nhat el al. (2006); AlHassoun (2011) and Elsebaie (2001)).The empirical parameters values (c, m, and e) shown in the proposed equation ( I = C*Trm/Tde ) were estimated by analyzing the IDF data obtained from the applied techniques using logarithmic relationships of dependent variables (T d and Tr ) against independent variable (It). These parameters for Abha region are shown in Table (1). Table (1) Abah Region Parameter c m e the parameters values used in deriving formulas. Gumbel 331.94 0.196 0.613 LPTIII 369.82 0.142 0.608 Log normal 287.42 0.307 0.611 Average 329.73 0.215 0.611 Thus so, the intensity duration frequency formula that can be used to be obtain rainfall intensity (I t) for any design storm of specific duration (Td) and return period (Tr) for Abha region will be in the relation. ||Issn 2250-3005 || October||2013 || 2013 Page 61
- 5. Development Of Intensity-Duration-Frequency… It = (1) This concludes that the derived formula can be used to estimate any frequency rainfall data and to get deign storm in Abha region. V. GOODNESS OF FIT TEST The aim of the test is to decide how good a fit is between the frequency of occurrence observed in a sample and the expected frequencies obtained from the hypothesized distribution. A goodness-of-fit test between observed and expected frequencies is based on the chi-square quantity, which is expressed as, X2 2 / Ei (2) Where, Region Distribution Abha X2 is a random variable whose sampling distribution is approximated very closely by the chi square distribution. The symbols Oi and Ei represent the observed and expected frequencies, respectively, for the i-th class interval in the histogram. The symbol k represents the number of class intervals. Since there is no fixed rule for the choice of the number of class intervals. If the observed frequencies are close to the corresponding expected frequencies, the X2 value will be small, indicating a good fit; otherwise, it is a poor fit. A good fit leads to the acceptance of (null hypothesis), where as poor fit leads to its rejection. The critical region will, therefore, fall in the right tail of the chi-square distribution. For a level of significance equal to , the critical value X2a is found from readily available chi-square tables and X2 > constitutes the critical region (See A.A. Al-Shaikh, 1985). Table 2. Shows results of the chi-square goodness of fit test on annual series of rainfall. Table (2): Results of chi-square goodness of fit test on annual maximum rainfall. Gumbel LPT III Log normal 10 8.01 18.29 10.2 VI. 20 3.29 12.34 14.2 30 4.64 9.77 9.1 Duration (min) 60 120 6,71 2.94 6.29 9.76 14.7 15.4 180 6.97 15.41 14.7 360 3.23 18.29 13.3 720 5.33 9.24 8.6 RESULTS AND ANALYSIS This study is about developing IDF curves and derives an empirical formula between intensities and durations to estimate the rainfall intensity at Abha region in KSA. The curves allow the engineer to design safe and economical flood control measures. Rainfall intensities (in mm/hr) estimates for various return periods and different durations were analyzed using three techniques (Gumbel, Log normal and LPT III methods). According to the IDF curves, rainfall intensities estimates are increasing with increase in the return period and the rainfall intensities decrease with increase rainfall duration in the all return period. Rainfall intensities rise in parallel with the rainfall return periods. The results obtained from the three methods have good consistency. Figs 2-4 show results of the IDF curves obtained by Gumbel, LPIII and Log normal methods for Abha region. It was shown that there were no much differences in the results of rainfall analysis of IDF curves in Abha area between Gumbel, LPIII and Log normal methods. A derive equation, Eq. (1), was found to provide the best correlated and consistent relationships of analytical and derived curves for Abha area. It used to estimate rainfall intensity for various durations and different return periods to get deign storm in Abha region and can be used instead of construction IDF curves. Also, goodness of –fit test were used to choose the best statistical distribution among those techniques.. The results obtained from chi-square goodness of fit test for three methods have good consistency, where Xcal < Xtab in all cases. ||Issn 2250-3005 || October||2013 || 2013 Page 62
- 6. Development Of Intensity-Duration-Frequency… Fig. 2 IDF curves by Gumbel method at Abah station (Log scale). Fig. 3 IDF curves by LPT III at Abah station (Log scale). ||Issn 2250-3005 || October||2013 || 2013 Page 63
- 7. Development Of Intensity-Duration-Frequency… Fig. 4 IDF curves by Log normal method at Abah station (Log scale). VII. CONCLUSTION This study has been conducted to derive a relationship between intensities and durations for a number of recurrence intervals ranging between 2 and 100 years and construction of IDF curves using data from recording station for Abha region by using three distribution methods: Gumbel, LPIII and Log normal distribution. The results obtained using the three approaches are very close at most of the return periods and have the same trend, this agrees with the results obtained by Al-Shaikh (1985) (station Abha, A001), very close from the station used in that research. The results obtained from that work are consistent with the results from previous studies. It can be concluded that these differences observed between the results of this study and the results done before by Al-Shaikh (1985); this can be attributed to the record lengths of the rainfall data used for this study. In this study used long record of the historical data starting from 1969 to 2003. The parameters of the design storm intensity for a given period of recurrence were estimated for Abha region. The results obtained showed a good match between the rainfall intensity computed by the methods used and the values estimated by the derive formula. The chi-square test was used to examine the combinations or contingency of the observed and theoretical frequencies, and on the other hand, to decide about the type of distribution which the available data set follows. The results of the chi-square test of goodness of fit showed that in all the durations the null hypothesis that the extreme rainfall series have the Gumbel distribution, LPIII and Log normal distribution are acceptable. Although the chi-square values are appreciably below the critical region using Gumbel distribution, LPIII and Log normal distribution, it is difficult to say that one distribution is superior to the other. ACKNOWLEDGMENTS All gratitude is due to Allah. The writer is thankful to the Ministry of Water and Electricity (MOWAE) in Riyadh, hydrology department (KSA) for providing the data needed for the research. We deep thanks to all who offered any direct or indirect assistance in the completion of this research. REFERENCES [1] [2] [3] [4] [5] [6] V.T. Chow, "Handbook of Applied Hydrology", McGraw-Hill Book, 1988. Ministry of water and electricity (MOWE) in Riyadh (2011),"Hydrological Department" in Saudi Arabia. Hassan Al-Niemi, " Rainfall frequency analysis of abha area " M.S. Thesis, Civil Engineering Department; King University, Riyadh (K.S.A), 1984. M.A.Al-Saleh," Frequency Analysis of Rainfall in Al-Quwayiyah Area, Saudi Arabia", Resarch Papers in Geography; Saud University, Riyadh (K.S.A), 1994. A.A. Al-Shaikh, "Rainfall frequency studies for Saudi Arabia", M.S. Thesis, Civil Engineering Department; King University, Riyadh (K.S.A), 1985. J.M.Al-Jebreen,"Flood Frequency and Regional Analysis For Some Selected Basins In Saudi Arabia", B.S. Project, Engineering Department; King Saud University, Riyadh (K.S.A), Decmber.1985. ||Issn 2250-3005 || October||2013 || 2013 Saud King Saud Civil Page 64
- 8. Development Of Intensity-Duration-Frequency… [7] [8] [9] [10] [11] [12] [13] [14] [15] [16] H.A. Al-Khalaf, " Predicting short-duration, high-intensity rainfall in Saudi Arabia", M.S. Thesis, Faculty of the college of Graduate Studies; king Fahd University of Petroleum & Minerals, Dahran,(K.S.A), 1997. D.Koutsoyiannis, D.Kozonis, and A.Manetas, "A mathematical Framework for Studing Rainfall Intensity-Duration-Frequency Relationship",J.Hydrol., 206: 118-135, 1998. Asquith,William H."Regionalization of Precipation Maxima for Texas".U.S. Geological Survey, Water Resources Division, 1998. N.A. Hadadin,"Rainfall Intensity-Duration-Frequency Relationship in the Mujib basin in Jourdan ",Journal of Applied Science 8(10):1777-1784,2005. M. Samaw and, N. Sabbagh, "Application of Methods for Analysis of Rainfall Intensity in Areas of Israeli", Jordanian, and Palestinian Interest, Jordanian Meteorological Department, Ministry of Water and Irrigation, Amman, Jordan, 2004. Marta bara,silvia kohnova,Ladislva gaal,Jan szolgay,Kamila hlavcova),"estimation of IDF curves of extreme rainfall by simple scaling in Slovakia". Contribution to Geophysics and Geodesy. Vol 39/3, 2009 (187-206,(2009). A.G. Awadallah, M. ElGamal, A. ElMostafa, and H. ElBadry, "Developing Intensity-Frequency Curves in Scarce Data Region: An Approach using Regional Analysis and Satellite Data”, Scientific Research Publishing, Engineering, 2011,3,215-226. J.P. Raiford, N.M. Aziz, A.A. Khan and D.N. Powel "Rainfall Depth-Duration-Frequency Relationships for Soujth Carolina, and Georgia”, American Journal of Environmental Sciences 3 (2): 78-84, 2007. Elsebaie, I.H. “Rainfall Intensity-Duration-Frequency Relationship for some Regions in Saudi Arabia " International Journal of Sustainable Water and Environmental Systems (IASKS), ISSN: 1923-7537, Vol. 2 Issue: 01, pp. 7-16, 2011. S.A. AlHassoun "Developing an empirical formulae to estimate rainfall intensity in Riyadh region”, Journal of King Saud University-Engineering Sciences (2011). ||Issn 2250-3005 || October||2013 || 2013 Page 65