Positioning to win: 2015 global private equity survey
•
0 gefällt mir•958 views

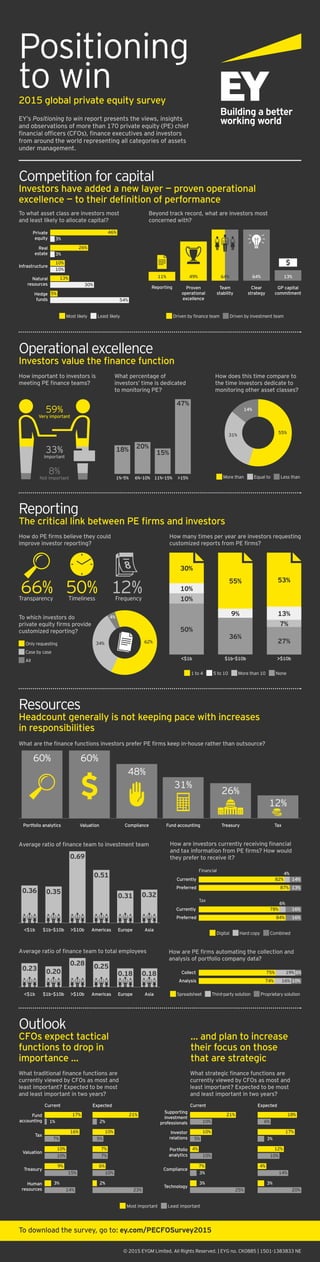
EY’s Positioning to win survey seeks to understand the rapidly evolving link between private equity firms and investors, both poised to capitalize on an opportunistic environment. These valuable insights offer a perspective of similarities and differences as seen through the lens of these two communities, and will assist CFOs as they institute operating models that position their firms to win the competition for capital. http://www.ey.com/PECFOSurvey2015
Empfohlen

Empfohlen
Weitere ähnliche Inhalte
Was ist angesagt?
Was ist angesagt? (19)
Ähnlich wie Positioning to win: 2015 global private equity survey
Ähnlich wie Positioning to win: 2015 global private equity survey (20)
Mehr von EY
Mehr von EY (20)
Kürzlich hochgeladen
Kürzlich hochgeladen (20)
Positioning to win: 2015 global private equity survey
- 1. >$10b 53% 13% 7% 27% $1b–$10b 55% 9% 36% <$1b 30% 10% 10% 50% 0.23 0.20 0.28 0.25 0.18 0.18 0.36 0.69 0.51 0.31 0.320.35 13%64%64%11% 49% Private equity Team stability Proven operational excellence Reporting Clear strategy GP capital commitment Real estate Infrastructure Natural resources Hedge funds 46% 26% 10% 10% 30% 13% 54% 5% 3% 3% 1% 2% 17% 7% 16% 10% 10% 15% 9% 14% 3% 2% 3% 3% 3% 3% 5% 7% 10% 23% 21% 10% 7% 6% 10% 5% 10% 25% 21% 10% 4% 7% 6% 10% 14% 20% 18% 17% 12% 4% Fund accounting Tax Valuation Treasury Human resources Supporting investment professionals Investor relations Portfolio analytics Compliance Technology Current CurrentExpected Expected Most important Least important 59% Very important 33% Important 8% Not important Only requesting Case by case All To which investors do private equity firms provide customized reporting? Frequency 12%Timeliness 50% Portfolio analytics Valuation Compliance Fund accounting Treasury Tax Americas Europe Asia$10b$1b–$10b$1b Americas Europe Asia$10b$1b–$10b$1b Transparency 66% 1 to 4 5 to 10 More than 10 None Digital Hard copy Combined Spreadsheet Third-party solution Proprietary solution More than Equal to Less than 55% 31% 14% 18% 1%–5% 20% 6%–10% 15% 11%–15% 47% 15% Currently Currently Collect Preferred Preferred Analysis 84% 87% 78% 82% 16% 13% 16% 14% 75% 6%19% 74% 10%16% 4% 6% 62%34% 4% Most likely Least likely Driven by finance team Driven by investment team Financial Tax Average ratio of finance team to investment team What are the finance functions investors prefer PE firms keep in-house rather than outsource? Average ratio of finance team to total employees 60% 60% 48% 31% 26% 12% Positioning to win2015 global private equity survey EY’s Positioning to win report presents the views, insights and observations of more than 170 private equity (PE) chief financial officers (CFOs), finance executives and investors from around the world representing all categories of assets under management. © 2015 EYGM Limited. All Rights Reserved. | EYG no. CK0885 | 1501-1383833 NE To what asset class are investors most and least likely to allocate capital? How important to investors is meeting PE finance teams? How do PE firms believe they could improve investor reporting? How many times per year are investors requesting customized reports from PE firms? How are investors currently receiving financial and tax information from PE firms? How would they prefer to receive it? What traditional finance functions are currently viewed by CFOs as most and least important? Expected to be most and least important in two years? What strategic finance functions are currently viewed by CFOs as most and least important? Expected to be most and least important in two years? How are PE firms automating the collection and analysis of portfolio company data? Beyond track record, what are investors most concerned with? What percentage of investors’ time is dedicated to monitoring PE? How does this time compare to the time investors dedicate to monitoring other asset classes? Competition for capital Investors have added a new layer — proven operational excellence — to their definition of performance Operational excellence Investors value the finance function Reporting The critical link between PE firms and investors Resources Headcount generally is not keeping pace with increases in responsibilities Outlook CFOs expect tactical functions to drop in importance … … and plan to increase their focus on those that are strategic To download the survey, go to: ey.com/PECFOSurvey2015