How to Troubleshoot Apps for the Modern Connected Worker
Big datafordevelopment un-globalpulsejune2012
1.
Big Data for Development:
Challenges & Opportunities
May 2012
2. Acknowledgements
This paper was developed by UN Global Pulse, an initiative based in the Executive Office of the
Secretary-General United Nations. Global Pulse is grateful to the Government of Australia,
Government of Sweden, the Government of the United Kingdom, UNDP, UNICEF, WFP and the
UN’s Department of Public Information to their generous support to the initiative.
The paper was written by Emmanuel Letouzé, Senior Development Economist (2011), with
research support from current and former Global Pulse colleagues who provided resources,
feedback and helped shape the ideas that inform the contents of this paper. It was edited by
Anoush Rima Tatevossian and Robert Kirkpatrick, with copyediting support from Cassandra
Hendricks. The production and design of the report was supported by Charlotte Friedman.
We would like to thank Scott Gaul, Björn Gillsäter, and Samuel Mendelson, for their time in
reviewing a number of draft versions of this paper, and providing detailed feedback.
Global Pulse has benefited from the experience and expertise of a wide range of colleagues both
inside and outside of the UN system. Global Pulse acknowledges the extensive research
conducted in this diverse and emerging field by partners such as the Billion Prices Project, JANA,
Ushahidi, International Food Policy Research Institute (IFPRI), Google Flu Trends, the Global
Viral Forecasting Initiative, Telefonica Research, the Institute for Quantitative Social Science at
Harvard University, L'institut des Systèmes Complexes – Paris Île-de-France, SAS, Crimson
Hexagon, and UNICEF.
The report is available online at http://unglobalpulse.org/
The analysis and recommendations of this paper do not necessarily reflect the views of the United
Nations, or the Member States the United Nations. The views presented in this report are the sole
responsibility of its authors.
To provide feedback, comments or for general inquiries, please contact:
Global Pulse
370 Lexington Ave, Suite 1707
New York, New York 10017
E-mail: info@unglobalpulse.org
Web: www.unglobalpulse.org
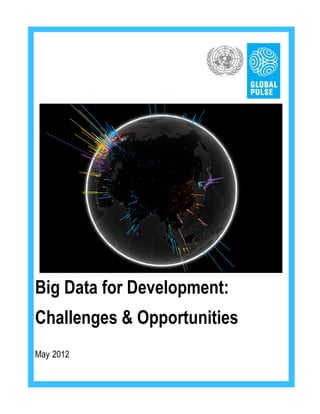
COVER ART: A visualization representing global Google search volume by language.
Developed by the Google Data Arts Team. http://data-arts.appspot.com/globe-search
2
3. About Global Pulse:
Global Pulse is a United Nations initiative, launched by the Secretary-General in 2009, to leverage
innovations in digital data, rapid data collection and analysis to help decision-makers gain a real-time
understanding of how crises impact vulnerable populations. Global Pulse functions as an innovation lab,
bringing together expertise from inside and outside the UN to harness today’s new world of digital data
and real-time analytics for global development. The initiative contributes to a future in which access to
better information sooner makes it possible to keep international development on track, protect the
world’s most vulnerable populations, and strengthen resilience to global shocks.
To this end, Global Pulse is pursuing a three-fold strategy that consists of 1) researching innovative
methods and techniques for analysing real-time digital data to detect early emerging vulnerabilities; 2)
assembling free and open source technology toolkit for analyzing real-time data and sharing hypotheses;
and 3) establishing an integrated, global network of Pulse Labs, anchored in Pulse Lab New York, to pilot
the approach at country level.
For more information please visit www.unglobalpulse.org.
3
4. Abstract
Innovations in technology and greater affordability of digital devices have presided over
today’s Age of Big Data, an umbrella term for the explosion in the quantity and diversity
of high frequency digital data. These data hold the potential—as yet largely untapped—
to allow decision makers to track development progress, improve social protection, and
understand where existing policies and programmes require adjustment.
Turning Big Data—call logs, mobile-banking transactions, online user-generated content
such as blog posts and Tweets, online searches, satellite images, etc.—into actionable
information requires using computational techniques to unveil trends and patterns within
and between these extremely large socioeconomic datasets. New insights gleaned from
such data mining should complement official statistics, survey data, and information
generated by Early Warning Systems, adding depth and nuances on human behaviours
and experiences—and doing so in real time, thereby narrowing both information and
time gaps.
With the promise come questions about the analytical value and thus policy relevance of
this data—including concerns over the relevance of the data in developing country
contexts, its representativeness, its reliability—as well as the overarching privacy issues
of utilising personal data. This paper does not offer a grand theory of technology-driven
social change in the Big Data era. Rather it aims to delineate the main concerns and
challenges raised by “Big Data for Development” as concretely and openly as possible,
and to suggest ways to address at least a few aspects of each.
It is important to recognise that Big Data and real-time analytics are no modern panacea
for age-old development challenges. That said, the diffusion of data science to the realm
of international development nevertheless constitutes a genuine opportunity to bring
powerful new tools to the fight against poverty, hunger and disease.
4
5. Table of Contents
INTRODUCTION .............................................................................................................................................. 6
SECTION 1: OPPORTUNITY .......................................................................................................................... 8
1.1. DATA INTENT AND CAPACITY .................................................................................................................. 8
The Data Revolution .............................................................................................................................. 8
Relevance to the Developing World .................................................................................................... 9
Intent in an Age of Growing Volatility ................................................................................................ 11
Big Data for Development: Getting Started....................................................................................... 13
Capacity: Big Data Analytics .............................................................................................................. 17
1.2 SOCIAL SCIENCE AND POLICY APPLICATIONS ......................................................................................... 19
A Growing Body of Evidence ............................................................................................................. 20
SECTION II: CHALLENGES ......................................................................................................................... 24
2.1 DATA..................................................................................................................................................... 24
Privacy .................................................................................................................................................. 24
Access and Sharing ............................................................................................................................ 25
2.2 ANALYSIS .............................................................................................................................................. 26
Getting the Picture Right .................................................................................................................... 27
Interpreting Data .................................................................................................................................. 29
Defining and Detecting Anomalies in Human Ecosystems ............................................................. 33
SECTION III: APPLICATION ......................................................................................................................... 35
3.1 WHAT NEW DATA STREAMS BRING TO THE TABLE ............................................................................. 35
Know Your Data ................................................................................................................................... 35
Applications of Big Data for Development ........................................................................................ 36
3.2. MAKING BIG DATA WORK FOR DEVELOPMENT ...................................................................................... 39
Contextualisation is Key ..................................................................................................................... 39
Becoming Sophisticated Users of Information................................................................................. 40
CONCLUDING REMARKS ON THE FUTURE OF BIG DATA FOR DEVELOPMENT ................................ 42
5
6. “The hope is that as you take the economic pulse in real time, you will be able to respond to anomalies more quickly.”
- Hal Varian, Google Chief Economist (Professor Emeritus, University of California, Berkeley)
Introduction
Since the turn of the century, innovations in technology and greater affordability of
digital devices have presided over the “Industrial Revolution of Data,”1 characterised by
an explosion in the quantity and diversity of real-timei digital data resulting from the
ever-increasing role of technology in our lives. As a result, we are “entering an
unprecedented period in history in terms of our ability to learn about human
behaviour.”2
What was a hypothesis only a few years ago is today being confirmed by researchers and
corporations, and has recently received significant coverage in the mainstream media3:
analysis of this new wealth of digital data—the massive and ever-expanding archive of
what we say and do using digital devices every day—may reveal remarkable insights into
the collective behaviour of communities. No less significantly, just as this data is
generated by people in real time, so it may now be analysed in real time by high
performance computing networks, thus creating at least the potential for improved
decision-making. It is time for the development community and policymakers around the
world to recognise and seize this historical opportunity to address twenty-first century
challenges, including the effects of global volatility, climate change, and demographic
shifts, with twenty-first century tools.
What exactly is the potential applicability of “Big Data for Development?” At the most
general level, properly analysed, these new data can provide
Big data for snapshots of the well-being of populations at high frequency, high
development is degrees of granularity, and from a wide range of angles, narrowing
both time and knowledge gaps. Practically, analysing this data may
about turning
help discover what Global Pulse has called “digital smoke
imperfect, signals”4—anomalous changes in how communities access
complex, often services, that may serve as proxy indicators of changes in
unstructured underlying well-being. Real-time awareness of the status of a
data into population and real-time feedback on the effectiveness of policy
actionable actions should in turn lead to a more agile and adaptive approach
information.
to international development, and ultimately, to greater resilience
and better outcomes.
Big Data for Development is about turning imperfect, complex, often unstructured data
into actionable information. This implies leveraging advanced computational tools (such
as machine learning), which have developed in other fields, to reveal trends and
correlations within and across large data sets that would otherwise remain undiscovered.
Above all, it requires human expertise and perspectives. Application of these approaches
to development raises great expectations, as well as questions and concerns, chief of
i
For the purposes of this paper, as discussed in Section 1.2, real time data is defined as “data that (1)
covers/is relevant to a relatively short and recent period of time—such as the average price of a commodity
over a few days rather than a few weeks, and (2) is made available within a timeframe that allows action to
be taken that may affect the conditions reflected in the data”. The definition of “real time” is contextual:
real time in the realm of fiber optics is not the same as in the realm of public policy.
6
7. which is the analytical value – and thus ultimately the policy relevance – of big data to
address development challenges.
These must be discussed in a very open manner to ensure that there are no
misunderstandings about what and how real-time data analytics can offer the field global
development, and what it cannot.
This paper outlines the opportunities and challenges, which have guided the United
Nations Global Pulse initiative since its inception in 2009. The paper builds on some of
the most recent findings in the field of data science, and findings from our own
collaborative research projects. It does not aim to cover the entire spectrum of challenges
nor to offer definitive answers to those it addresses, but to serve as a reference for further
reflection and discussion. The rest of this document is organised as follows: section one
lays out the vision that underpins Big Data for Development; section two discusses the
main challenges it raises; section three discusses its application. The concluding section
examines options and priorities for the future.
7
8. Section 1: Opportunity
1.1. Data Intent and Capacity
The Data Revolution
The world is experiencing a data revolution, or “data deluge” (Figure 1).5 Whereas in
previous generations, a relatively small volume of analog data was produced and made
available through a limited number of channels, today a massive amount of data is
regularly being generated and flowing from various sources, through different channels,
every minute in today’s Digital Age.6 It is the speed and frequency with which data is
emitted and transmitted on the one hand, and the rise in the number and variety of
sources from which it emanates on the other hand, that jointly constitute the data deluge.
The amount of available digital data at the global level grew from 150 exabytes in 2005
to 1200 exabytes in 2010.7 It is projected to increase by 40% annually in the next few
years, 8 which is about 40 times the much-debated growth of the world’s population.9
This rate of growth means that the stock of digital data is expected to increase 44 times
between 2007 and 2020, doubling every 20 months.ii
Figure 1: The Early Years of the Data Revolution
Source: The Economist, based on IDC data
ii
In September 2008, the “Jerusalem Declaration” stated: “We are entering the era of a high rate of
production of information of physical, biological, environmental, social and economic systems. The
recording, accessing, data mining and dissemination of this information affect in a crucial way the
progress of knowledge of mankind in the next years. Scientists should design, explore and validate
protocols for the access and use of this information able to maximize the access and freedom of research
and meanwhile protect and respect the private nature of part of it.”(..) “several scientific disciplines once
characterized by a low rate of data production have recently become disciplines with a huge rate of data
production. Today a huge amount of data easily accessible in electronic form is produced by both research
and, more generally, human activity.”
8
9. The revolution has various features and implications. The stock of available data gets
younger and younger, i.e. the share of data that is “less than a minute old” (or a day, or a
week, or any other time benchmark) rises by the minute.iii Further, a large and increasing
percentage of this data is both produced and made available real-time (which is a related
but different phenomenon).iv The nature of the information is also changing, notably with
the rise of social media and the spread of services offered via mobile phones. The bulk of
this information can be called “data exhaust,” in other words, “the digitally trackable or
storable actions, choices, and preferences that people generate as they go about their
daily lives.”10 At any point in time and space, such data may be available for thousands
of individuals, providing an opportunity to figuratively take the pulse of communities.
The significance of these features is worth re-emphasising: this revolution is extremely
recent (less than one decade old), extremely rapid (the growth is exponential), and
immensely consequential for society, perhaps especially for developing countries.
Relevance to the Developing World
The data revolution is not restricted to the industrialised world; it is also happening
in developing countries—and increasingly so. The spread of mobile-phone technology to
the hands of billions of individuals over the past decade might be the single most
significant change that has affected developing countries since the decolonisation
movement and the Green Revolution. Worldwide, there were over five billion mobile
phones in use in 2010, and of those, over 80% in developing countries. That number
continues to grow quickly, as analysts at the GSM Association/Wireless Intelligence
predict six billion connections worldwide by the middle of 2012. The trend is especially
impressive in Sub-Saharan Africa, where mobile phone technology has been used as a
substitute for usually weak telecommunication and transport infrastructure as well as
underdeveloped financial and banking systems.v
Across the developing world, mobile phones are routinely used not only for personal
communications, but also to transfer money, to search for work, to buy and sell goods, or
transfer data such as grades, test results, stock levels and prices of various commodities,
medical information, etc. (For example, popular mobile services such as Cell Bazaar in
Bangladesh allow customers to buy and sell products, SoukTel in the Middle East offers
an SMS-based job-matching service, and the M-PESA mobile-banking service in Kenya
allows individuals to make payments to banks, or to individuals.) In many instances,
mobile services have outpaced the growth and availability of their traditional
iii
As demographic theory shows, a population whose rate of growth has risen, as in the case of digital data,
will eventually get younger for several years, and the process will continue if the rate of growth continues
to increase; nonetheless a population of data will always be older than a population of humans subject to
the same birth rate because the life expectancy of digital data is much higher than that of any human
population.
iv
Conceptually, not all newly produced data is real-time data as defined above and in section 1.2. For
example, if all historical vital statistics records of the world were all of a sudden made available digitally,
these newly produced digital data would obviously not be real-time data. In practice, it is the case that a
large share of newly produced digital data tends to be high frequency.
v
For example, mobile phone penetration, measured by the number of mobile phones per 100 habitants, was
96% in Botswana, 63% in Ghana, 66% in Mauritania, 49% in Kenya, 47% in Nigeria, 44% in Angola, 40%
in Tanzania, etc. <http://www.google.com/fusiontables/Home/> (Source: Google Fusion Tables)
9
10. counterparts. According to Gavin Krugel, director of mobile banking strategy at GSM
Association, an industry group of 800+ wireless operators, “one billion consumers in the
world have a mobile phone but no access to a bank account”. 11 Further, “about 40
million people worldwide use mobile money, and the industry is growing. (...) Africa and
Asia are the most active regions right now [with] 18,000 new mobile banking users per
day in Uganda, 15,000 in Tanzania and 11,000 in Kenya.”
Other real-time information streams are also growing in developing regions. While
Internet traffic is expected to grow 25-30% between 2011 and 2015 in North America,
Western Europe and Japan, the figure is expected to reach or surpass 50% in Latin
America, the Middle East and Africa (Figure 2)12—and the bulk will come from mobile
devices. There has also been a rise in local call-in radio shows, information hotlines and
kiosks—such as Question Box or UNICEF’s “Digital Drum”vi—that allow populations in
remote areas to seek answers on issues ranging from agriculture, health, and education to
business advice and entertainment, providing a window on the interests and concerns of
information seekers whose location, age and gender are generally recorded.
The use of social media such as Facebook and Twitter is also growing rapidly; in
Senegal, for example, Facebook receives about 100,000 new users per month.13 Tracking
trends in online news or social media can provide information on emerging concerns and
patterns at the local level which can be highly relevant to global development.
Furthermore, programme participation metrics collected by UN agencies and other
development organisations providing services to vulnerable populations is another
promising source of real-time data, particularly in cases where there is an Information
and Communications Technology (ICT) component of service delivery and digital
records are generated.
Figure 2: Global Internet usage by 2015
Source: The Atlantic, “ Global Internet Traffic Expected to Quadruple by 2015.”
vi
Question Box is a pilot initiative that helps people find answers to everyday questions through hotlines,
SMS, and kiosks (http://questionbox.org/). UNICEF’s Digital Drum is a solar powered computer kiosk
(http://is.gd/gVepRP)
10
11. Although the data revolution is unfolding around the world in different ways and with
different speeds, the digital divide is closing faster than many had anticipated even a few
years ago. Furthermore, in countries with weak institutional capacities, the data
revolution may be especially relevant to supplement limited and often unreliable data.
Increasingly, Big Data is recognised as creating “new possibilities for international
development.”14 But data is a raw good that would be of little use without both “intent
and capacity”15 to make sense of it.
Intent in an Age of Growing Volatility
There is a general perception that our world has become more volatile, increasing the
risk of severe hardship for vulnerable communities. Fluctuations in economic
conditions—harvests, prices, employment, capital flows, etc.—are certainly not new, but
it seems that our global economic system may have become more prone to large and
swift swings in the past few years.
The most commonly mentioned drivers are financial and climatologic
By the time shocks in a context of greater interconnection.16 In the last five years
alone, a series of crises have unfolded17 with the food and fuel crisis
hard evidence
of 2007 to 2008 followed by the ‘Great Recession’ that started in
finds its way 2008. By the second half of 2011 the world economy entered yet
to the front another period of turmoil with a famine in the Horn of Africa and
pages of significant financial instability in Europe and the United States.
newspapers Global volatility is unlikely to abate: according to the OECD,
and the desks “[d]isruptive shocks to the global economy are likely to become more
frequent and cause greater economic and societal hardship. The
of decision
economic spill-over effect of events like the financial crisis or a
makers, it is potential pandemic will grow due to the increasing interconnectivity
often too late of the global economy and speed with which people, goods and data
or extremely travel”.18 For many households in developing countries, food price
expensive to volatility—even more than price spikes—is the most severe
respond. challenge.19
For all this interconnectivity, local impacts may not be
immediately visible and trackable, but may be both severe and long lasting. A rich
literature on vulnerability20 has highlighted the long-term impact of shocks on poor
communities. Children who are forced to drop out of school may never go back or catch
up; households forced to sell their productive assets or flee face a significant risk of
falling back or deeper into poverty; undernourished infants and foetuses exposed to acute
maternal malnutrition may never fully recover21—or worse die.22 These processes often
unfold beneath the radar of traditional monitoring systems. By the time hard evidence
finds its way to the front pages of newspapers and the desks of decision makers, it is
often too late or extremely expensive to respond. The main triggers will often be
known—a drought, rising temperatures, floods, a global oil or financial shock, armed
conflict—but even with sufficient macro-level contextual information it is hard to
distinguish which groups are affected, where, when, and how badly.
Policymakers have become increasingly aware of the costs of this growing volatility;
they know the simple fact that it is easier and less costly to prevent damages or to keep
11
12. them at a minimum than to reverse them. These arguments have been ringing in their ears
in recent years as the words volatility, vulnerability, fragility and austerity have made
headlines.
Various existing Early Warning Systemsvii do help raise flags in the international
community, but their coverage is limited (with a heavy focus on food security in rural
areas) and they are expensive to scale. Some are also plagued with design and
implementation problems.viii Survey data also provide important insights, but such data
takes time to be collected, processed, verified, and eventually published. Surveys are too
cumbersome and expensive to scale up to the point that they can function as an effective
and proactive solution. These “traditional data” (which, for the purpose of this paper,
refers to official statistics and survey data) will continue to generate relevant information,
but the digital data revolution presents a tremendous opportunity to gain richer, deeper
insights into human experience that can complement the development indicators that are
already collected.
Meanwhile, examples of the private sector successfully embracing Big Data analyticsix
and a growing volume of reports and discourse emphasising the promise of real-time
data, and “data-driven decision-making” forwarded by leading institutes, institutions and
media—from the World Economic Forum to the McKinsey Institute23 to the New York
Times—have begun to make their way into the public sector discourse.
Civil society organisations have also showed their eagerness to embrace more agile
approaches to leveraging real-time digital data. This is evidenced by the growing role of
‘crowdsourcing’x and other “participatory sensing”24 efforts bringing together
communities of practice and like-minded individuals through the use of mobile phones
and other platforms including Internet, hand-held radio, and geospatial technologies etc.xi
In many cases, these initiatives involve multiple partners from various fields in what
constitutes a novel way of doing business.
vii
A mapping conducted by Global Pulse found 39 such systems in operation in the UN system alone.
viii
Reasons include their focus on climate-related shocks as a criterion for geographical coverage, lack of
consistency of definitions, and lag in reporting. See in particular: WFP and UNICEF. Food and Nutrition
Security Monitoring and Analysis Systems: A Review of Five Countries (Madagascar, Malawi, Nepal, and
Zambia). Rep. UN Global Pulse, Dec, 2011. <http://www.unglobalpulse.org/projects/rivaf-research-study-
impact-global-economic-and-financial-crisis-vulnerable-people-five-cou>
ix
For example MIT Professor Erik Brynjolfsson’s research found significant differences in the data
payoff—a 5 percent gap in productivity considered to be a decisive advantage—enjoyed by companies
relying on “data-driven decision-making processes” on the one hand and those that continue to rely
primarily on “experience and intuition” on the other hand. Source: Lohr, Steve. “When There’s No Such
Ting as Too Much Information.” The New York Times. 23 Apr. 2011.
<http://www.nytimes.com/2011/04/24/business/24unboxed.html?_r=1&src=tptw>
x
The word “crowdsourcing” refers to the use of non-official actors (“the crowd”) as (free) sources of
information, knowledge and services, in reference and opposition to the commercial practice of
outsourcing. "
xi
Examples of such initiatives and approaches include Crisismappers, Ushahidi and participatory sensing.
For additional information details, see “Crisis Mappers Net—The international Network of Crisis
Mappers.” <http://crisismappers.net>, http://haiti.ushahidi.com and Goldman et al., 2009
12
13. Slowly, governments the world over are realising the power of Big Data. Some choose
conservative paths for managing the data deluge, involving crackdowns and strict
controls (which will likely prove unsustainable), while others will devise institutional
frameworks and support innovative initiatives, such as open data movements, that will
help leverage its power for the common good.xii
Finally, many other applications in the social sciences have also strengthened the case for
embracing Big Data for Development, as mentioned above and discussed in greater detail
below.
It is the double recognition of the promise of the data revolution and the need for better,
faster information in an age of growing global volatility that led the leaders of the G20
and the UN Secretary-General to call for the establishment of
the Global Pulse initiative (in the wake of the on-going …Big Data analytics
Global Economic Crisis), with the aim of developing of a
refers to tools and
new approach to “social impact monitoring” and behavioural
analysis by building on new sources of data and new methodologies that
analytical tools. aim to transform
massive quantities of
Beyond the availability of raw data alone, and beyond the
intent to utilize it, there needs to be capacity to understand raw data into “data
and use data effectively. In the words of Stanford Professor about data” – for
Andreas Weigend, “data is the new oil; like oil, it must be analytical purposes.
25
refined before it can be used.”
Big Data for Development: Getting Started
"Big Data" is a popular phrase used to describe a massive volume of both structured and
unstructured data that is so large that it's difficult to process with traditional database and
software techniques. The characteristics which broadly distinguish Big Data are
sometimes called the “3 V’s”: more volume, more variety and higher rates of velocity.
This data comes from everywhere: sensors used to gather climate information, posts to
social media sites, digital pictures and videos posted online, transaction records of online
purchases, and from cell phone GPS signals to name a few. This data is known as "Big
Data" because, as the term suggests, it is huge in both scope and power.
To illustrate how Big Data might be applicable to a development context, imagine a
hypothetical household living in the outskirts of a medium-size city a few hours
from the capital in a developing country. The head of household is a mechanic who
owns a small garage. His wife cultivates vegetables and raises a few sheep on their plot
of land as well as sews and sells drapes in town. They have four children aged 6 to 18.
Over the past couple of months, they have faced soaring commodity prices, particularly
food and fuel. Let us consider their options.
xii
Several governments, for example, have already taken significant steps to make government data open
and available for analysis and use. Countries from regions across the globe – from Kenya to Norway, Brazil
to South Korea, and international institutions like the World Bank – have begun adopting norms to
standardize and publish datasets. See “Open Data Sites.” < http://www.data.gov/opendatasites/> for a
sample of existing sites and datasets.
13
14. The couple could certainly reduce their expenses on food by switching to cheaper
alternatives, buying in bulk, or simply skipping meals. They could also get part of their
food at a nearby World Food Programme distribution center. To reduce other expenses,
the father could start working earlier in the morning in order to finish his day before
nightfall to lower his electricity bill. The mother could work longer hours and go to town
everyday to sell her drapes, rather than twice a week. They could also choose to top-off
their mobile phone SIM cards in smaller increments instead of purchasing credit in larger
sums and less-frequent intervals. The mother could withdraw from the savings
accumulated through a mobile phone-based banking service which she uses.
If things get worse they might be forced to sell pieces of the garage equipment or a few
sheep, or default on their microfinance loan repayment. They might opt to call relatives in
Europe for financial support. They might opt to temporarily take their youngest child out
of school to save on tuitions fees, school supplies and bus tickets. Over time, if the
situation does not improve, their younger children may show signs of anaemia, prompting
them to call a health hotline to seek advice, while their elder son might do online
searches, or vent about his frustration on social media at the local cybercafé. Local aid
workers and journalists may also report on increased hardships online.
Such a systemic—as opposed to idiosyncratic—shock will prompt dozens, hundreds
or thousands of households and individuals to react in roughly similar ways.26 Over
time, these collective changes in behaviour may show up in different digital data sources.
Take this series of hypothetical scenarios, for instance:
(1) The incumbent local mobile operator may see many subscribers shift from adding
an average denomination of $10 on their SIM-cards on the first day of the month
to a pattern of only topping off $1 every few days; The data may also show a
concomitant significant drop in calls and an increase in the use of text messages;
(2) Mobile banking service providers may notice that subscribers are depleting their
mobile money savings accounts; A few weeks into this trend, there may be an
increase in defaults on mobile repayments of microloans in larger numbers than
ever before;
(3) The following month, the carrier-supported mobile trading network might record
three times as many attempts to sell livestock as is typical for the season.
(4) Health hotlines might see increased volumes of calls reporting symptoms
consistent with the health impacts of malnutrition and unsafe water sources;
(5) Other sources may also pick up changes consistent with the scenario laid out
above. For example, the number of Tweets mentioning the difficulty to “afford
food” might begin to rise. Newspapers may be publishing stories about rising
infant mortality;
(6) Satellite imaging may show a decrease in the movement of cars and trucks
travelling in and out of the city’s largest market;
(7) WFP might record that it serves twice as many meals a day than it did during the
same period one year before. UNICEF also holds daily data that may indicate that
school attendance has dropped.
14
15. The list goes on.
This example touches on some of the opportunities available for harnessing the power of
real-time, digital data for development. But, let us delve a little deeper into what the
relevant characteristics, sources, and categories of Big Data, which could be useful for
global development in practice, might be.
Big Data for the purposes of development relates to, but differs from, both ‘traditional
development data’ (e.g. survey data, official statistics), and what the private sector and
mainstream media call ‘Big Data’ in a number of ways.
For example, microfinance data (e.g. number and characteristics of clients, loan amounts
and types, repayment defaults) falls somewhere between ‘traditional development data’
and ‘Big Data.’ It is similar to ‘traditional development data’ because the nature of the
information is important for development experts. Given the expansion of mobile and
online platforms for giving and receiving microloans means that today a large amount of
microfinance data is available digitally and can be analysed in real time, thus qualifying it
to be considered Big Data for Development.
At the other end of the spectrum, we might include Twitter data, mobile phone data,
online queries, etc. These types of data can firmly be called ‘Big Data’, as popularly
defined (massive amounts of digital data passively generated at high frequency). And,
while these streams of information may not have traditionally been used in the field of
development, but they could prove to be very useful indicators of human well-being.
Therefore, we would consider them to be relevant Big Data sources for development.
Big Data for Development sources generally share some or all of these features:
(1) Digitally generated – i.e. the data are created digitally (as opposed to being
digitised manually), and can be stored using a series of ones and zeros, and thus
can be manipulated by computers.
(2) Passively produced – a by product of our daily lives or interaction with digital
services
(3) Automatically collected – i.e. there is a system in place that extracts and stores
the relevant data as it is generated
(4) Geographically or temporally trackable – e.g. mobile phone location data or
call duration time.
(5) Continuously analysed – i.e. information is relevant to human well-being and
development and can be analysed in real-time
It is important to distinguish that for the purposes of global development, “real-time”
does not always mean occurring immediately. Rather, “real-time” can be understood as
information which is produced and made available in a relatively short and relevant
period of time, and information which is made available within a timeframe that allows
action to be taken in response i.e. creating a feedback loop.xiii Importantly, it is the
xiii
“A feedback loop involves four distinct stages. First comes the data: A behaviour must be measured,
captured and stored. This is the evidence stage. Second, the information must be relayed to the individual,
not in the raw-data form in which it was captured but in a context that makes it emotionally resonant. This
15
16. intrinsic time dimensionality of the data, and that of the feedback loop that jointly define
its characteristic as real-time. (One could also add that the real-time nature of the data is
ultimately contingent on the analysis being conducted in real-time, and by extension,
where action is required, used in real-time.)
With respect to spatial granularity, finer is not necessarily better. Village or community
level data may in some cases be preferable to household or individual level data because
it can provide richer insights and better protect privacy. As per the time dimensionality,
any immediacy benchmark is difficult to set precisely, and will become out-dated, as
higher frequency data are made available in greater volumes and with a higher degree of
immediacy in the next few years. It must also be noted that real-time is an attribute that
doesn’t last long: sooner or later, it becomes contextual, i.e. non-actionable data. These
include data made available on the spot about average rainfalls or prices, or phone calls
made over a relatively long period of time in the past (even a few months), as well as the
vast majority of official statistics—such as GDP, or employment data.
Without getting too caught up in semantics at length, it is important to recognise that Big
Data for Development is an evolving and expanding universe best conceptualised in
terms of continuum and relativeness.
For purposes of discussion, Global Pulse has developed a loose taxonomy of types of
new, digital data sources that are relevant to global development:
(1) Data Exhaust – passively collected transactional data from people’s use of digital
services like mobile phones, purchases, web searches, etc., and/or operational
metrics and other real-time data collected by UN agencies, NGOs and other aid
organisations to monitor their projects and programmes (e.g. stock levels, school
attendance); these digital services create networked sensors of human behaviour;
(2) Online Information – web content such as news media and social media
interactions (e.g. blogs, Twitter), news articles obituaries, e-commerce, job
postings; this approach considers web usage and content as a sensor of human
intent, sentiments, perceptions, and want.
(3) Physical Sensors – satellite or infrared imagery of changing landscapes, traffic
patterns, light emissions, urban development and topographic changes, etc; this
approach focuses on remote sensing of changes in human activity
(4) Citizen Reporting or Crowd-sourced Data – Information actively produced or
submitted by citizens through mobile phone-based surveys, hotlines, user-
generated maps, etc; While not passively produced, this is a key information
source for verification and feedback
is the relevance stage. But even compelling information is useless if we don’t know what to make of it, so
we need a third stage: consequence. The information must illuminate one or more paths ahead. And finally,
the fourth stage: action. There must be a clear moment when the individual can recalibrate a behaviour,
make a choice and act. Then that action is measured, and the feedback loop can run once more, every
action stimulating new behaviours that inch us closer to our goals.” Goetz, Thomas. “Harnessing the Power
of Feedback Loops.” Wired.com. Conde Nast Digital, 19 June 2011.
<http://www.wired.com/magazine/2011/06/ff_feedbackloop/all/1>.
16
17. Yet another perspective breaks down the types of data that might be relevant to
international development by how it is produced or made available: by individuals, by the
public/development sector, or by the private sector (Figure 3).
Figure 3: “Understanding the Dynamics of the Data Ecosystem”
The new data ecosystem, as illustrated by the World Economic Forum, which we are in today includes
various data types, incentives, and requirements of actors. Source: WEF White Paper, “Big Data, Big
Impact: New Possibilities for International Development”
http://www3.weforum.org/docs/WEF_TC_MFS_BigDataBigImpact_Briefing_2012.pdf
Capacity: Big Data Analytics
The expansion of technical capacity to make sense of Big Data in various sectors and
academia abounds. Initially developed in such fields as computational biology,
biomedical engineering, medicine, and electronics, Big Data analytics refers to tools and
methodologies that aim to transform massive quantities of raw data into “data about the
data”—for analytical purposes. They typically rely on powerful algorithms that are able
to detect patterns, trends, and correlations over various time horizons in the data, but also
on advanced visualization techniques as “sense-making tools.”27 Once trained (which
involves having training data), algorithms can help make predictions that can be used to
detect anomalies in the form of large deviations from the expected trends or relations in
the data.
Discovering patterns and trends in the data from the observation and juxtaposition of
different kinds of information requires defining a common framework for information
processing. At minimum, there needs to be a simple lexicon that will help tag each
datum. This lexicon would specify the following:
(1) What: i.e. the type of information contained in the data,
17
18. (2) Who: the observer or reporter,
(3) How: the channel through which the data was acquired,
(4) How much: whether the data is quantitative or qualitative,
(5) Where and when: the spatio-temporal granularity of the data—i.e. the level of
geographic disaggregation (province, village, or household) and the interval at
which data is collected.
Then, the data that will eventually lend itself to analysis needs to be adequately prepared.
This step may include:
(1) Filtering—i.e. keeping instances and observations of relevance and getting rid of
irrelevant pieces of information
(2) Summarising—i.e. extracting keyword or set of keywords from a text
(3) Categorising, and/or turning the raw data into an appropriate set of indicators—
i.e. assigning a qualitative attribute to each observation when relevant—such as
‘negative’ vs. ‘positive’ comments, for instance. Yet another option is simply to
calculate indicators from quantitative data such as growth rates of price indices
(i.e. inflation).
Once the data is ready to be analysed, data analytics per se imply letting powerful
algorithms and computational tools dive into the data. A characteristic of these
algorithms is their ability to adapt their parameters in response to new streams of data by
creating algorithms of their own to take care of parts of the data. This is necessary
because these advanced models—non-linear models with many heterogeneous interacting
elements—require more data to calibrate them with a data-driven approach.28
This intensive mining of socioeconomic data, known as “reality mining,”29 can shed light
on processes and interactions in the data that would not have appeared otherwise. Reality
mining can be done in three main ways:42
(1) “Continuous data analysis over streaming data,” using tools to scrape the Web to
monitor and analyse high-frequency online data streams, including uncertain,
inexact data. Examples include systematically gathering online product prices in
real-time for analysis.
(2) “Online digestion of semi-structured data and unstructured ones” such as news
items, product reviews etc., to shed light on hot topics, perceptions, needs and
wants.
(3) “Real-time correlation of streaming data (fast stream) with slowly accessible
historical data repositories.” This terminology refers to “mechanisms for
correlating and integrating real-time (fast streams) with historical records…in
order to deliver a contextualised and personalised information space [that adds]
considerable value to the data, by providing (historical) context to new data.”30
Big Data for Development could use all three techniques to various degrees depending on
the availability of data and the specific needs.
Further, an important feature of Big Data analytics is the role of visualisation, which can
provide new perspectives on findings that would otherwise be difficult to grasp. For
example, “word clouds” (Figure 4), which are a set of words that have appeared in a
certain body of text – such as blogs, news articles or speeches, for example – are a simple
18
19. and common example of the use of visualisation, or “information design,” to unearth
trends and convey information contained in a dataset, but there exist many alternatives to
word clouds (Figure 5).xiv
Figure 4: A word cloud of this paper
Source: The full text of this paper; world cloud created using www.Wordle.net
Figure 5: Data Visualization of the Global Legal Timber Trade
Graphic designer Paul Butt created a data visualization that shows the top five timber exporting countries
of the world, and maps out the countries to which the timber is sold, and at what cost.
Source: http://awesome.good.is/transparency/web/1102/timber-trade/flat.html
xiv
Global Pulse has been working with the global community, Vizualizing.org to explore different styles
and methods for data visualization and information design. See “Data Channels, UN Global Pulse.”
<http://www.visualizing.org/data/channels/un-global-pulse.>
19
20. 1.2 Social Science and Policy Applications
A Growing Body of Evidence
There is already evidence of the power of data analytics beyond the fields of hard
sciences and business. In the field of social science and public policy it is the predictive
power of the data that has attracted the most attention, as academic teams across the
world are discovering the insights on human behaviour that can be gleaned from these
data.
For example, a team of physicists from Northeastern University conducted a study in
which they were able to predict, with over 93% accuracy, where a person is physically
located at any given time based on analysis of cell-phone information generated from
their past movements.31 Another two-year research effort provided evidence of the power
of mobile phones as sensors and predictors of human behaviour, prompting the academic
Dr. Alex Pentland of the Massachusetts Institute of Technology, who led the initiative, to
conclude: “phones can know.”32 Mobile phones give researchers the ability to “quantify
human movement on a scale that wasn’t possible before,” including to “detect changes
from standard commuting patterns” based on their radius of gyration after losing a job. 33
It has also been found that a country’s GDP could be estimated in real time by measuring
light emissions at night through remote sensing.34
Another well-known example is Google Flu Trends, a tool launched in 2008 based on the
prevalence of Google queries for flu-like symptoms. A research paper35 found that
“because the relative frequency of certain queries is highly correlated with the
percentage of physician visits in which a patient presents with influenza-like symptoms,”
it was possible to “accurately estimate the current level of weekly influenza activity in
each region of the United States, with a reporting lag of about one day.” The conclusion
was that it is “possible to use search queries to detect influenza epidemics in areas with a
large population of web search users.” When applied to public health, online data has
been used as part of syndromic surveillance efforts also known as infodemiology.36
According to the US Center for Disease Control and Prevention (CDC), mining vast
quantities of health-related online data can help detect disease outbreaks “before
confirmed diagnoses or laboratory confirmation.”37 Google Dengue Trends works in the
exact same way, and has shown similar promise (Figure 6).
20
21. Figure 6: Screen Shot of Google Dengue Trend Website
Source: http://www.google.org/denguetrends/about/how.html
Twitter may serve a similar purpose. Computer scientists at John Hopkins University
analysed over 1.6 million health-related tweets (out of over 2 billion) posted in the US
between May 2009 and October 2010 using a sophisticated proprietary algorithm and
found a 0.958 correlation between the flu rate they modelled based on their data and the
official flu rate (Figure 7).38
The prevalence and spread of other types of health conditions and ailments in a
community can also be analysed via Twitter data, including obesity and cancer.39
Information about Twitter users' location that they provide publicly can be used to study
the geographic spread of a disease or virus, as evidenced by a study of the H1N1
epidemic in the US.40
21
22. Figure 7: Twitter-based vs. Official Influenza Rate in the U.S.
!
Source: « You Are What You Tweet: Analyzing Twitter for Public Health. M. J. Paul and M. Dredze,
2011. http://www.cs.jhu.edu/%7Empaul/files/2011.icwsm.twitter_health.pdf
Note: “Influenza rate from August 2009 to October 2010 as measured by CDC FluView (measured as
percentage of specimen’s that tested positive for influenza) and ATAM+’s “flu” ailment (the normalised
probability of the “flu” ailment given the week): correlation coefficient of 0.958.” (p. 4)
Another application for which Twitter is especially suited is to provide richer information
on health-related behaviours, perceptions, concerns, and beliefs. Important sociological
insights were gleaned from the John Hopkins study. These included detailed information
about the use and misuse of medication (such as self-prescribed antibiotics to treat the
flu, which are by nature irrelevant, and other over-the-counter misuse) and exercise
routines among various socioeconomic groups—relevant for both research and policy.
Still in the realm of social media, a study showed that Facebook updates, photos and
posts could help identify drinking problems among college students, a major public
health concern.41 An important difference between Twitter and Facebook is, of course,
the fact that the latter is a closed network, whereas the vast majority of tweets are public,
thus theoretically (but not necessarily) accessible for analysis.
Other data streams can also be brought in or layered against social media data, notably to
provide geographical information: the Healthmap project, for example, compiles
disparate data from online news, eyewitness reports and expert-curated discussions, as
well as validated official reports, to “achieve a unified and comprehensive view of the
current global state of infectious diseases” that can be visualised on a map.42 In the
words of one of its creators, “[i]t’s really taking the local-weather forecast idea and
22
23. making it applicable to disease.”43 This may help communities prepare for outbreaks as
they do for storms.
Another example of the use of new data for policy purposes was Ushahidi’sxv use of
crowdsourcing following the earthquake that devastated Haiti, where a centralised text
messaging system was set up to allow cell-phone users to report on people trapped under
damaged buildings. Analysis of the data found that the concentration of aggregated text
messages was highly correlated with areas where the damaged buildings were
concentrated.xvi According to Ushahidi’s Patrick Meier these results were evidence of the
system’s ability to “predict, with surprisingly high accuracy and statistical significance,
the location and extent of structural damage post-earthquake."
This section has aimed to illustrate how leveraging Big Data for Development can reduce
human inputs and time-lags in production, collection, and transmission of information,
and allow for more onus to be placed on analysis and interpretation, and making
informed and effective evidence-based decisions from the data.
With all this available data, a growing body of evidence, and all the existing
technological and analytical capacity to use it, the question must be asked: why hasn’t
Big Data for Development taken hold as a common practice ?
The answer is because it is not easy. Section 2 turns to the challenges with using Big Data
for Development.
xv
Ushahidi is a nonprofit tech company that was developed to map reports of violence in Kenya following
the 2007 post-election fallout. Ushahidi specializes in developing “free and open source software for
information collection, visualization and interactive mapping.” <http://ushahidi.com>
xvi
Conducted by the European Commission's Joint Research Center against data on damaged buildings
collected by the World Bank and the UN from satellite images through spatial statistical techniques.
23
24. Section II: Challenges
Applying Big Data analytics to the fuel of development faces several challenges. Some
relate to the data—including its acquisition and sharing, and the overarching concern
over privacy. Others pertain to its analysis. This section discusses the most salient of the
challenges (recognising that there are others).
2.1 Data
Privacy
Privacy is the most sensitive issue, with conceptual, legal, and technological
implications. In its narrow sense, privacy is defined by the International
Telecommunications Union as the “right of individuals to control or influence what
information related to them may be disclosed.” Privacy can also be understood in a
broader sense as encompassing that of companies
Because privacy is a pillar of wishing to protect their competitiveness and
democracy, we must remain consumers and states eager to preserve their
alert to the possibility that it sovereignty and citizens. In both these
might be compromised by the interpretations, privacy is an overarching concern
that has a wide range of implications for anyone
rise of new technologies, and put
wishing to explore the use of Big Data for
in place all necessary safeguards. development—vis-à-vis data acquisition, storage,
retention, use and presentation.
Privacy is a fundamental human right that has both intrinsic and instrumental values. Two
authors, Helbing and Balietti44, stress the necessity to ensure an appropriate level of
privacy for individuals, companies and societies at large. In their words, “a modern
society needs [privacy] in order to flourish.”45 Without privacy, safety, diversity,
pluralism, innovation, our basic freedoms are at risk. Importantly, these risks concern
even individuals who have “nothing to hide.”46 There is no need to expand at length on
the importance and sensitivity of information for corporations and states.
Focusing on individual privacy, it is likely that, in many cases, the primary producers—
i.e. the users of services and devices generating data—are unaware that they are doing so,
and/or what it can be used for. For example, people routinely consent to the collection
and use of web-generated data by simply ticking a box without fully realising how their
data might be used or misused.47 It is also unclear whether bloggers and Twitter users, for
instance, actually consent to their data being analysed.48 In addition, recent research
showing that it was possible to ‘de-anonymise’ previously anonymised datasets raises
concerns.49
The wealth of individual-level information that Google, Facebook, and a few mobile
phone and credit card companies would jointly hold if they ever were to pool their
information is in itself concerning. Because privacy is a pillar of democracy, we must
remain alert to the possibility that it might be compromised by the rise of new
24
25. technologies, and put in place all necessary safeguards.
Access and Sharing
Although much of the publicly available online data (data from the “open web”) has
potential value for development, there is a great deal more valuable data that is
closely held by corporations and is not accessible for the purposes described in this
paper. One challenge is the reluctance of private companies and other institutions to
share data about their clients and users, as well as about their own operations. Obstacles
may include legal or reputational considerations, a need to protect their competitiveness,
a culture of secrecy, and, more broadly, the absence of the right incentive and
information structures. There are also institutional and technical challenges—when data
is stored in places and ways that make it difficult to be accessed, transferred, etc. (For
example, MIT professor Nathan Eagle often anecdotally describes how he spent weeks in
the basements of mobile-phone companies in Africa searching through hundreds of boxes
filled with magnetic back-up tapes to gather data. An Indonesian mobile carrier estimated
that it would take up to half a day of work to extract one day’s worth of backup data
currently stored on magnetic tapes.50) Even within the UN system it can prove difficult to
get agencies to share their programme data, for a combination of some or all of reasons
listed above.
Engaging with appropriate partners in the public and private sectors to access non-public
data entails putting in place non-trivial legal arrangements in order to secure (1) reliable
access to data streams and (2) get access to back up data for retrospective analysis and
data training purposes. There are other technical challenges of inter-comparability of data
and inter-operability of systems, but these might be relatively less problematic to deal
with than getting formal access or agreement on licensing issues around data.
For Big Data for Development to gain traction, these are serious, make-or-break
challenges. Any initiative in the field ought to fully recognise the salience of the privacy
issues and the importance of handling data in ways that ensure that privacy is not
compromised. These concerns must nurture and shape on-going debates around data
privacy in the digital age in a constructive manner in order to devise strong principles and
strict rules—backed by adequate tools and systems—to ensure “privacy-preserving
analysis.”51
At the same time, the promise will not be fulfilled if institutions—primarily private
corporations—refuse to share data altogether. In light of these necessities, Global Pulse,
for instance, is putting forth the concept of “data philanthropy,”52 whereby
“corporations [would] take the initiative to anonymize (strip out all personal
information) their data sets and provide this data to social innovators to mine the data
for insights, patterns and trends in realtime or near realtime.”53 Whether the concept of
data philanthropy takes hold or not, it certainly points to the challenges and avenues for
consideration in the future (Figure 8), and we can expect to see further refinements and
alternative models proposed for how to deal with privacy, and data share.
25
26. Figure 8: Future challenges for social science data
!
Source: “Ensuring the Data-Rich Future of the Social Sciences”. Gary King, Science Magazine, Vol. 331,
11 February 2011.
http://gking.harvard.edu/files/datarich.pdf
2.2 Analysis
Working with new data sources brings about a number of analytical challenges. The
relevance and severity of those challenges will vary depending on the type of analysis
being conducted, and on the type of decisions that the data might eventually inform. The
question “what is the data really telling us?” is at the core of any social science research
and evidence-based policymaking, but there is a general perception that “new” digital
data sources poses specific, more acute challenges. It is thus essential that these concerns
be spelled out in a fully transparent manner. The challenges are intertwined and difficult
to consider in isolation, but for the sake of clarity, they can be split into three distinct
categories: (1) getting the picture right, i.e. summarising the data (2) interpreting, or
making sense of the data through inferences, and (3) defining and detecting anomalies.54
26
27. Getting the Picture Right
One is reminded of Plato’s allegory of the cave: the data, as the shadows of objects
passing in front of the fire, is all the analyst sees.55 But how accurate a reflection is the
data? Sometimes the data might simply be false, fabricated.
For example, unverified citizen reporters or bloggers could be publishing false
information.xvii Individuals speaking under their actual identity—citizen reporters,
bloggers, even journalists—may also fabricate or falsify facts. External actors or factors
might interfere in ways that could make data paint a misleading picture of reality. For
example, “if SMS streams are used to try to measure public violence […] the
perpetrators will be actively trying to suppress reporting, and so the SMS streams will
not just measure where the cell phones are, they'll measure where the cell phones that
perpetrators can't suppress are. We'll have many more "false negative”xviii zones where
there seems to be no violence, but there's simply no SMS traffic. And we'll have dense,
highly duplicated reports of visible events where there are many observers and little
attempt to suppress texting.”56 In all of these cases there is a willingness to alter the
perception of reality that the observer will get out of the data. This challenge is probably
most salient with unstructured user-generated text-based data (such as blogs, news, social
media messages, etc.) because of its relatively more spontaneous nature and looser
verification steps.
In addition, a significant share of the new, digital data sources which make up Big Data
are derived from people’s own perceptions—information extracted from calls to health
hotlines and online searches for symptoms of diseases, for example. Perceptions differ
from feelings in that they are supposed to convey objective facts—such as health
symptoms. But perceptions can be inaccurate and thus misleading.
A good example is Google Flu Trends, whose ability to “detect influenza epidemics in
areas with a large population of web search users” was previously discussed. A team of
medical experts compared data from Google Flu Trends from 2003 to 2008 with data
from two distinct surveillance networksxix and found that while Google Flu Trends did a
very good job at predicting nonspecific respiratory illnesses (bad colds and other
xvii
For example, Tom MacMaster, a Scotland-based heterosexual male caused quite the controversy during
the 2011 Arab Spring when he regularly posted blogposts on the web in the persona of a lesbian woman in
Syria. The blog, “A Gay Girl in Damascus,” managed to gather a growing following as MacMaster
published regularly between February and June, until it was revealed that the blog was a hoax. The incident
raised or intensified concerns about unverified user-generated information. While Tom MacMaster claimed
he used the hypothetical persona to try to illuminate the events in the Middle East for a western audience,
any reader would have been ultimately relying on fabricated information. Addley, Esther. “Syrian lesbian
blogger is revealed conclusively to be a married man.” The Guardian. 12 Jun. 2011
<http://www.guardian.co.uk/world/2011/jun/13/syrian-lesbian-blogger-tom-macmaster>
xviii
False negatives refer to cases where some event of interest fails to be noticed.
xix
The CDC's influenza-like-illness surveillance network reporting the proportion of people who visit a
physician with flu-like symptoms (fever, fatigue and cough) and the CDC's virologic surveillance system
reporting on the proportion of people who visit a physician and actually have lab-confirmed influenza Liu,
Bing “Sentiment Analysis and Subjectivity.” Handbook of Natural Language Processing 2 (2010): 1-38.
Department of Computer Science at the University of Illinois at Chicago.
<http://www.cs.uic.edu/~liub/FBS/NLP-handbook-sentiment-analysis.pdf>
27
28. infections like SARS) that seem like the flu, it did not predict actual flu very well. The
mismatch was due to the presence of infections causing symptoms that resemble those of
influenza, and the fact that influenza is not always associated with influenza-like
symptoms. According to one of the researchers, “[t]his year, up to 40% of people with
pandemic flu did not have ‘influenza-like illness’ because they did not have a fever (…)
Influenza-like illness is neither sensitive nor specific for influenza virus activity—it's a
good proxy, it's a very useful public-health surveillance system, but it is not as accurate
as actual nationwide specimens positive for influenza virus." This mismatch may have
important policy implications. Doctors using Google Flu Trends may overstock on flu
vaccines or be inclined to conclude that the flu-like symptoms of their patients are
attributable to influenza, even when they are not. Similar caveats apply to the analysis of
Tweets or calls to health hotlines.
Another challenge relates to sentiment analysis (or opinion mining). The term refers to
“the computational study of opinions, sentiments and emotions expressed in text”57 that
aims at “translating the vagaries of human emotion into hard data.”58 Scraping blogs and
other social media content has become a common undertaking of corporations and
academic researchers. Sentiment analysis aims at finding out and quantifying whether,
how many, and how strongly people are happy vs. unhappy, pessimistic vs. optimistic,
what they like or dislike, support or reject, fear or look forward to something—and any
“shades of grey” in between.
Difficulties in conducting sentiment analysis can be organised in various ways.59 One
perspective distinguishes challenges related to “conceptualisation” (i.e. defining
categories, clusters), “measurement” (i.e. assigning categories and clusters to
unstructured data, or vice-versa) and “verification” (i.e. assess how well steps 1 and 2
fare in extracting relevant information). Another focuses on the main challenges of
selecting “target documents,” “identifying the overall sentiment expressed” in the target
documents, and lastly “present[ing] these sentiments […] in some reasonable summary
fashion.”xx
Overall, the fundamental challenge is getting to the true intent of a statement, in terms of
polarity, intensity, etc. Many obstacles may impede this, from the use of slang, local
dialect, sarcasm, hyperboles, and irony, to the absence of any key words. These are, in a
sense, technical or measurement challenges that become easier to handle as the degree of
sophistication of sentiment analysis algorithms improves. But the conceptualisation and
classification phase of any analysis which is to be conducted is non-trivial. This implies
deciding, for instance, whether what matters is frequency or presence of key word(s).
Thus, the human analyst’s input is critical. Classification is “one of the most central and
generic of all our conceptual exercises. […] Without classification, there could be no
advanced conceptualization, reasoning, language, data analysis, or, for that matter,
social science research.”60
xx
Options considered include “(a) aggregation of “votes” that may be registered on different scales (e.g.,
one reviewer uses a star system, but another uses letter grades), (b) selective highlighting of some opinions
(c) representation of points of disagreement and points of consensus (d) identification of communities of
opinion holders (e) accounting for different levels of authority among opinion holders.” (Source: Pang and
Lee, 2008.)
28
29. Text mining goes beyond sentiment analysis to the extraction of key words or events. It
may involve scraping websites for facts such as deaths, job announcements or losses,
foreclosures, weddings, and financial difficulties, etc. The difficulty here, again, is
extracting the true significance of the statements in which these facts are reported. For
example, if our hypothetical couple’s son reports having lost “a” job (possibly out of two
or more), it is different from having lost one’s only job (just like losing a part-time job is
different from losing a full-time job). Text mining may also involve looking for trending
topics in online news and other publications. This type of analyses—text categorisation—
is technically relatively easier to conduct, but aggregating topics within larger clusters
also requires inputs from the analyst.
A somewhat different problem is the fact that a significant share of new, digital data
sources are based on expressed intentions as revealed through blogposts, online searches,
or mobile-phone based information systems for checking market prices, etc., which may
be a poor indicator of actual intentions and ultimate decisions. An individual searching
for information about or discussing “moving to the UK” may have no intention of
moving to the UK at all, or may not follow through on his/her intentions even if he or she
initially did.
These examples are meant to illustrate just some of the difficulties in summarising facts
from user-generated text; the line between reported feelings and facts may not be as easy
to distinguish as it may seem—because “facts all come with points of view.”61 With an
understanding of the kinds of issues related to the ‘accuracy’ of the variety of new digital
data sources that make up “Big Data,” let us now turn to the challenge of interpretation.
Interpreting Data
In contrast to user-generated text, as described in the section above, some digital data
sources—transactional records, such as the number of microfinance loan defaults,
number of text messages sent, or number of mobile-phone based food vouchers
activated—are as close as it gets to indisputable, hard data. But whether or not the data
under consideration is thought to be accurate, interpreting it is never straightforward.
A frequently voiced concern is the sampling selection bias, i.e. the fact that the people
who use mobile or other digital services (and thus generate the real-time digital data
being considered for analysis) are not a representative sample of the larger population
considered. Cell-phones, computers, food vouchers, or microfinance products, are neither
used at random nor used by the entire population. Depending on the type of data, one can
expect younger or older, wealthier or poorer, more males than females, and educated or
uneducated individuals, to account for a disproportionate share of producers.xxi
For instance, “[c]hances are that older adults are not searching in Google in the same
proportion as a younger, more Internet-bound, generation."62It is the combination of the
self-selection of individuals with specific attributes and the fact that these attributes affect
xxi
Note that the fact that some respondents in a representative sample may yield more data points than
others does not jeopardize the representativeness of the sample—once will simply infer that the same
behavior will appear in the larger population within which the sample was drawn.
29
30. their behaviours in other ways that causes the bias.xxii There are other practical reasons
why the sample may be non-representative. For example, it could be that only data for
one mobile phone companies is available for analysis. The resulting sample will most
likely be non-representative of either the population of mobile-phone holders or of the
population of the area. More traditional datasets are generally less subject to such a
bias.xxiii
The problem with findings based on non-representative samples is that they lack external
validity.xxiv They cannot be generalised beyond the sample. Suppose that, in the village
where our hypothetical household lives, the number of cases of cholera reported through
a mobile-phone hotline doubles in a week following a rise in temperature. Because the
sample is not representative—since individuals using cell-phones tend to have specific
characteristics—one cannot infer that there are twice as many cases of cholera in the
entire community,xxv nor that in general a rise in temperature leads to more cases of
cholera. But while findings based on non-representative datasets need to be treated with
caution, they are not valueless—as discussed in section three.
Further, with massive quantities of data there is a risk of focusing exclusively on finding
patterns or correlations and subsequently rushing to judgements without a solid
understanding of the deeper dynamics at play. Such a wealth of data “tempts some
researchers to believe that they can see everything at a 30,000-foot view. It is the kind of
data that encourages the practice of apophenia: seeing patterns where none actually
exist, simply because massive quantities of data can offer connections that radiate in all
directions.”63 It also “intensifies the search for interesting correlations”64, which might
be (mis)interpreted as causal relationships.
The latter tendency is problematic with any type of data, but new data sources—
xxii
Importantly, the sampling bias issue is only about the sample—i.e. the individuals who are observed—
not about the type or number of ‘data’ they generate. Some individuals may generate many more
observations (such as phone calls, or visits to clinics) than others but as long as the difference is not due to
any other measurement problems—and the sample is representative—the data is unbiased.
xxiii
This can be avoided in one of three ways: one is obviously to ensure complete coverage of the unit of
analysis, another is to observe or survey individuals truly at random on a sufficiently–large scale. For
instance, random samples can be constructed using a computer that ‘picks up’ some individual specific
numbers at random and a (less rigorous way) third way is to purposefully ‘build’ a representative sample
ex-ante or ex-post. The latter technique is used by pollsters who ‘redress’ the results obtained from a
sample thought to be non-representative by using ‘weights’
xxiv
The term ‘validity’ refers to the degree to which a conclusion or inference accurately describes a real-
world process. It is standard to contrast internal versus external validity. The former refers to “the
approximate truth about inferences regarding cause-effect or causal relationships.” In other words, the
extent to which a study demonstrates the existence of a causal relationship. The latter refers to the degree to
which an internally valid conclusion can be generalised to a different setting. A causal relationship is
different from a causal effect, which is the quantifiable difference between two potential outcomes if some
initial condition changed. For the purposes of this paper, internal validity is understood to encompass the
extent to which the existence of some recurrent pattern in the data—a stylised fact, a correlation—can be
established. (Sources: King, Gary and Powell, Eleanor. “How Not to Lie Without Statistics.” Harvard
University. National Science Foundation (2008) <http://gking.harvard.edu/files/mist.pdf>) and “Internal
Validity.” Research Methods Knowledge Base. <http://www.socialresearchmethods.net/kb/intval.php>)
xxv
Some may treat this as an internal validity problem but it is only because they wrongfully confound the
sample and the larger unit of analysis it is drawn from.
30
31. particularly social media, crowd-sourced information, or other user-created content—may
pose specific challenges. Considering the claims of Ushahidi in Haiti after the
earthquake. A prominent ICT4D blogger, Jim Fruchterman65 discussed the problems with
drawing the types of conclusions that Ushahidi’s staff had drawn on the basis of crowd-
reported information. As he explains:
[t]he correlation found in Haiti is an example of a "confounding factor." A
correlation was found between building damage and SMS streams, but only
because both were correlated with the simple existence of buildings. Thus the
correlation between the SMS feed and the building damage is
an artifact or spurious correlation…once you control for the presence of any
buildings (damaged or undamaged), the text message stream seems to have a
weak negative correlation with the presence of damaged buildings. That is, the
presence of text messages suggests there are fewer (not more) damaged buildings
in a particular area.xxvi
According to Fruchterman and his colleagues, the Ushahidi system’s apparent ability to
“predict (…) the location and extent of structural damage post-earthquake” simply
reflected this spurious correlation, which was so strong that it more than offset the actual
negative correlation between the number of SMS text messages and the damages.xxvii
Why was that correlation negative? “It may be that people move away from damaged
buildings (perhaps to places where humanitarian assistance is being given) before
texting.” This would explain, all other things being equal, the underreporting of damages
in places worst hit.
Importantly, this example actually illustrates two very different analytical issues. One is
the presence of a confounding factor.xxviii But higher mortality or departure from the zone
of interest is a problem of attrition, a form of selection bias (not related to the initial
sample) that undermines internal validity (not external as in the case of a sampling bias).
There are many other cases where correlations should not be misinterpreted as
causations. Google Correlate, for example, is a tool that helps identify best-fit
correlations between two sets of terms in online searches patterns. Playing with the tool
revealed a 0.9 (90%) fit between the terms “weight gain” and “apartments for rent” in US
xxvi
Jim Fruchterman provided two additional examples of spurious correlations are their implications for
policy: “Children's reading skill is strongly correlated with their shoe size -- because older kids have
bigger feet and tend to read better. You wouldn't measure all the shoes in a classroom to evaluate the kids'
reading ability. Locations with high rates of drowning deaths are correlated with locations with high rates
of ice cream sales because people tend to eat ice cream and swim when they're at leisure in hot places with
water, like swimming pools and seasides. If we care about preventing drowning deaths, we don't set up a
system to monitor ice cream vendors.”
xxvii
In other words, when the number of buildings was not controlled for, its effect was then picked up by
(added to) the effect the number of texts from or about these buildings, turning the ‘true’ negative
correlation into an overall strong, statistically significant positive correlation.
xxviii
Clearly, this is not a sampling bias problem, because the dependent variable (the number of buildings
that actually collapsed) is observed for all observations in the data, not just for a sample. At the same time,
the realization that internal validity—i.e. the ability to infer the existence of a causal relation—is
compromised does prevent generalization—i.e. negates the possibility of external validity: internal validity
is a necessary but insufficient condition of external validity.
31
32. searches since 2004 (Figure 9). It is unclear how one could cause the other.
Figure 9: Correlation Does Not Mean Causation
Source: Google Correlate
The problems highlighted here can have serious policy implications since
“[m]isunderstanding relationships in data (…) can lead to choosing less effective, more
expensive data instead of choosing obvious, more accurate starting points.” In the
Ushahidi case, Fruchterman argued, “if decision makers simply had a map [of pre-
earthquake buildings] they could have made better decisions more quickly, more
accurately, and with less complication.”xxix
Another temptation when faced with the availability of massive amounts of disparate data
is to throw in a large number of controls in regression analysis to find ‘true’ relationships
in the data. Doing so can strengthen the analysis’ internal validity by ‘netting out’ of the
effects of other endogenous factors on the dependent variable, but it brings about several
potential challenges. First, it downplays the fact that combining data from multiple
sources may also mean “magnifying”66 their flaws. If the results are contingent on factors
specific to the unit of analysis, they also become hard to generalise to other settings with
vastly different mean values of the included controls: external validity is then weakened.
There is another econometric downside to throwing in a large number of controls
indiscriminately. If many of them are correlated, the resulting multicollinearity will lead
to non-unique parameter fits and more or less arbitrary parameter choices, meaning that
the results may be misleading. This suggests that theory and context matter even (or,
xxix
Note that the ‘causal link’ in question does not imply that text messages ‘cause’ actual damage, but that
more texts mean more damage because of the features of the system.
32