Spain's Regional GDP Growth in 2015; Madrid, Valencia and Catalonia Lead
•
0 gefällt mir•178 views

The document summarizes economic indicators and statistics from Spain, the European Union, and other countries: - In Spain, the regions of Valencia, Madrid, and Catalonia had the highest GDP growth rates in 2015 at 3.6%, 3.4%, and 3.3% respectively, while over 69% of social benefits in December 2015 were contributory pensions. - In the EU, public spending on social protection increased from 45.6% to 50% of GDP from 2007-2009 during the economic crisis but decreased to 48.2% from 2009-2014 under restrictive fiscal policies. - In the US, GDP grew 2.4% in 2015 due mostly to consumer spending, while the Fed kept

Empfohlen
Empfohlen
Weitere ähnliche Inhalte
Was ist angesagt?
Was ist angesagt? (20)
Andere mochten auch
Andere mochten auch (8)
Ähnlich wie Spain's Regional GDP Growth in 2015; Madrid, Valencia and Catalonia Lead
Ähnlich wie Spain's Regional GDP Growth in 2015; Madrid, Valencia and Catalonia Lead (20)
Mehr von Círculo de Empresarios
Mehr von Círculo de Empresarios (20)
Kürzlich hochgeladen
Kürzlich hochgeladen (20)
Spain's Regional GDP Growth in 2015; Madrid, Valencia and Catalonia Lead
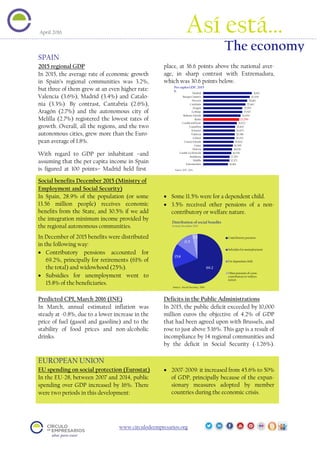
- 1. April 2016 O SPAIN 2015 regional GDP In 2015, the average rate of economic growth in Spain’s regional communities was 3.2%, but three of them grew at an even higher rate: Valencia (3.6%), Madrid (3.4%) and Catalo- nia (3.3%). By contrast, Cantabria (2.6%), Aragón (2.7%) and the autonomous city of Melilla (2.7%) registered the lowest rates of growth. Overall, all the regions, and the two autonomous cities, grew more than the Euro- pean average of 1.8%. With regard to GDP per inhabitant –and assuming that the per capita income in Spain is figured at 100 points– Madrid held first place, at 36.6 points above the national aver- age, in sharp contrast with Extremadura, which was 30.6 points below. Social benefits December 2015 (Ministry of Employment and Social Security) In Spain, 28.9% of the population (or some 13.56 million people) receives economic benefits from the State, and 30.5% if we add the integration minimum income provided by the regional autonomous communities. In December of 2015 benefits were distributed in the following way: • Contributory pensions accounted for 69.2%, principally for retirements (61% of the total) and widowhood (25%). • Subsidies for unemployment went to 15.8% of the beneficiaries. • Some 11.5% were for a dependent child. • 3.5% received other pensions of a non- contributory or welfare nature. Predicted CPI, March 2016 (INE) In March, annual estimated inflation was steady at -0.8%, due to a lower increase in the price of fuel (gasoil and gasoline) and to the stability of food prices and non-alcoholic drinks. Deficits in the Public Administrations In 2015, the public deficit exceeded by 10,000 million euros the objective of 4.2% of GDP that had been agreed upon with Brussels, and rose to just above 5.16%. This gap is a result of incompliance by 14 regional communities and by the deficit in Social Security (-1.26%). EUROPEAN UNION EU spending on social protection (Eurostat) In the EU-28, between 2007 and 2014, public spending over GDP increased by 16%. There were two periods in this development: • 2007-2009: it increased from 45.6% to 50% of GDP, principally because of the expan- sionary measures adopted by member countries during the economic crisis. 31,812 30,459 28,682 27,663 25,552 25,507 24,394 23,290 21,922 20,847 20,675 20,586 20,431 19,900 19,399 18,929 18,354 17,263 17,173 16,166 Madrid BasqueCountry Navarre Catalonia Aragon La Rioja Balearic Islands Spain CastileandLeon Cantabria Asturias Valencia Galicia CanaryIslands Ceuta Murcia Castile-La Mancha Andalusia Melilla Extremadura Per capita GDP, 2015 € Source: INE, 2016 69.2 15.8 11.5 3.5 Distribution of social benefits % total, December 2015 Contributorypensions Subsidiesfor unemployment For dependentchild Other pensionsof a non- contributoryor welfare nature Source: Social Security, 2016 Así está… The economy www.circulodeempresarios.org
- 2. • 2009-2014: it dropped to 48.2% of GDP, through the application of restrictive fiscal policies, especially in the peripheral coun- tries. The most important share of public spending is on social protection, some 40.4% of the total in 2014 (in Spain, 39.6%). This expense represented 19.5% of the GDP of the EU-28, and 17.6% in Spain. Economic Sentiment Indicator In March, the Economic Sentiment Indicator in the Eurozone fell for the third consecutive month (to 103, or by -0.9 points with respect to February) and also in the EU (-0.7 points, to 104.6). There was a similar trend in Spain. INTERNATIONAL USA GDP GDP in the United States grew 2.4% in 2015, fundamentally because of greater consump- tion (up 2.4%) and a smaller drop in exports. The Federal Reserve (Fed) predicts growth of 2.2% in 2016 and of 2.1% in 2017. Interest rates One-third of the members of the Fed feel that conditions are right for hikes in interest rates. However in March it was decided to keep the price of money stable, between 0.25% and 0.5%. Fed president Janet Yellen has recently urged caution due to global economic and financial weaknesses, and to the uncertainties in the US economy, principally because of low oil prices and the negative effect on exports of a stronger dollar. Japan: public accounts The government of Japan has approved a record budget for 2016, equivalent to 761,069 million euros, which represents an increase of 0.4% over 2015. Last year, Japan ended up with a deficit of 6% and a debt of 230% of the GDP. The government foresees new measures to stimulate consumption and investment in infrastructures. Among them: increasing the birth rate through childcare assistance, and renewing highways, bridges and ports. 40.4 15.0 13.9 10.2 8.8 3.7 2.8 2.1 1.7 1.4 General public expenditure by function EU, 2014 % total (48.2% GDP) Socialprotection Health Generalpublic services Education Economic affairs Public order andsafety Defence Recreation,cultureandreligion Environmentalprotection Housingandcommunity amenities Source: Eurostat, 2016 60 70 80 90 100 110 120 2007M03 2007M07 2007M11 2008M03 2008M07 2008M11 2009M03 2009M07 2009M11 2010M03 2010M07 2010M11 2011M03 2011M07 2011M11 2012M03 2012M07 2012M11 2013M03 2013M07 2013M11 2014M03 2014M07 2014M11 2015M03 2015M07 2015M11 2016M03 Economic Sentiment indicator, March 2016 EU-28 Euroarea Spain Source: Eurostat, 2016 28% 39.50% 49.20% 53.60% June July September November Chanceofa Fed rate hike, 2016 Based on Fed Funds Futures Source: Blomberg, 2016 0 50 100 150 200 250 Public debt and public deficit, Japan 2015 % GDP Debt -10 -8 -6 -4 -2 0 2006 2007 2008 2009 2010 2011 2012 2013 2014 2015 Deficit Source: INE, 2016 ‘Así está…The economy’, a publication of the Círculo de Empresarios produced by its Department of the Economy, contains information and opinion from reliable sources. However the Círculo de Empresarios does not guarantee its accuracy and does not take responsibility for any errors or omissions. This document is merely informative. As a result, the Círculo de Empresarios is not responsible for any uses that may be made of the publication. The opinions and estimates of the Department can be modified without any warning. www.circulodeempresarios.org