Value Stream Mapping at HRVP case report
•
0 gefällt mir•749 views

1) The authors conducted a value stream mapping (VSM) at a medical oncology unit to improve inefficient processes around chemotherapy prescriptions, authorizations, filling, and billing that took two days to complete. 2) The VSM identified problems like poor integration between processes, multiple handoffs of patient charts, and a lack of necessary information available to all involved. 3) Using lean tools like spaghetti diagrams and error proofing, the team proposed solutions like streamlining patient and information flows, creating a patient chart supermarket, and pre-filling prescriptions. 4) Measurements showed an 84% reduction in lead time, 36% reduction in cycle time, and
Empfohlen

Empfohlen
Weitere ähnliche Inhalte
Andere mochten auch
Andere mochten auch (20)
Ähnlich wie Value Stream Mapping at HRVP case report
Ähnlich wie Value Stream Mapping at HRVP case report (20)
Mehr von Carlos Frederico Pinto
Mehr von Carlos Frederico Pinto (20)
Kürzlich hochgeladen
Kürzlich hochgeladen (20)
Value Stream Mapping at HRVP case report
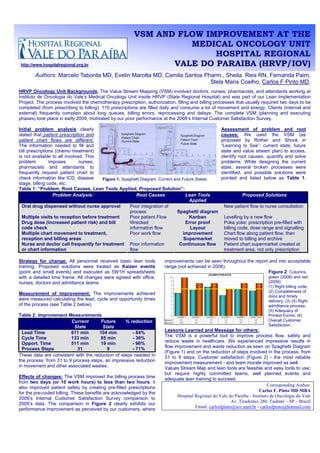
- 1. VSM AND FLOW IMPROVEMENT AT THE MEDICAL ONCOLOGY UNIT HOSPITAL REGIONAL http://www.hospitalregional.org.br VALE DO PARAIBA (HRVP/IOV) Authors: Marcelo Taborda MD, Evelin Marotta MD, Camila Santos Pharm., Sheila Reis RN, Fernanda Paim, Stela Maris Coelho, Carlos F Pinto MD. HRVP Oncology Unit Backgrounds. The Value Stream Mapping (VSM) involved doctors, nurses, pharmacists, and attendants working at Instituto de Oncologia do Vale’s Medical Oncology Unit inside HRVP (State Regional Hospital) and was part of our Lean Implementation Project. The process involved the chemotherapy prescription, authorization, filling and billing processes that usually required two days to be completed (from prescribing to billing). 110 prescriptions are filled daily and consume a lot of movement and energy. Clients (internal and external) frequently complain about long queues, billing errors, reprocessing and delays. The complete VSM (planning and executing phases) took place in early 2009, motivated by our poor performance at the 2008’s Internal Customer Satisfaction Survey. Initial problem analysis clearly Assessment of problem and root stated that patient prescription and causes: We used the VSM (as patient chart flows are different. proposed by Rother and Shook in The information needed to fill and “Learning to See”: current state, future bill prescriptions (chemo treatment) state and value stream plan) to access, is not available to all involved. This identify root causes, quantify and solve problem imposes nurses, problems. While designing the current pharmacists and attendants to state, several broken processes were frequently request patient chart to identified, and possible solutions were check information like ICD, disease Figure 1: Spaghetti Diagram: Current and Future States pointed and listed below as Table 1. stage, billing code, etc. Table 1: “Problem, Root Causes, Lean Tools Applied, Proposed Solution”: Problem Analysis: Root Causes Lean Tools Proposed Solutions Applied Oral drug dispensed without nurse approval Poor integration of New patient flow to nurse consultation process Spaghetti diagram Multiple visits to reception before treatment Poor patient Flow Kanban Levelling by a new flow Drug dose (increased patient risk) and bill Wrecked Error proof Poka yoke: prescription pre-filled with code check information flow Layout billing code, dose range and signalling Multiple chart movement to treatment, Poor work flow improvement Chart flow along patient flow, then reception and billing areas Supermarket moved to billing and archive Nurse and doctor call frequently for treatment Poor information Continuous flow Patient chart supermarket created at or chart information flow treatment area, not only prescription Strategy for change: All personnel received basic lean tools improvements can be seen throughout the report and into acceptable training. Proposed solutions were treated as Kaizen events range (not achieved in 2008). (point and small events) and executed as 5W1H spreadsheets Figure 2: Columns with a detailed time frame. All changes were agreed with office, green (2008) and red nurses, doctors and admittance teams. (2009): (1) Right billing code; (2) Completeness of Measurement of improvement: The improvements achieved docs and timely were measured calculating the lead, cycle and opportunity times delivery; (3) (4) Right of the process (see Table 2 below). admittance process; (5) Adequacy of Table 2: Improvement Measurements Printed Forms; (6) Current Future % reduction Overall Customer State State Satisfaction. Lessons Learned and Message for others: Lead Time 611 min 104 min - 84% The VSM is a powerful tool to improve process flow, safety and Cycle Time 133 min 85 min - 36% Opport. Time 511 min 19 min - 96% reduce waste in healthcare. We experienced impressive results in Process Steps 31 9 - 71% flow improvement and waste reduction as seen on Spaghetti Diagram (Figure 1) and on the reduction of steps involved in the process, from These data are consistent with the reduction of steps needed in 31 to 9 steps. Customer satisfaction (Figure 2) - the most reliable the process: from 31 to 9 process steps, an impressive reduction improvement measurement - and team morale improved as well. in movement and other associated wastes. Values Stream Map and lean tools are feasible and easy tools to use; but require highly committed teams, well planned events and Effects of changes: The VSM improved the billing process time adequate lean training to succeed. from two days (or 10 work hours) to less than two hours, it Corresponding Author: also improved patient safety by creating pre-filled prescriptions Carlos F. Pinto MD MBA for the pre-coded billing. These benefits are acknowledged by the Hospital Regional do Vale do Paraíba - Instituto de Oncologia do Vale 2009’s Internal Customer Satisfaction Survey comparison to Av. Tiradentes 280, Taubaté – SP – Brazil 2008’s data. The comparison in Figure 2 clearly exhibits our Email: carlosfpinto@iov.med.br - carlosfpinto@hotmail.com performance improvement as perceived by our customers, where