Case study electronics industry
•Als DOCX, PDF herunterladen•
1 gefällt mir•253 views

Lean Management implementation in electronics industry in South India

Empfohlen
Weitere ähnliche Inhalte
Was ist angesagt?
Was ist angesagt? (20)
Andere mochten auch
Andere mochten auch (18)
Ähnlich wie Case study electronics industry
Ähnlich wie Case study electronics industry (20)
Kürzlich hochgeladen
Kürzlich hochgeladen (20)
Case study electronics industry
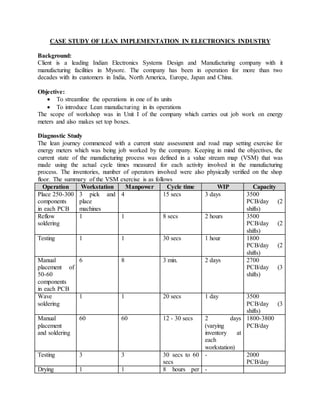
- 1. CASE STUDY OF LEAN IMPLEMENTATION IN ELECTRONICS INDUSTRY Background: Client is a leading Indian Electronics Systems Design and Manufacturing company with it manufacturing facilities in Mysore. The company has been in operation for more than two decades with its customers in India, North America, Europe, Japan and China. Objective: To streamline the operations in one of its units To introduce Lean manufacturing in its operations The scope of workshop was in Unit I of the company which carries out job work on energy meters and also makes set top boxes. Diagnostic Study The lean journey commenced with a current state assessment and road map setting exercise for energy meters which was being job worked by the company. Keeping in mind the objectives, the current state of the manufacturing process was defined in a value stream map (VSM) that was made using the actual cycle times measured for each activity involved in the manufacturing process. The inventories, number of operators involved were also physically verified on the shop floor. The summary of the VSM exercise is as follows Operation Workstation Manpower Cycle time WIP Capacity Place 250-300 components in each PCB 3 pick and place machines 4 15 secs 3 days 3500 PCB/day (2 shifts) Reflow soldering 1 1 8 secs 2 hours 3500 PCB/day (2 shifts) Testing 1 1 30 secs 1 hour 1800 PCB/day (2 shifts) Manual placement of 50-60 components in each PCB 6 8 3 min. 2 days 2700 PCB/day (3 shifts) Wave soldering 1 1 20 secs 1 day 3500 PCB/day (3 shifts) Manual placement and soldering 60 60 12 - 30 secs 2 days (varying inventory at each workstation) 1800-3800 PCB/day Testing 3 3 30 secs to 60 secs - 2000 PCB/day Drying 1 1 8 hours per -
- 2. batch Back Cover Assembly 8 8 12 - 30 secs 1 days 1800-3800 /day Final Assembly 4 4 12 – 30 secs 1 days 1800-3800 / day Baseline study: The existing throughput time for a batch of energy meter to come out of the facility was varying from 4-6 days. The production rate per day was varying from 1800 to 3200 energy meters per day depending on the demand as well as the number of shifts of production of various workstations Due to inventory at almost every workstation, it was observed that there were various instances of many of the WIP becoming obsolete. The data at various testing workstations showed that the present quality level was around 98% (20,000 ppm) with some instances of ppm going down to even 1,00,000 ppm especially after wave soldering. System Potential: Based on the current state map and our observations, the future state map was drawn out. It was decided that the throughput time of a batch of energy meters would be brought down to 2 days considering that 8 hours drying time was essential for every energy meter. The improvement themes identified were as follows Improvement themes: Reduce the throughput time of energy meters and other products Improve the FTR (First Time Right) % of the various workstations Provide the flexibility on the lines in order to be able to take up different product mix as per customer requirement Reduce the changeover time of pick and place machine Roadmap for Lean implementation: S.No. Current State Observation Action Plan Expected results Action Mth 1 Mth 2 Mth 3 Mth 4 Mth 5 Mth 6 Mth 7 Mth 8 1 Throughput time – There are more than 40 workstations. Each workstation had inventory and was working independently. The total throughput time for a batch to be delivered to the client was 4-6 days Future state map with redesigning of workstations to be done. Flow to be implemented after the automated operations till the drying process which is in batch mode. This will ensure each workstation pulls from its upstream workstation The throughput time was expected to be brought down to 2 days 2 The pacemaker process was the Detailed study of the changeover to Changeover time to be
- 3. pick and place process which places 250-300 components in each PCB. Changeover time in the pick and place machines from one product to another was around 90 min. be carried out. SMED concepts to be used to reduce the changeover time reduced to around 15 min. 3 Defects were being detected downstream much later. This resulted in the various workstations continuing to produce bad quality components as feedback is not received in time. (Reflow soldering and wave soldering workstations) Point of occurrence and point of detection to be brought closer to each other. Quality check to be introduced immediately after reflow soldering and after wave soldering PPM is expected to be reduced from 20000 ppm to around 10000 ppm 4 Reflow soldering and wave soldering were the key workstations which contributes to the FTR being low Identify the root causes of the defects and address them with temporary and then permanent countermeasures. Expected that the ppm of these workstations will come down to 1000 ppm 5 Cycle time at each of the workstations was much different from the TAKT time of pacemaker process. This results in line not being balanced Change in the design of the workstation to enable standardization of work and equal distribution of work across workstations. This will also ensure that irrespective of product the core processes are standardized All workstations to work with even TAKT time of pacemaker process (15 seconds) 6 All the workstations have to be synchronized Synchronize and level schedule based delivery dates. Improve the Reduce the throughput time by 10%
- 4. with the pacemaker process. monitoring system through 5S 7 Standardize the complete process of scheduling for different product mix based on client requirements Establish SOPs, visual management, monitoring systems etc. Consistently achieve OTIF (On time In Full) of 99.9% Implementation Methodology KIAP has a unique intensive workshop methodology to improvement and problem solving in strategic areas. 2-3 day workshops were conducted in each stage taking up projects in accordance with the lean roadmap. During these workshops, process improvement and Problem Solving are accelerated thereby giving significant improvement. In each workshop, cross-functional teams were formed, each team working on improvement of one strategically important area. Over a one-year period, participation was ensured from all functions including finance, stores, marketing and HR. The participants in the workshop simultaneously learn the relevant lean tools and techniques by actually implementing them. Top Management (owner) commitment is the pre-requisite for the success of any such initiative and this was obtained by their physical presence during the presentation/ experience sharing sessions at the start and end of each day of the workshop. Standardization of the improvements made was reviewed within 3-4 weeks after each workshop. Improvement Projects Project 1 – Implementation of flow The automated pick and place machines were identified as the pacemaker process as they were the main influencers in determining the capacity of the entire line. Accordingly, all the manual workstations were redesigned in terms of processes at each workstation, in such a manner that every workstation had a cycle time close to the cycle time of pick and place operations i.e. approx 15 secs. A total of 40 workstations were thus established. The workstations were then relaid and flow was established from the pick and place process till the drying process. This ensured that a particular PCB whose processing was started was able to complete all the processes and reach the drying stage within 2 hours. Flow was then established, post the drying process, till the final assembly. The total throughput time achieved for one PCB to get converted to an energy meter was approx 16 hours spread over two days, including the drying time of 8 hours The total shop floor space occupied in the new layout was 60% less than the earlier layout. Project 2 – Changeover time reduction in pick and place machines The total changeover time in pick and place machines from one product to another was approximately 90 min. The changeover process involved unloading and reloading of cartridges carrying various components. The various activities in the changeover process was classified into online and offline activities and all offline activities were carried out before the start of the actual changeover. Without the presence of all the cartridges needed for the changeover, the changeover was not started. This resulted in the total changeover time being reduced to 15 min.
- 5. Project 3 – Point of detection of mistakes was made as close to point of occurrence as possible The wave soldering operations was identified as the point of occurrences for a number of defects. However since these defects were actually detected atleast two or three workstations downstream of the wave soldering workstations, it resulted in a number of PCBs being defectively produced even thought the defects had already been detected. An inspection workstation was introduced for the PCBs coming out of wave soldering. This ensured that feedback on wave soldering was immediately provided and this prevented further defective components produced from wave soldering. This brought down the ppm after wave soldering from a range of around 20000 ppm to 10000 ppm Project 4 – Lifting of components during wave soldering causing quality defects One of the root causes of quality defects out of wave soldering was the lifting of a transformer when it is passing over the solder wave. A jig was designed to hold down the transformer which resulted in the ppm coming down by further 4000 ppm. Thus the quality defects reduced to 6000 ppm after wave soldering. The above improvements were implemented during the first workshop carried out by us. Further improvements are still in process and the lean journey is continuing in the organization. Summary of Results obtained Parameter Before After Improvement Throughput time 4 – 6 days 2 days 60% reduction Floor space occupied 7500 sq.ft. 3000 sq.ft. 60% reduction Changeover time 90 min. 15 min. 83% reduction FTR 20000 ppm 6000 ppm 70% reduction No. of persons 80 persons 60 persons 25% reduction WIP > 10 days 2 days 80% reduction The benefits obtained have resulted in the company being able to service the customer with shorter lead times, take orders of different products and thus be in tune with the market requirements without compromising on the productivity and quality.