Feasibility study of small hydropower schemes in giba and
•
2 gefällt mir•473 views

The International Institute for Science, Technology and Education (IISTE). Science, Technology and Medicine Journals Call for Academic Manuscripts

Empfohlen
Empfohlen
Weitere ähnliche Inhalte
Was ist angesagt?
Was ist angesagt? (20)
Andere mochten auch
Andere mochten auch (20)
Ähnlich wie Feasibility study of small hydropower schemes in giba and
Ähnlich wie Feasibility study of small hydropower schemes in giba and (20)
Mehr von Alexander Decker
Mehr von Alexander Decker (20)
Kürzlich hochgeladen
Kürzlich hochgeladen (20)
Feasibility study of small hydropower schemes in giba and
- 1. Journal of Energy Technologies and Policy www.iiste.org ISSN 2224-3232 (Paper) ISSN 2225-0573 (Online) Vol.4, No.8, 2014 Feasibility Study of Small Hydropower Schemes in Giba and Worie Subbasins of Tekeze River, Ethiopia Niguse Abebe* Department of Water Resources and Irrigation Engineering, Aksum University, Ethiopia * E-mail of the corresponding author: nigus.abebe@gmail.com 8 Abstract The untapped small hydropower potential of Ethiopia has not been given much attention yet that can contribute for green power development in poverty reduction and sustainable development. The main objective of this research work is to evaluate the technical and economic feasibility of small hydropower potential sites of Giba and Worie subbasins which are part of the Tekeze River Basin, Northern Ethiopia. Ten (10) small hydropower potential sites were verified for economic/financial feasibility analysis from Giba and Worie subbasins (20 potential sites). Rainfall records from ten stations in the Giba and six stations in the Worie catchments were used to compute the areal rainfall over the two catchments. Stream flow records from seven gauging stations in Giba and one gauging station in Worie catchments were used for hydrological analysis. The discharge for ungauged hydropower potential sites was transferred/estimated using the runoff coefficient method. Topographic map and Digital Elevation Models were used for analyzing watershed delineation, river networks, location of the potential sites and gauging stations, Thiessen Polygon network construction, area of contributing catchments and measuring civil work components using GIS and Global Mapper. The viability of the hydropower potential sites was analysed using RETScreen software. Based on the RETScreen generated results Meskila-1, Meskila-2, Meskila-3, Genfel-1, Genfel-2 and Suluh were feasible with total power of 3591kW, but Genfel-3, Genfel-4, Agulae and Giba dam site are not viable from Giba subbasin. All except site W-7 (783kW) are not viable in Worie subbasin. In general, most of the run-of-river plants are not feasible; though there is suitable gross heads for small hydropower development, there is high variability of stream flows. Keywords: Small Hydropower, Financial Parameters, RETScreen, Feasibility/viability 1. Introduction Ethiopia is fortunate to be blessed with abundant water resources that can be tapped to meet its growing energy needs, despite being landlocked and non-oil producing country. Hydropower is one of the main energy sources that is recognized and given priority for poverty reduction and sustainable development in Ethiopia. According Solomon (1998), regardless of its great economic advantages, large scale hydropower projects need considerably large amount of investment, face strong opposition of environmental civil organizations, and take relatively longer gestation period than small hydropower schemes. Therefore, Small (Scale) Hydropower (SHP) schemes have emerged as an alternative energy sources since they are renewable, easily developed, relatively inexpensive, and it has low impact on the environment. SHP systems can play an important role in the electrification of rural areas and towns in Ethiopia that are far from the national electricity grid, or to contribute to the national grid. It is also desirable not only to meet an ever growing energy demand, but also to reduce bio-fuels use related health risks like respiratory illnesses, cancer, carbon monoxide poisoning, and the causes for the environment pollution. Feasibility study is a comprehensive analysis and detailed study of the proposed project. It is carried out in order to determine whether the potential development is technically, economically and environmentally feasible and justifiable under anticipated economic conditions (Ravn, 1992). Feasibility studies include estimation of diversion, design and probable maximum floods, determination of power potential for a range of dam heights and installed capacities for project optimization, preliminary design of main structures, earthquake effect analysis, optimization of the project layout, water levels and components, detailed cost estimates, development of cash flow tables, production of implementation schedule and development plans, economic and financial analyses and environmental impact assessment (Ravn,1992). The feasibility assessment of SHP sites is a relatively high proportion of overall project costs (Petras, 2011). It is absolutely clear that a reliable assessment of real SHP site feasibility implies some “on the ground” surveying and investigation, but software tools (like RETScreen) for SHP assessment are helpful to assess the technical and
- 2. Journal of Energy Technologies and Policy www.iiste.org ISSN 2224-3232 (Paper) ISSN 2225-0573 (Online) Vol.4, No.8, 2014 economic feasibility of a SHP projects before spending substantial sums of money and time (Wilson, 2000 and Petras, 2011). In this study, therefore, the technical and economic feasibility evaluation of SHP potential sites in Giba and Worie catchments using RETScreen was carried out. 2. Materials and Methods 2.1. Description of the Study Area The Tekeze River Basin is located in the northern part of Ethiopia (Figure 2.1). The basin has an average elevation of 1850m above sea level (asl) and average annual rainfall ranges from 1200mm to 600mm. A catchment area of about 63,000km2 (excluding tributaries like Angereb and Goang which join the basin beyond the Ethio-Sudanese border). The total area of the basin with Angereb and Goang is 86491km2 (NEDECO, 1998). The main tributaries of Tekeze in Ethiopia are: on the right bank Tahali, Meri, Tellare, Sullo, Arekwa, Giba, Worie, Firafira, Tocoro and Gumalo Rivers; on the left bank Nili, Balagas, Saha, Bemba, Ataba, Zarima, and Kwalema Rivers. The average annual precipitation decreases from south to north from 1200mm to 600mm, (NEDECO, 1998). Figure 2.1: Study Area Delineation: Giba and Worie Sub-basins 9 a) Giba Subbasin The Giba sub basin lies between latitudes 13017’46” and 14015’00” N and longitudes 38037’37”and 39047’47’’E. The total drainage area of the Giba up to the junction to Tekeze is about 5163 km2; the length of the main watercourse is 236.4km. The principal tributaries of this river are: Suluh, Genfel, Agulae, Illala, and Meskilla. This Giba river is one of the main tributaries of Tekeze river located in the northern part of Ethiopia; it joins the Tekeze river 34km (along the watercourse) downstream of the Tekeze Hydropower project at an elevation of less than 1000 ( about 975)m .a.s.l. The Giba river originates at Gasat (Latitude13038’50”N, Longitude 39024’42”E and Altitude1762m.a.s.l), the junction of Suluh and Genfel, and is 143km long. The Suluh river originates from Keshehat in the Dendera ridge at an elevation of 3323m a.s.l. (for the Suluh River) and Ayfela in the Ayfela ridge at an elevation of more than 2740m.a.s.l.
- 3. Journal of Energy Technologies and Policy www.iiste.org ISSN 2224-3232 (Paper) ISSN 2225-0573 (Online) Vol.4, No.8, 2014 The elevation of the study basin varies from about 1000 m to 3333 m a.s.l. (Dendera ridge), average elevation is about 2150 m. The topographic setting (feature) and availability of abundant water provides great potential for hydropower development. Rainfall of the Giba basin is highly seasonal with an annual rainfall ranging from over 500mm in the northern part to about 700mm in the central and west of the basin. The average over the whole basin is about 666mm, with more than 60% of the rainfall occurring between July and August, is unimodal pattern. The distribution of rainfall indicates that the rainfall is concentrated in the central part of the basin. 10 b) Worie Subbasin Worie is also one of the tributaries of Tekeze basin; lies between latitudes 13036’27” and 14o16’7.5”N and longitudes 38034’2.5” and 39029’18.5”E. it has drainage area about 5379 km2 and annual rainfall around 730mm. The major tributaries of Worie are: Teway Ruba, Asem, Kinetal, Tsedia, Ruba Seguh, Yerbay, Gedgeda, Tsalet. 2.2. Data Collection Techniques and Analysis Quantitative and qualitative of primary and secondary data were collected from different sources and analyzed using GIS, Global Mapper, Spread Sheet Excel and RETScreen. In the RETScreen models; analyzing the energy output generation with the costs under the consideration of the financial parameters of the project life; the savings, income summary, cash flow, and financial viability information has been generated. The general procedure of the data analysis is structured in flowchart (Figure 2.2). 2.2.1. Topographic Data Analysis For this particular study the topographic data with scale of 1:50,000 which was collected from Ethiopia Mapping Agency and shape files of the Tekeze River basin generated from Shuttle Radar Topographic Mission Digital Elevation Mode (SRTM DEM) resolution of 90mx90m obtained from Ministry of Water, Irrigation and Energy department of GIS, mainly used to describe the streams, main roads and grid center using Global Mapper 10. The SRTM DEM of 30mx30m spatial resolution is helpful for visualizing and delineating basin area, contour line generations, hydrological parameters computations and analysis (flow direction & flow accumulation, slope, etc...) using ArcHydro Tools 9 of ArcGIS 9.3 extension. The civil work components were measured from the 10m contour interval of SRTM DEM of 30mx30m spatial resolution. The contour lines overlay can be visualized by zooming in and out. ArcGIS 9.3 gives the power to visualize, explore, query and analyze data geographically. 2.2.2. Meteorological Data Analysis There are ten (10) and six (6) rainfall gauging stations used for Giba and Worie in or near subbasins, respectively. These gauging stations have poor matching recorded periods and missing of months and years. Moreover, for some stations the total number of years of records is too small for analysis. The missing rainfall data were filled; the homogeneity and consistency of the rainfall data were checked. The average watershed rainfalls at the sites of interest were estimated by constructing Thessien polygon network. 2.2.3. Hydrological Data Analysis To estimate water resources as well as hydropower potentials at the sites, hydrologic study was carried out using existing discharge and rainfall data recorded at the gauging stations available for the subbasin in or nearby the area. Even though there is significant missing data in rainfall and runoff, as well as poor matching of recorded periods, monthly rainfall and concurrent runoff data were used. For this study purpose, stream flow discharges of seven (7) gauge stations for Giba and one (1) station for Worie subbasins was obtained from Ministry of Water Resources, Hydrology Department. Stream flow data should be carefully checked and adjusted for errors resulting from instrumental and observational deficiencies. Double mass curve is employed to evaluate consistency. In double mass curve, accumulated runoff of a station is plotted against accumulated specific runoff a group of nearby stations to evaluate consistency. If the consistency of a station has undergone changes, it can be noticed from the slope of the mass curve. Unless the change is significant exceeding 10% of the original slope, it should be confirmed whether the deviation is not part of the usual scatter. In this study, filling of the missed data was conducted by use of runoff coefficient and developing rainfall-runoff regression model. The monthly areal rainfall by employing the Thiessen polygon method, and the concurrent runoff data, the monthly runoff coefficient was estimated. This runoff coefficient was used to fill missing runoff data and to estimate runoff data at the hydro sites upstream or downstream of the respective rainfall gauging
- 4. Journal of Energy Technologies and Policy www.iiste.org ISSN 2224-3232 (Paper) ISSN 2225-0573 (Online) Vol.4, No.8, 2014 station. The regression relation model of rainfall-runoff for Giba subbasin was developed as Q= 0.4105P - 44.829, where Q= mean annual runoff (Mm3) or (mm) and P= Mean annual watershed rainfall in millions m3 or mm. The runoff coefficient at Worie stream gauge station is assumed to represent the whole Worie subbasin. 2.2.4. Transformation of Stream Flow Data for Ungauged Hydropower Potential Sites The sites of the study area are far away from the gauging station of stream flow data historical recorded which are used to transfer the stream flow and rainfall of the gauged stations to the ungauged sites of hydro potential. Thus based on the above situation the data analysis, stream flow generation/transfer should be performed to the hydro sites using runoff coefficient- discussed in section 2.2.3. To estimate the hydropower potential sites of the study area, discharge at ungauged sites (hydro sites) are estimated by using the runoff coefficients obtained from simultaneous data of rainfall and runoff at the gauged sites of the same time, which is given by: site A Q = ( ) • site P Where: ASite = Drainage area of site of interest (km2), Agauge = drainage area at the gauge site site (km2), QSite = Discharge at the site of interest (m3/s), Qgauge = Discharge at the gauge site (m3/s), Psite = areal rainfall at the site of interest (mm), Pgauge = areal rainfall at the gauge site (mm). 2.2.5. Small Hydropower Project Model Analysis using RETScreen The model addresses both run-of-river and reservoir developments and it incorporates sophisticated formulae for calculating efficiencies of a wide variety of hydro turbines. The Small Hydro Project Model has been developed primarily to determine whether work on the small hydro project should proceed further or be dropped in favour of other alternatives. Only about 25% of the cost is relatively fixed, being the cost of manufacturing the electromechanical equipment (RETScreen, 2004-a, 2005 and 2010). The model has seven worksheets: Energy Model (Hydrology Analysis and Load Calculation, and Equipment Data), Cost Analysis and formula tools, Greenhouse Gas Emission Reduction Analysis (GHG Analysis), Financial Analysis (financial Summary), and Sensitivity and Risk Analysis (Sensitivity) are provided in the Small Hydro Project Workbook file. The GHG Analysis and Sensitivity worksheets are optional analysis. Each worksheet in the models must be completed by row from the top to bottom by entering values of the required data. First, the Energy Model worksheet is completed, and then the Cost Analysis worksheet and finally the Financial Summary worksheet should be completed. This step can be repeated several times in order to optimize the design of the small hydro project from an energy production and cost standpoint. 11 gauge gauge gauge P Q A
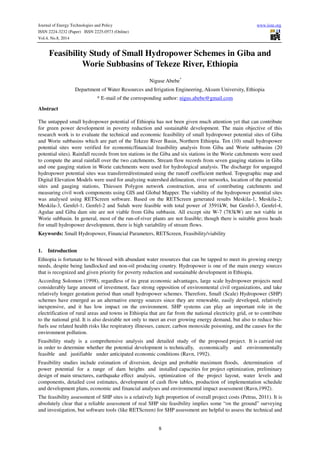
- 5. Journal of Energy Technologies and Policy www.iiste.org ISSN 2224-3232 (Paper) ISSN 2225-0573 (Online) Vol.4, No.8, 2014 Data Spatial data Civil works • Hydrological data • Gross head • Hydraulic loses • Turbine Energy Cost Analysis Model Analysis Model Financial Analysis Model Annual Energy Production 12 • Financial parameters Initial Cost Annual Cost Total Cost No No Yes • Global Mapper • GIS • Field survey RETScreen Financial viability Viable site Figure 2.2: Economic feasibility study of SHP flowchart • Tuning cost ratios • Coefficient factors • Electromechanical 3. Results and Discussion 3.1. Small Hydropower Potential Sites of the Study Area Based on the ranking of small hydropower potential sites in the study area ten (10) top ranked SHP potential sites were verified for financial feasibility analysis from Giba and Worie subbasins (total of twenty potential sites). Only two remaining parameters were used to determine the hydropower potential sites, discharge and head. The gross head of hydroelectric power may be constant, but the flow varies over the year. The head was measured from digital elevation model (DEM). Discharge is dependent on a number of processes taking place in the catchment. The main influence is runoff from rainfall, stream flow, drainage basins, catchment areas, evapotranspiration, surface geology, groundwater, etc. For this study, the first four parameters were considered. The discharge at the interest point was estimated by transforming of the stream flow data to ungauged potential sites. The transformation was carried out by estimating the point and areal rainfall data, catchments areas of the gauge stations and potential sites, and monthly runoff coefficient of the catchments. The rainfall data at the point of interest was determined based on the contributing confluence areas visualized on the Thiessen polygon network. Drainage areas of gauge stations was already available, the total drainage area supplying runoff to reach outlet (hydro site) was obtained by summing area of upstream catchments (water contributing area
- 6. Journal of Energy Technologies and Policy www.iiste.org ISSN 2224-3232 (Paper) ISSN 2225-0573 (Online) Vol.4, No.8, 2014 above the outlet point). In order to obtain the optimum design discharge for a given project, various design discharges are selected and change of the net income with respect to the selected discharge is evaluated. The discharge resulting in the maximum annual net benefit (i.e. annual income-annual cost) is selected as the design discharge for that project for a given electricity export rate. 3.2. Small Hydropower Project Formulation Results Using RETScreen RETScreen runs on Microsoft Excel platform and uses empirical equations to calculate the energy output and costs of the projects. RETScreen software determines the main financial viability of the project to compare the possible project alternatives. RETScreen software gives more accurate results for small hydropower projects especially run-of-river type than reservoir storage. Moreover, when the input parameters of the program are changed, the results are updated automatically. The software uses colored cells to guide the user when entering data. As can be seen in the general layout of the program (Figure 3.1) it has "Start Energy Model, Cost Analysis, Emission Analysis, Financial Analysis, Risk Analysis and Tools" sheets͘. In this study, emission and risk analysis sheets were not used. In the evaluation of the alternatives, first Start and Energy Model sheets are completed with the required data͘ after that the "Hydro Formula Costing Method" given in the Tools sheet is used to calculate the total initial costs of the project. In the next step the Cost Analysis sheet is completed. Finally, Financial Analysis sheet is filled and as a result the financial viability of the project is obtained (Table 3.5). Evaluation of a small hydropower scheme in RETScreen involves completion of many input data provided in each worksheets. Within the scope of this research, these sheets are completed for various alternatives of the potential sites. Table 3.2: Data required for RETScreen- SHP analysis of the sites in Giba & Worie subbasins 13 1 CF=Cross flow Giba Giba-Site Name Suluh Genfel-1 Genfel-2 Genfel-3 Genfel- 4 Agulae Meskila-1 Meskila-2 Meskila-3 Ghiba Coordinate (x,y) (UTM, WGS84) 555000 570400 573500 572500 553600 556400 543000 533000 531300 537300 1535700 1543000 1544400 1433400 1515200 1510400 1486300 1487700 1487350 1494350 Catchment Area (km2) Giba Area ( 5113 km2) 617.31 173.395 21.673 133.035 687 493.903 160.374 508.777 134.647 3112 Gross Head (m) 40 87 380 480 96 177 45 45 80 94 Design flow(m3/s) 1.619 1.316 0.102 1.018 3.733 1.657 0.342 2.078 2.274 24.502 Turbine type CF1 Turgo Pelton Pelton Turgo Turgo CF CF Turgo Francis Dam crest length (m) 25 18 23 30 32 28 22 31 34 64 Road Length (km) 5.08 6.16 5.65 5.25 8.80 4.77 6.34 14.74 15.27 1.886 Canal length in rock (m) 1100 2250 1400 1800 1858 1280 160 1500 240 19200 Penstock length (m) 120 100 900 1000 1762 555 340 200 130 1300 Grid Center Negash Wukro Wukro Wukro Mekelle Mekelle Mekelle Mekelle Mekelle Mekelle Transmission line (km) 9.8 19.08 15.08 12.60 14 15.30 7.81 17.18 18.60 12.64 Worie Worie-Site Name W-1 W-2 W-3 W-4 W-5 W-6 W-7 W-8 W-9 W-10 Coordinate (x,y) (UTM, WGS84) 459120.5 462272 485156.5 473729.33 466998 491090.5 510161.33 470660.75 488043 498996.8 1512381 1517303 1524893 1522271 1519833 1527699 1531977 1520017 1536623 1529493 Catchment Area (km2) Worie area (5379 km2) 3212 2972 1904 2487 2954 1890 777 2503 430 1677 Gross head (m) 96 71 83 94 55 33 27 25 167 27 Design flow (m3/s) 20.512 18.980 11.860 15.882 18.864 11.772 4.277 15.984 2.273 9.231 Turbine type Turgo Turgo Turgo Turgo Turgo Francis CF Francis Turgo CF Dam crest length (m) 128 120 68 84 104 54 32 98 45 48 Road length (km) 2.111 3.532 0.564 2.106 1.049 0.601 1.585 1.324 2.854 2.135 Canal length in rock (m) 305 630 445 365 587 290 500 445 730 480 Penstock length (m) 110 260 200 140 420 100 265 350 500 340 Grid Center Abi-adi Abi-adi Maykinetal Abi-adi Abi-adi Maykinetal Maykinetal Maykinetal Maykinetal Maykinetal Transmission line (km) 41.98 40.01 21.54 31.52 36.41 16.07 15.40 31.14 12.12 12.02
- 7. Journal of Energy Technologies and Policy www.iiste.org ISSN 2224-3232 (Paper) ISSN 2225-0573 (Online) Vol.4, No.8, 2014 3.2.1. The Start Sheet and the Energy Model Sheet General information about the project is entered to the Start Sheet (Figure 3.1). Figure 3.1: General layout of RETScreen and the Start Sheet Grid type can be central grid, from the two analysis types Method 2 are selected. Heating value is a measure of energy released when fuel is completely burned. For hydropower projects, this value is important only if emission analysis will be carried out. In this study, emission analysis was not carried out. The flow duration curve entered to the energy model sheet is used to calculate the energy output of the project. Taking this data as input to the Energy mode sheer, the installed capacity and annual energy production is estimated. 3.2.2. Cost Analysis Sheet and Hydro Formula Costing Method Tool After filling the energy model sheet, the software directs the user to complete the cost analysis sheet. Since RETScreen is developed in Canada, the formula method uses Canadian projects as a baseline and then allows the user to adjust the results for local conditions. There are tuning factors to the local area (Ethiopia), the costs between Ethiopia and Canada is tuned by the cost ratios of labour, equipment, fuel, equipment manufacture coefficient and exchange rates. The civil works measured from a 10 m contour interval DEM generated were used for cost analysis of the project. The hydro formula costing method tool estimates the project costs using the empirical formulae derived from the costs of numerous completed small hydro projects. Since costs associated with various construction items, engineering and development works are not available for this project, hydro formula costing method is used to estimate total initial costs. However, RETScreen cannot automatically use this calculated total initial costs in financial analysis and requires the user to externally input this value into the cost analysis worksheet. Thus, the total initial costs calculated by hydro formula costing method should be entered into one of the cost item listed in the cost analysis sheet. Assume 0.2% of the total investment cost can be allocated as operation and maintenance costs. Considering the other sources of annual costs such as labor cost or insurance premium, 0.4% of the total investment cost was used for total annual costs in this study. It should be noted that interest and depreciation costs are not 14
- 8. Journal of Energy Technologies and Policy www.iiste.org ISSN 2224-3232 (Paper) ISSN 2225-0573 (Online) Vol.4, No.8, 2014 accepted as annual costs by RETScreen. RETScreen suggests a value between 4 -7% for allowable tunnel head loss factor. If the allowable tunnel head loss factor is chosen as 5% as suggested by RETScreen (2004), the tunnel diameter and the tunnel cost is automatically calculated. Allowable penstock head loss factor is 1-4% is suggested by RETScreen (2004). 3.2.3. Financial Viability Analysis Sheet and Results The financial parameters entered to the software are given in Table 3.5. Inflation rate, discount rate, project life, effective income tax rate, and more over the following information were used: • Fuel cost escalation rate was taken as 0% since hydropower plants do not consume fuel to generate electricity. Fuel is used only in the construction period to run the construction machinery. Therefore, the effect of this rate can be assumed to be negligible. • Depreciation period is equal to the project life which was taken as 30 years. The percentage of total costs to be depreciated (depreciated tax basis) is 95%. The remaining 5% accounts for the cost items that cannot be depreciated. Depreciation method is selected as straight line. After analyzing the annual energy production with the selling price as benefit vis-à-vis the costs estimated, RETScreen displays outputs of the financial analysis: total initial and annual costs (same as displayed in cost analysis model), the savings, income summary, financial viability parameters, yearly cash flow table and cumulative cash flow graph. The financial viability information generated from the RETScreen decision support tool are equity, assets, payback periods, net present value (NPV), internal return rate (IRR) and Benefit-Cost ratio. The financial viability of the SHP potential sites are decided based on the Benefit-Cost ratio, net present value (NPV), internal return rate (IRR) and simple payback period. Projects are called feasible when benefit-cost ratio is greater than one, positive net present value(NPV) and Internal Return Rate (IRR) greater than 5% (National Bank of Ethiopia fixed interest rate), and short period of payback, i.e. the time taken to return the expenditure for the project. However, if the value of benefit-cost ratio is approximately rounded off to unity, it can be taken as feasible. The financial analysis of the project indicates that whether the project is profitable. Benefit-Cost Ratio is greater than one whereas the Benefit-Cost Ratio of Genfel-1 is 0.78 (Table 3.5), it can be rounded off to one and it is considered as feasible. Therefore, Meskila-1 SHP project is worth investing. Cumulative cash flow is negative until the 2 year. After the 2 year it turns positive meaning that the project starts making profit. Based on the RETScreen generated results Meskila-1, Meskila-2, Meskila-3, Genfel-1, Genfel-2, and Suluh are feasible from Giba Subbasin, but Genfel-3, Genfel-4, Agulae and Giba dam site in Giba subbasin and except W- 7 in Worie subbasin are not viable. The annual energy generation, costs, financial viability parameters and feasibility of the hydro sites are summarized in Table 3.5. Since the hydropower potential sites of Giba subbasin were selected from the tributaries with hills/waterfalls, most of the hydro sites are feasible where as in Worie the hydro potential sites were selected from DEM derived head and specific yield discharge. All of potential sites were laid on the main stream and the head is found after going very long distance from the intake site to the power house, this was made very expensive and difficult for run-of-river plants; consequently, almost all of the hydro sites were not feasible. From this more detailed study, the potential sites top-ranked and arranged orderly in the previous studies of the same hydro sites were found with different results in this study. 15
- 9. Journal of Energy Technologies and Policy www.iiste.org ISSN 2224-3232 (Paper) ISSN 2225-0573 (Online) Vol.4, No.8, 2014 Table 3.5: Financial analysis results and viability of the sites Conclusion Based on the research findings the technical and economic feasibility of SHP potential sites of Giba and Worie subbasins of Tekeze River were obtained. For analysis ten potential sites were verified for each catchment. The discharge for the ungauged hydro sites was estimated using the runoff coefficients and area ratios of the stream gauging stations and ungauged potential sites. Based on the available gross head, estimated discharge, and by determining hydraulic losses and turbine characteristics; the amount of annual energy generation was produced from the selected hydro sites. 2 Simple payback period > project life, i.e. Deficit not viable 16 Site Power capacity (kW) Electricity exported to grid (MWh) Total initial costs (ETB) Annual costs (ETB) Energy production costs(ETB/MWh) Annual savings and income (ETB) Simple payback (yr) Benefit- Cost Ratio NPV (ETB) IRR (%) Viability Site Name Giba Suluh 439 2,044 13,581,831 193,375 791.25 2,942,777 4.6 1.84 10,248,337 17.3 Feasible Genfel-1 821 3,177 48,829,728 695,225 1,829.97 4,574,628 10.7 0.78 Negative 6.4 Feasible Genfel-2 273 1,113 3,325,687 47,350 355.68 1,602,992 2.1 4.12 9,330,567 39.1 Feasible Genfel-3 3,610 14,025 432,909,843 6,163,662 3,675.00 20,195,535 21.4 0.38 Negative 1.1 Not feasible Genfel-4 2,627 10,577 453,784,076 6,460,864 5,107.94 15,230,650 29.8 0.25 Negative -0.8 Not feasible Agulae 2188 9,327 233,513,937 3,324,713 2,980.64 13,431,294 17.4 0.47 Negative 2.5 Not feasible Meskila- 1 104 351 817,178 11,635 277.24 505,334 1.6 5.29 3,154,208 50.3 Feasible Meskila- 2 634 2,017 24,455,758 348,195 1,443.40 2,904,758 8.4 1.00 Negative 8.8 Feasible Meskila- 3 1,320 11,076 130,722,379 1,861,193 1,405.10 15,949,922 8.2 1.03 2,988,481 9.1 Feasible Giba dam site 17,748 76,825 8,590,302,241 122,306,578 12,930.08 110,627,412 >proj.life2 0.04 Negative -2.1 Not feasible Site No. Worie W-1 14,798 46,530 6,267,137,494 89,229,939 16,035.76 67,003,019 >proj.life 0.01 Negative -7.1 Not feasible W-2 10,135 34,803 4,292,468,987 61,115,101 14,683.75 50,116,994 >proj.life 0.03 Negative -6.7 Not feasible W-3 7,332 29,554 2,468,059,700 35,139,618 9,942.44 42,557,615 >proj.life 0.08 Negative -4.7 Not feasible W-4 11,187 38,415 5,156,273,410 73,413,733 15,980.55 55,317,034 >proj.life 0.02 Negative -7.1 Not feasible W-5 7,802 26,792 3,064,112,472 43,626,068 13,615.84 38,581,139 >proj.life 0.03 Negative -6.3 Not feasible W-6 2,835 8,544 477,178,577 6,793,949 6,649.50 12,302,875 >proj.life 0.17 Negative -2.5 Not feasible W-7 783 2,702 44,872,339 638,881 1,977.54 3,890,162 11.5 0.72 Negative 5.7 Feasible W-8 2,833 8,294 529,847,907 7,543,842 7,605.26 11,944,057 >proj.life 0.14 Negative -3.2 Not feasible W-9 2,754 9,472 396,800,976 5,649,553 5,015.72 13,562,954 29.3 0.26 Negative -0.7 Not feasible W-10 1,691 5,830 210,218,733 2,993,042 4,292.69 8,395,695 >proj.life 0.32 Negative 0.2 Not feasible
- 10. Journal of Energy Technologies and Policy www.iiste.org ISSN 2224-3232 (Paper) ISSN 2225-0573 (Online) Vol.4, No.8, 2014 Having the civil works with the consideration of terrain conditions, electromechanical equipment and financial parameters of the project life; using RETScreen analyzing the energy output generation with the initial, annual and total costs; as a result, the savings, income summary, cash flow, and financial viability was generated. The financial viability of the SHP potential sites was decided based on the Benefit-Cost ratio, net present value (NPV), Internal Return Rate (IRR) and simple payback period. Results of the RETScreen analyses revealed that Meskila-1, Meskila-2, Meskila-3, Genfel-1, Genfel-2, and Suluh are feasible with total power of 3591kW from Giba subbasin, but Genfel-3, Genfel-4, Agulae and Giba dam site in Giba subbasin and except site W-7 (783kW) in Worie subbasin are not viable. In general, most of the rivers in the study area are intermittent and it has been observed that dependable flow in the basin without storage is low. Therefore, run-of-river plants are not feasible. This is because, though there is suitable gross heads for SHP development, there is high variability of stream flows. References Canada labor cost, [Online] Available at: http://www.tradingeconomics.com [Accessed 20 November 2013]. Central Statistics Agency of Ethiopia, CSA, [Online] Available at: http://www.csa.gov.et [Accessed 20 17 November 2013]. Diesel Prices, [Online] Available at: http://www.mytravelcost.com/petrol-prices/ [Accessed 20 November 2013]. EEPCo, 2009/2010. Facts in berief. Ethiopian Electric Power Corporation Corporate Relations, Addis Ababa. Maidment, D.R, 1993. Handbook of Hydrology, McGraw-Hill Inc., USA National Bank of Ethiopia, NBE, [Online] Available at: http://www.nbe.gov.et [Accessed 20 November 2013]. NEDECO, 1998. Tekeze River Basin Integrated Development Master Plan Project, Vol 5 & 6. Ministry of water resources, Addis Ababa. Petras. P., Dumbrauskas A., Kvaraciejus A., Vyciene G . , 2011. Tools for Small Hydropower Plant Resource Planning and Development: A Review of Technology and Applications. Water and Land Management Faculty of the Lithuanian University of Agriculture, Kaunas, Akademija, 10 Universiteto Str, LT-53361. Lithuania. Ravn, J., 1992. Planning and Implementation of Hydropower Projects. Norwegian Institute of Technology, Division of Hydraulic Engineering. RETScreen, [Online] Available at: http://www.retscreen.net/ang/home.php [Accessed 26 May 2013]. RETScreen, 2004. Clean Energy Decision Support Centre. Clean Energy Project Analysis: RETSCREEN® Engineering & Cases Textbook. Small Hydro Project Analysis Chapter. Natural Resources Canada, Ottawa, Canada. RETScreen, 2005. Clean Energy Project Analysis, “RETScreen® Engineering and Cases Textbook” Third Edition, Minister of Natural Resources Canada. RETScreen, 2010. “RETScreen Software Help,” Integrated to the software. Solomon, S., 1998. Hydropower of Ethiopia; status potential and prospects, EACE, bulletinVol.1, no.1. [Online] Available at: http://www.ethiopians.com/engineering/hydropower_of_ethiopia.htm [Accessed 15 June 2013]. Wilson, E. M., 2000. Assessment Methods for Small-Hydro Projects; Technical Report; the International Energy Agency: Paris, France.
- 11. The IISTE is a pioneer in the Open-Access hosting service and academic event management. The aim of the firm is Accelerating Global Knowledge Sharing. More information about the firm can be found on the homepage: http://www.iiste.org CALL FOR JOURNAL PAPERS There are more than 30 peer-reviewed academic journals hosted under the hosting platform. Prospective authors of journals can find the submission instruction on the following page: http://www.iiste.org/journals/ All the journals articles are available online to the readers all over the world without financial, legal, or technical barriers other than those inseparable from gaining access to the internet itself. Paper version of the journals is also available upon request of readers and authors. MORE RESOURCES Book publication information: http://www.iiste.org/book/ IISTE Knowledge Sharing Partners EBSCO, Index Copernicus, Ulrich's Periodicals Directory, JournalTOCS, PKP Open Archives Harvester, Bielefeld Academic Search Engine, Elektronische Zeitschriftenbibliothek EZB, Open J-Gate, OCLC WorldCat, Universe Digtial Library , NewJour, Google Scholar