Factor analysis of service quality in university libraries in sri lanka
•
1 gefällt mir•593 views

International peer-reviewed academic journals call for papers, http://www.iiste.org/Journals

Empfohlen
Empfohlen
Weitere ähnliche Inhalte
Was ist angesagt?
Was ist angesagt? (20)
Andere mochten auch
Andere mochten auch (14)
Ähnlich wie Factor analysis of service quality in university libraries in sri lanka
Ähnlich wie Factor analysis of service quality in university libraries in sri lanka (20)
Mehr von Alexander Decker
Mehr von Alexander Decker (20)
Kürzlich hochgeladen
Kürzlich hochgeladen (20)
Factor analysis of service quality in university libraries in sri lanka
- 1. Industrial Engineering Letters www.iiste.org ISSN 2224-6096 (Paper) ISSN 2225-0581 (online) Vol.3, No.5, 2013 40 Factor Analysis of Service Quality in University Libraries in Sri Lanka – An Application of Servqual Model Prof. (Dr)T.Velnamby, Dean-Faculty of Management Studies &Commerce, university of Jaffna, Sri Lanka, tvnampy@yahoo.co.in Mr.S.Sivesan, Lecturer, Department of Marketing, University of Jaffna, Sri Lanka, sivesanputtur@yahoo.co.in Abstract This research paper seeks to advance the application of SERVQUAL tool developed by Parasuraman et.al (1985) for measuring services quality. In Sri Lanka, realizing the necessity of complying with customer perception of high quality service, have begun to search for alternative ways to satisfy their customer on the basis of service quality. This study, therefore, examines the factors determining the service quality of university libraries. . Primary and secondary data were used to conduct the study. Sophisticated statistical model as “Exploratory Factor Analysis” (EFA) has been used. The study reveals that four factors extract from the analysis that together accounted 50.317% of the total variance. These factors were categorized as convenient opening hours, current information, collection comprehensiveness and convenient access to collection. Keywords: Service quality, SERVQUAL model, convenient, current information, comprehensiveness, and convenient access 1.0 Background of Study The turn of the century has been propounded changes in the global economy. Services have played a crucial part in these changes, because services are becoming the way organizations meet with their markets (Irons, 1997). Organizations have discovered that their survival no longer exclusively depends on the products they offer, but also on the additional offerings they make to their customers that differentiate them from their competitors. Innovative organizations, offering new services as well as unique customer services, are now succeeding in markets where established organizations have failed (Lovelock and Patterson, 1998). Service quality is a relativistic and cognitive discrepancy between experience-based norms and performances concerning service benefits (Roest and Pieters, 1997). In modern business world, service quality has become one of the most popular marketing issues. It is an approach that infiltrates many academic disciplines, such as psychology, business and library science. As a result, many commercial service quality studies have been commissioned by numerous service providers (Azar 2007; Badri, Abdulla & Al-Madani 2005; Mazzeo 2004; Sivadas & Prewitt-Baker 2000), as it is critical for such service providers to prove their strength in business performance in a competitive business environment (Chowdhary & Prakash 2007; Mehta, Lalwani & Soon 2000; Park 2007; Shemwell, Yavas & Bilgin 1998). Universities in Sri Lanka are government-owned institution. University libraries in Sri Lanka are managed within the framework of the Universities Act No. 16 of 1978. Each national University has a library, which is considered as one of the main departments in that university. It is administered by a librarian, who is one of the principal officers of the University, and supported by professionals and supporting staff. The mission of the university libraries is to provide the required support for teaching, learning and research by performing a variety of functions, such as the provision of textbooks, supplementary reading and reference materials, periodicals, and recreational resources. Objective of the study is to identify the factors which determine the service quality of the library services. In other words, the purpose is to find out the dimensionality of the library service being provided by the university libraries so that the service quality model for the university libraries can be empirically worked out. 2.0 Literature Reviews In the past three decades, although more and more research findings have appeared concerning quality, it is still worth noting here that are several distinct conceptualizations of quality (Holbrook, 1994). In the present world, traditional service providing model and role of university libraries among the user or customer are changed to technological development. Silva (1995) stated that Sri Lankan University libraries fail to meet the customer expectation and also he articulates that lack or inadequate fund provided by government. However, Nanayakkara (2008) expressed that the tangible and
- 2. Industrial Engineering Letters www.iiste.org ISSN 2224-6096 (Paper) ISSN 2225-0581 (online) Vol.3, No.5, 2013 41 intangible services available at University libraries in Sri Lanka are of a high standard compared to other libraries on the Indian subcontinent. One of the main research instruments for measuring quality in service industries is the servqual model, developed by Parasuraman Berry and Zeithaml and Parasuraman, Zeithaml, and Berry (1985; 1988). Library quality has been assessed in terms of library collections–size, diversity and comprehensiveness of subject coverage (Dugan & Hernon 2002; Nitecki 1996). Hernon and Altman (1998) and Shi and Levy (2005) emphasized that most traditional statistics regarding libraries lack relevance and do not measure the library’s performance in terms of characteristics important to customers. These statistics have particularly failed to describe the performance of the library or to indicate whether or not the quality of the library is good, indifferent or bad. Dugan and Hernon (2002) perceive quality as a multi-faceted concept that focuses on collections, services and the place of the library in the learning process, within a given context. The level of service quality is represented by the gap between perceived and expected service. The servqual model is based on five service quality dimensions, namely tangibles (physical facilities, equipment and personnel appearance), reliability (ability to perform the promised service dependably and accurately), responsiveness (willingness to help customers and provide prompt service), assurance (knowledge and courtesy of employees and their ability to gain trust and confidence) and empathy (providing individualized attention to the customers). Service quality has three components viz. interaction quality (attitude, behavior, and expertise), physical environment quality (atmosphere, design, social factors) and outcome quality (waiting time, tangibles, and valence) (Brody and Cronin 2001). Sreetharan and Velnampy(2012) indicated that Patients’ perceptions about health care systems seem to have been largely ignored by health care managers in developing countries. Patients’ voice must begin to play a greater role in the design of health care service delivery processes in the developing countries. It should go without saying that customers are the lifeblood of all organizations, yet few companies seem to be fully capable of matching their performances to the needs of their customers, either in quality, efficiency or personal service. Zeithaml and Bittner (1996) expressed that customers have two types of expectation such as desired and adequate expectations. 3.0 Research Design 3.1 Data sources Given the nature of the present study, it was required to collect data from the primary and secondary sources. Primary data were collected through the questionnaire. Secondary data were collected from research studies, books, journals, newspapers and ongoing academic working papers. The collected data should be processed and analyzed in order to make the study useful to the practitioners, researchers, planners, policy makers and academicians. 3.2 Measures The questionnaire was administrated to users (students, academic staff, and non- academic staffs) of the university library. Questionnaire is prepared with seven point Likert- scaling system. In a way, qualitative data converted into quantitative and then details analysis was made with appropriate statistical tools in order to prove the objective and to test the hypotheses. Questionnaire is designed to gather the data. Questionnaire consists of twenty three (23) statements to measure the service quality which can be measured through staff approachability, complaint responsiveness, courtesy of the staff, personal attention, supportive atmosphere, staff knowledge ability, promptness of the staff, reflective and creative place, convenient access to collection, collection comprehensiveness, current information, good ventilation, good functional furniture, good lighting facility, access computer, e- journal access, customer educational programme, convenient opening hours, error free record in the system, helpful directional signs, need oriented resources and air condition. Sampling
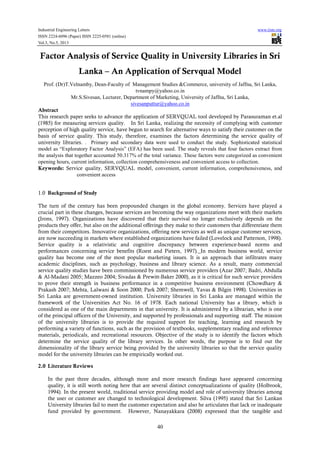
- 3. Industrial Engineering Letters www.iiste.org ISSN 2224-6096 (Paper) ISSN 2225-0581 (online) Vol.3, No.5, 2013 42 Nowadays, thirty one libraries attached to the national universities, seven postgraduate institutions and nine other higher education institutes (University Grants Commission of Sri Lanka Statistics 2007), but we have selected three universities library users (University of Jaffna, University of Kalaniya and Vavuniya Campus) for this study. Following table shows the sampling. Table No-01 Details of sample Ser.No Name of University No of Participants Number of respondents Percentage 01 University of Jaffna 100 87 87% 02 University of Kalaniya 100 71 71% 03 Vavuniya Campus 100 74 74% Total 300 232 Figure 01: Details of sample Using the random sampling technique, a total of three hundred library users (300) were selected as a sample of the study from three universities in Sri Lanka. Two hundred and thirty two (232) respondents completed the questionnaire and the rest did not return. 4.0 Results and Discussion 4.1 Reliability It is important to test the reliability and validity of the instrument. The internal reliability of the items was verified by computing the Cronbach’s alpha. Nunnally (1978) suggested that a minimum alpha of 0.7 sufficed for early stage of research. The Cronbach alpha estimated for each dimension of service quality in Sri Lankan universities are given by Table 02. Series1, University of Jaffna, 37.50, 38% Series1, University of Kalaniya, 30, 30% Series1, Vavuniya Campus , 32, 32% University of Jaffna University of Kalaniya Vavuniya Campus
- 4. Industrial Engineering Letters www.iiste.org ISSN 2224-6096 (Paper) ISSN 2225-0581 (online) Vol.3, No.5, 2013 43 Table No-02 Reliability Statistic – Measure of Service Quality S.No Dimensions of Service Quality Cronbach’s Alpha if item Deleted 01 Staff approachability .929 02 Complaint responsiveness .911 03 Courtesy of the staff .909 04 Personal attention .911 05 Supportive atmosphere .905 06 Staff knowledge ability .938 07 Promptness of the staff .923 08 Reflective and creative place, .925 09 Convenient access to collection .931 10 Collection comprehensiveness, .947 11 Current information .966 12 Good ventilation, .897 13 Good functional furniture, .967 14 Good lighting facility .978 15 Access computer .934 16 e- journal access .899 17 Customer educational programme .925 18 Convenient opening hours .976 19 Error free record in the system .891 20 Helpful directional signs .879 21 Need oriented resources .929 22 Air condition .987 23 Audio visual equipment .978 Alpha value greater than 0.7 are acceptable evidences of dimension reliability (Nunnally, 1978, George and Mallery, 1995). In this case, Alpha values for the overall scale is high, as reliability coefficients for dimension of service quality exceed the 0.7 cut off recommended by Nunnally, 1978 and Hair et al., 1988.
- 5. Industrial Engineering Letters www.iiste.org ISSN 2224-6096 (Paper) ISSN 2225-0581 (online) Vol.3, No.5, 2013 44 4.2 Validity An important aspect of increased rigor in conducting scientific research in the modern positivist paradigm is the testing for content and convergent validity. The Content validity ensures that the measure includes an adequate and representative set of items that tap the domain of the concept (Malhothra 2005,&2004, Warnakulasuriya, 2009). An exact literature review was carried out to ensure the content validity of the both construct. 4.3 Factor Analysis An Exploratory Factor Analysis (EFA) of the factor structure of the SERVQAL scale used was undertaken with SPSS to examine the factor structure of variable. The EFA procedure employed is “Principle components method” for extraction with “Varimax rotation” and factors with eigen values greater than one were alone retained (Hair, Anderson,Tatham,and Back,1998). KMO and Bartlett’s test Kasier – Meyer – OlKin (KMO) test assist to measure sample adequacy. Kaiser (1974) recommends accepting values of greater than 0.5. As per KMO measure, a measure of > 0.9 is marvelous,>0.8 is Meritorious, >0.7 is middling, > 0.6 is mediocre,> 0.5 is miserable and < 0.5 is unacceptable. Table No -03; KMO and Bartlett’s test Kaiser –Meyer – Olkin Measure of sampling adequacy .930 Bartlett’s test of Appox Chi Square Sphericity df Sig 19334.492 253 .000 In the present study, value of sampling adequacy is 0.930, which falls into the range of being superb. So, we should be confident that factor analysis is appropriate for these data. In this study, the data within this study returned a significance value of 0.00, indicating that the data was acceptable for factor analysis. After examining the reliability, validity of the scale and testing appropriateness of data as above, we carried our factor analysis to measure the service quality. For this, we employed Principal Component Analysis (PCA) followed by the varimax rotation, (Generally, researchers’ recommend as varimax). On conducting EFA by way of principal component analysis method (PCA), four eigen value are extracted sums of suquared loadings total, exceeded one with percentage cumulative variance explained 50.317 in case of measure of service quality. Table No -04; Total Variance Explained Compon ent Initial Eigen Values Extraction Sums of Squared loading Rotation Sums of Squared loading Total % of variance cumulati ve Total % of variance cumulat ive Total % of variance Cumulati ve 1 7.290 31.696 31.696 7.290 31.696 31.696 3.730 16.219 16.219 2 1.739 7.560 39.256 1.739 7.560 39.256 3.340 14.523 30.742 3 1.317 5.725 44.981 1.317 5.725 44.981 2.553 11.099 41.842 4 1.227 5.336 50.317 1.227 5.336 50.317 1.949 8.475 50.317 On conducting EFA by way of Principal Component Analysis method, four Eigen values are extracted whose extraction sums of squared loadings total, exceeded one with percentage cumulative variance explained was 50.317in case of service quality. Factor one explains 31.696% of total variance. It should be clear that the first few factors explain relatively large amount of variance whereas subsequent factors explain only small amount of variance. Eigen value for factors is higher than one. eigen values associated with these factors are displayed in the columns labeled Extraction Sums of Squared Loadings.
- 6. Industrial Engineering Letters www.iiste.org ISSN 2224-6096 (Paper) ISSN 2225-0581 (online) Vol.3, No.5, 2013 45 Table No -05: Total Variance Explained Se.No Initial Extraction Q1 1.000 .435 Q2 1.000 .414 Q3 1.000 .530 Q4 1.000 .469 Q5 1.000 .343 Q6 1.000 .654 Q7 1.000 .545 Q8 1.000 .739 Q9 1.000 .484 Q10 1.000 .335 Q11 1.000 .690 Q12 1.000 .513 Q13 1.000 .536 Q14 1.000 .488 Q15 1.000 .378 Q16 1.000 .487 Q17 1.000 .683 Q18 1.000 .597 Q19 1.000 .343 Q20 1.000 .484 Q21 1.000 .550 Q22 1.000 .464 Q23 1.000 .412 Above Table clearly shows communalities before and after extraction. Principal component analysis works on the initial assumption that all variance is common; therefore, before extraction the communalities are all 1. The communalities in the column labeled Extraction reflect the common variance in the data structure.
- 7. Industrial Engineering Letters www.iiste.org ISSN 2224-6096 (Paper) ISSN 2225-0581 (online) Vol.3, No.5, 2013 46 Table No -06: Total Variance Explained Component 1 2 3 4 Q18 .800 Q7 .684 Q16 .647 Q13 .638 Q12 .579 Q21 .550 Q14 .459 Q11 .677 Q17 .661 Q4 .567 Q3 .523 Q15 .516 Q1 .514 Q5 .496 Q8 .429 Q10 .833 Q20 .647 Q19 .747 Q9 .648 Q2 .645 Q22 .586 Q6 .543 Q23 .427 Table 06 shows that factors were divided into the four groups. Each of four service quality factors listed in table No -06 is labeled according to the name of the value that loaded most highly for those service quality. It is worth declaring out here that factor loading greater than 0.30 are considered significant. 0.40 are considered more important and 0.50 or greater are considered very significant. The rotated (Varimax) component loadings for three components (factors) are presented in Table No- 05. For parsimony, only those factors with loadings above 0.50 were considered significant (Pal, 1986; Pal and Bagi, 1987; Hari,
- 8. Industrial Engineering Letters www.iiste.org ISSN 2224-6096 (Paper) ISSN 2225-0581 (online) Vol.3, No.5, 2013 47 Anderson, Tatham, and Black, 2003). The higher a factor loading, the more would its test reflect or measure as service quality (Pallant, 2005). Actually in this study, minimum factor component loadings of 0.421or higher are considered significant for EFA purposes. The services quality variable getting highest loading becomes the title of each factor of services quality. e.g. ‘Convenient opening hours’- title of service quality factor-I and the like. Group –I Convenient opening hours include the seven factors such as convenient opening hours, promptness of the staff, e-Journal access, good functional furniture, good ventilation, need oriented resources and good lighting facility with loading ranging from 0.8 to 0.459. Group- II current information consists of eight factors such as current information, customer educational programme, personal attention, courtesy of the staff, access computer, staff approachability, supportive atmosphere, and reflective and creative with loadings ranging from 0.677 to 0429. Group- III collection comprehensiveness includes three factors such as collection comprehensiveness, helpful directional signs and error free record in the system with loading ranging from 0.833 to 0647. Group - IV convenient access to collection includes five factors such as convenient access to collection, complaint responsiveness, air condition, staff knowledge ability and audio visual equipment with loading ranging from 0.648 to 0427. 4.3 Conclusion Today library introduces many new services either converting existing services into e- services or by developing and implementing entirely new services for searching, delivery and use of information. Such new or converted services include e.g. online service, portals, digitized collection, etc to enhance the quality of library services. Quality will be mainly defined by the speed and accuracy of reference and information delivery services, open access to both physical collection and online retrieval systems. The comprehensiveness and good support from library staff is most important needs in a library. The efficiency of background processes, convention of workshop, seminar, in service training of new technology introduced, refreshment course organized by library professional community are most essential for library to cope with globalization. Performance measurement and user survey can show whether a library is efficient and effective in delivering services. Reference Abdullah, F. 2006. The development of HEdPERF: a new measuring instrument of service quality for the higher education sector. International Journal of Consumer Studies, 30(6): 569-581. Adler, M & Ziglio, E. 1996. Gazing into the oracle: the delphi method and its application to social policy and public health. London: Jessica Kingsley. Akbaba, A. 2006. Measuring service quality in the hotel industry: a study in a business hotel in Turkey. International Journal of Hospitality Management, 25(2):170-192. Alba, JW & Hutchinson, JW. 1987. Dimensions of consumer expertise. Journal of Consumer Research, 13 (4): 411-454. Allport, G. 1961. Pattern and growth in personality. New York: Holt, Rinehart &Winston. Anderson, JC & Gerbing, DW. 1988. Structural equation modelling in practice: a review and recommended two-step approach. Psychological Bulletin, 103(3): 411-423. Anderson, PF. 1983,Marketing, scientific progress and scientific method. Journal of Marketing, 47: 18-31. Andreassen, TW. 2000. Antecedents to satisfaction with service recovery. European Journal of Marketing, 34(1/2): 156-175. Asquith, JAL. 1997. The effects of group size on the outcome of focus group sessions. Management Research News, 20(12): 1-15.
- 9. Industrial Engineering Letters www.iiste.org ISSN 2224-6096 (Paper) ISSN 2225-0581 (online) Vol.3, No.5, 2013 48 Athanassopoulos, AD. 2000. Customer satisfaction: cues to support market segmentation and explain switching behavior. Journal of Business Research, 47: 191-207. Azar, OH. 2007. Incentives and service quality in the restaurant industry: the tipping-service puzzle. MPRA. Available: http://mpra.ub.uni-muenchen.de/4457/1/MPRA_paper_4457.pdf (Accessed on 10 February 2008). Babakus, E & Boller, GW. 1992. An empirical assessment of the SERVQUAL scale. Journal of Business Research, 24(3): 253-268. Babakus, E & Mangold, WG. 1992. Adapting the SERVQUAL scale to hospital services: an empirical investigation. Health Services Research, 26(6): 767–786. Babakus, E., and G. W. Boller. 1992. An empirical assessment of the servqual scale. Journal of Business Research 24 (3): 253–268. Badri, MA, Abdulla, M & Al-Madani, A. 2005. Information technology center service quality assessment and application of SERVQUAL. International Journal of Quality and Reliability Management, 22(8): 819-848. Barsky, J. D., and R. Labagh. 1992. A strategy for customer satisfaction. The Cornell Hotel and Restaurant Administration Quarterly 35 (3): 32– 40. Bavakutty, M. and Majeed, K.C. Abdul. Methods for Measuring Quality of Libraries. New Delhi: Ess Ess Publications,2005. Carman, J. M. 1990. Consumer perceptions of service quality: An assessment of the servqual dimensions. Journal of Retailing 66 (1): Choi, T. Y., and R. Chu. 2001. Determinants of hotel guests’ satisfaction and repeat patronage in the Hong Kong hotel industry. International Journal of Hospitality Management 20 (3): 277–297. Churchill, G. A., and C. Surprenant. 1982. An Investigation into the determinants of customer satisfaction. Journal of Marketing Research 19 (4): 491–504. Cronin, J. J., and S. A. Taylor. 1992. Measuring service quality: A reexamination and extension. Journal of Marketing 56 (3): 55–68. Dugan, RE & Hernon, P. 2002. Outcomes assessment: not synonymous with inputs and outputs. The Journal of Academic Librarianship, 28: 376-380. Lewis, B.R. Managing Service Quality, In Managing Quality. New York: Academic Press, 1991; p234-235 Lovelock, C & Wright, L. 1998. Service marketing and management. New York: Prentice-Hall. Mazzeo, MJ. 2004. Competition and service quality in the U.S. Airline. Review of Industrial Organization, 22(4): 275-296 McMenemy, D. and Poulter, A. Delivering Digital Services: Handbook for Public Mehta, SC, Lalwani, AK & Soon, LH. 2000. Service quality in retailing: relative efficiency of alternative measurement scales for different product-service environments. International Journal of Retail & Distribution Management, 28 (2): 62-72. Nanayakkara, L. 2008. A comparative study on marketing of reader services in academic libraries in Asia: with special reference to India, Malaysia, Thailand and Sri Lanka. MLS thesis. University of Colombo. Oliver, RL & DeSarbo, WS. 1988. Response determinants in satisfaction judgments. Journal of Consumer Research, 14(4): 495-507. Oliver, RL. 1993. Cognitive, affective and attribute bases of the satisfaction response. Journal of Consumer Research, 20(3): 418-431. Oppenheim AN. 1992. Questionnaire design and attitude measurement. London: Pinter publishers. Padgett, D & Allen, D. 1997. Communicating experiences: a narrative approach.
- 10. Industrial Engineering Letters www.iiste.org ISSN 2224-6096 (Paper) ISSN 2225-0581 (online) Vol.3, No.5, 2013 49 Parasuraman, A, Zeithaml, VA & Berry, LL. 1985. A conceptual model of service quality and its implications for future research. Journal of Marketing. Peterson, R. Murphy, B. Holmgren, S. & Thibodeau, P. L. (2004). The LibQUAL+™ challenge: An academic medical center‘s perspective, Duke University. Journal of Library Administration, 40, 83-98. Raina, Roshan. Total Quality Management in Library and Information Services. New Delhi: Infuse Inc, 1999. P1-151. Ranganathan, S.R. Five Laws of Library Science. Ed.2. Bangalore: SRELS, 1988. Shim, W., McClure, C. R., & Bertot, J. C. (2001, December). Measures and statistics for research library networked services: ARL e-metrics phase II report. ARL: A bimonthly report, (no. 219). Retrieved June 5, 2007, from http://www.arl.org/ resources/pubs/br/br219/br219emetrics.shtml Sivadas, E & Prewitt-Baker, J. 2000. An examination of the relationship between service quality, customer satisfaction and store loyalty. International Journal of Retail and Distribution Management, 28(2): 73-82. Sreetharan.V and Velnampy.T.(2012), Service quality and customer satisfaction: a study of selected private hospitals in jaffna district, sri lanka, Proceedings of International Conference on Business Management. University of Sri Jeyawardenepure. Velnampy, S.Sivesan (2012), Determinants of Customers Relationship Marketing of Mobile Services Providers in Sri Lanka: An exploratory Factor Analysis, Industrial Engineering Letters, ISSN- 2224-6096, Vol.2, No.6, 2012, pp.10-15. Zeithaml,V.A, Bittner,M.J. (1996) Service Marketing,Mc Graw- Hill,New York.