A critical analysis of equity ownership structure on firm’s performance
•
1 gefällt mir•146 views


Empfohlen
Empfohlen
Weitere ähnliche Inhalte
Was ist angesagt?
Was ist angesagt? (18)
Andere mochten auch
Ähnlich wie A critical analysis of equity ownership structure on firm’s performance
Ähnlich wie A critical analysis of equity ownership structure on firm’s performance (20)
Mehr von Alexander Decker
Mehr von Alexander Decker (20)
A critical analysis of equity ownership structure on firm’s performance
- 1. Research Journal of Finance and Accounting www.iiste.org ISSN 2222-1697 (Paper) ISSN 2222-2847 (Online) Vol.5, No.11, 2014 223 A Critical Analysis of Equity ownership Structure on Firm’s Performance: Case of Publicly Listed Companies in Kenya) Gongera Enock George1 , Tom Ongesa Nyamboga2 1.Professor of Cooperative University College of Kenya 2.PhD. Candidate School of Business and Economics, Mount Kenya University Abstract The relationship of equity ownership mix and firm performance of a firm is an important area of study in the broader field of corporate finance which has received considerable attention in finance literature in the recent past. The objective of this study was to find out whether ownership identity has any influence in corporate performance of public companies listed in Nairobi Securities Exchange. The study was based on the Agency, Stewardship and Stakeholder theories which explained the interactions of different interested parties in the firm, conflicts that results and how they affect the performance of a firm. The target population of the study was public companies listed in Nairobi Securities Exchange and stratified random sampling design was used to identify and categories the firms, and then simple random sampling was used to identify the actual sample elements. A descriptive survey research design was primarily preferred as it was able to ensure proper construction of questions for soliciting required information, identification of individuals to be surveyed, means by which survey was conduted and summarizing of the data in a way that provided descriptive information. Data collection instrument used for the study include questionnaires with a guide, interviews and document analysis for secondary data derived from published company financial statement and Capital Market Authority periodic reports. For this study data collected was first be edited and then coded and categorized into different themes according to research variables. Qualitative data collected using the questionnaire was analyzed using descriptive statistics and represented in terms of tables, graphs and pie charts. Secondary data collected using content analysis was analyzed using inferential statistics in terms of correlation analysis application of Microsoft Excel analysis. Keywords: Equity ownership Culture, Firm Performance, Publicly Listed Companies in Kenya. 1.0 Background of the Study 1.0 Background of the Study Firm ownership structure, one of mechanism in corporate governance to facilitate increased efficiency, has been understood to affect firm performance for many years. A number of agency problems resulting from the separation of ownership from control still prevail in firms globally (Jensen and Meckling, 1976). Joint-stock companies are less efficient than private copartner companies because the directors would not watch over ‘other people’s money’ with ‘the same anxious vigilance’ as their own. The relationship between ownership structure and corporate performance are assumed to exist because ownership concentration and owner identity influence the incentives of each party within the firm, and thus influence the firm’s ability to solve agency problems. However, the relationship between ownership structure and firm performance remains blurred in previous studies. The effective corporate governance structures help to prevent creation conflict of interests between the directors and shareholders by making information conformity and balance. In other words, these structures motivate the management to take the necessary measures for increasing the validity of the firm. Therefore, the more yield of the firm requires the improvement of corporate governance mechanisms, since it may cause to decrease agency costs, higher evaluation of shares, therefore the better performance in long run. (Brown and Caylor, 2004) postulates that reasonable investors will ask, if good corporate governance leads to improve the performance of capital markets in terms of creation of balance between rights and responsibilities of effective actors of corporate and management. A variable of corporate governance is ownership structure. The relation between the ownership structure and the performance of the firm is an important and continued subject in the field of financial management of the companies and the texts of financial management (Ezazi et al, 2011). In evaluating this relationship, different aspects of ownership structure are considered, for example being managerial or non-managerial shareholders, shareholder concentration or dispersion, being whole or retail, being internal shareholders, internal (domestic) or being foreign shareholders, being institutional or individual shareholders. 1.1 Ownership Structure Company’s ownership structure can classically be examined along concentration and identity dimensions. Both of these have important implications for corporate governance. The identity of shareholders has important implications for corporate governance as shareholders differ with regards to their objectives, the manner in which they exercise their power and this is reflected in company strategy with regard to profit goals, dividends, capital structure and growth rates (Thomsen and Pedersen, 2000). (Van den Berghe and Levrau, 2007) pointed
- 2. Research Journal of Finance and Accounting www.iiste.org ISSN 2222-1697 (Paper) ISSN 2222-2847 (Online) Vol.5, No.11, 2014 224 out that “ownership structure matters to investors and creditors”. Primarily the driving factor is that some ownership types advocate for strong corporate governance that is seen to decrease financial risk. This is because putting perceived good governance mechanisms in place can boost a company’s capacity to attract capital. 1.2 Kenya Perspective Ownership structure to a great extent determines corporate governance mechanisms to be adopted by a firm. Kenya has witnessed spectacular business failures such as the brokerage houses, routine suspension listed companies from trading at NSE, compromised financial results released by firms in Kenya. As a result, this driving the demand for changes in governance mechanisms especially in Kenya capital markets as it directly impact of firm’s performance. Such high profile scandals, financial crises and institutional failures have brought corporate governance issues to the fore in Kenya and investors and general public are making in-depth scrutiny of equity shareholders behind every firm. 1.3 Statement of the Problem Firms listed in NSE not withstanding similar business environment and comparable sectoral background manifest different corporate performance. Kenya being an emerging market economy, widely dispersed corporate ownership is not the rule but the exception. What is prevalent are many firms with concentrated ownership. In such scenario the dominant shareholders have the capacity to directly control management (La Porta 1998). Hence dominant owner-managers to control corporate assets considerably greater, even, than their direct stock ownership rights would justify. As a result potential conflict of therefore tends to arise, not only between managers and shareholders but also between controlling shareholders on one hand and minority shareholders on the other. It is postulated that the relationship between controlling shareholder and firm performance depends on who the controlling shareholder is. This study therefore, sought to establish the influence of various forms of firm ownership structures through controlling shareholders on its performance. 2.0 LITERATURE REVIEW 2.1 Ownership Structure Ownership structure has a direct bearing on the risk-taking orientation of the firm. Agency problems arise whenever investment ideas and preferences of principals (owners) are at variance with those of their agents (Leech, 1991). (Xu and Wang, 1999) explored the relationship between ownership structure and firm performance. In their study it showed that mix and concentration of stock ownership is significant in explaining the performance of the firm. Their results highlighted the importance of large institutional shareholding, potential problems in an overly dispersed ownership structure and the inefficiency of state ownership. However, (Minguez and Martin 2007) in their study about degree of control and firms value found that; the degree of control has a positive effect on firm value. In an endogenous way, ownership by major shareholders revealed impact on firm value; however the opposite relationship did not show any significance. 2.2 Owner Identity and Firm Performance The existence of an owner identity effect is based on the argument that different owners may have different strategic goals and the controlling owner’s goal preference would influence the operation and performance of the firm. The most frequently defined identities are state, institution, foreign and dispersed ownership. 2.3 State Holding and Firm’s Performance The government is a major shareholder in a number of Kenya companies that serve the public interest. Besides legislation, the government can use shareholdings to influence enterprises and in the public interest. The government holds shares in the companies such as monopolies, for example in the field of infrastructure, where investment costs are so high that there are unlikely to be competitors, institutions that provide services for the state or organizations associated with the state as such holdings reduce the government’s costs. (Dewenter, 2001) pointed out that apart from government ownership, controlling stake also refers to the government’s ability to appoint board members, senior management and make major decisions such as contract awards, strategy, restructuring and financing, acquisitions and divestments. Market economists have argued that firms in the hands of the government are inferior in performance to firms in private hands. According to (Shleifer, 1998) this argument arises due to their institutional relationship with the government, the market structure in which they operate, or the management systems applied within them. They have also been criticized for being too risk- averse and lacking sufficient entrepreneurial drive. There have also been charges that certain government linked investments have been politically rather than commercially motivated. Thus it will result to the inefficient of financial system and give bad interpretation to the shareholders leading to poor financial performance. (Anderson, de Palma, and Thisse, 1997) argue that state-owned firms are less efficient because they are immune from capital market scrutiny. As a result, managerial performance is inadequately monitored. The public trading of shares establishes the possibility of takeover by outsiders, introduces the discipline of the managerial labor market, and provides the ability to link compensation to performance. As a result, when shares trade in the public equity markets, owners have enhanced capacity to spur greater managerial effort and accountability.
- 3. Research Journal of Finance and Accounting www.iiste.org ISSN 2222-1697 (Paper) ISSN 2222-2847 (Online) Vol.5, No.11, 2014 225 2.4 Institutional holdings and Firms Performance Institutional ownership is the fraction of a firm’s shares that are held by institutional investors such as banks, insurance companies, pension funds and other corporate investors. A distinguishing characteristic of institutional holdings with respect to certain other owner categories is that they act as intermediate owners for the final agents. Institutional investors’ gravitation toward stocks of companies that have better governance structure is likely to be stronger than that of individual investors as they have strong fiduciary responsibilities and therefore prefer prudent investments (Del Guercio, 1996). (Cornett et al 2007) in a research titled "the impact of institutional ownership on corporate operating performance" analyzed the relationship between institutional shareholders as one of the mechanisms of corporate governance and operational yield of large companies. They found a significant and positive relationship between the ratio of operating cash flow to sales as a measure of performance and the number and percentage of institutional shareholders as corporate governance mechanism. (Cornett et al 2007). 2.5 Foreign ownership and firm performance Foreign holdings constitute an important block of ownership among many firms in countries around the world. There are important governance implications for firms with and without foreign holdings which ultimately have a bearing on the performance of firms. These performance differences arise from the possession of certain firm specific advantages that accrue to the firm with foreign ownership. These firm specific advantages stem from advanced technological know-how, marketing and managing skills, export contacts, coordinated relationships with suppliers and customers and reputation (Aitken and Harrison, 1999). Empirical studies have found evidence supporting such a conjecture. For instance, using a sample of Canadian firms, (Boardman et al., 1997), find significant performance differences among multinational enterprises or their subsidiaries and domestic firms. Among Thai firms, (Wiwattanakantang, 2001) finds that foreign controlled firms exhibit superior performance. Apart from foreign direct investments (FDI), the other major source of foreign capital is foreign portfolio or institutional investment (FPI/FII). The level of ownership of the foreign owners in their subsidiaries constitutes also a decisive determinant of the degree and type of influence they impose on the firm performance and profitability. Majority ownership with more than 51 percent enables foreign firms to better implement decisions without being obliged to recourse the votes of the rest of the shareholders. Furthermore, a foreign company holding the majority ownership stakes in own subsidiary could better convey tangible and intangible structures of corporate structure and corporate governance. Economies of scale could arise considering the information utilization. Not least, having the majority ownership simplifies control and monitoring and therefore the agency costs are lowered (Boardman et al., 1997). (Douma et al., 2006) analyzed the effect of foreign ownership on the financial performance of Indian corporations with a distinction between foreign institutional and foreign corporate shareholders. This study found that foreign firms perform better than domestic ones in terms of Return On Assets (ROA) and Tobin’s Q. The same study concludes that ownership by foreign corporations has a positive and significant impact on both performance measures. When the results for foreign institutional investors were analyzed, no significant relationship was observed in terms of ROA. However, these investors have a positive and significant impact on Tobin’s Q and this impact is larger than that of foreign corporate shareholders. Thus, the researchers conclude that foreign institutional investors may be investing in firms that are already better in terms of market returns (Douma et al., 2006). As regards the effects of foreign investment on firm performance, it is argued that the observed higher productivity of foreign-owned firm because they are disproportionately concentrated in high productive sectors (Griffith (1999), by active monitoring, complementing the inadequate or inefficient monitoring of domestic institutions Choi and Yoo (2005), source of not only financing but also scarce monitoring skills and control-enabling property rights in emerging markets (Khanna and Palepu (1999), foreign shareholders outperform firm in which foreign shareholders exercise effective control (Chhibber and Majumdar (1999). 2.6 Diverse Shareholding and Firm’s Performance Firms with dispersed ownership are the firms that have low ownership concentration. When there is not a single large shareholder or a group of shareholders that can control the firm, the managers, under the assumption of information asymmetry and opportunity behavior, is believed to take control over the firm. (Wiwattanakantang, (2001) evaluates the impact of controlling shareholders on the financial performance of firms in Thailand. As a result of the analysis, he concludes that firms with controlling shareholders are better performers in terms of accounting-based measures, namely ROA and sales-assets ratio. However, no significant difference in performance is observed in terms of Tobin’s Q. (Thomsen and Pederson, 2000) concluded that when there is distributed ownership, the other shareholders cannot participate in the corporate policy, and this weakness is related to corporate governance mechanism can lead to reduction of optimal performance. From various studies it is perceived that due to agency problems, diverse ownership structure will not give adequate control to the shareholders due to lack of capacity and motivation to monitor management decisions (Jensen and Meckling, 1976). In dispersed ownership situations agency problem may arise in firms since shareholders' incentives and abilities to monitor management may be weakened. The fact that shareholders own
- 4. Research Journal of Finance and Accounting www.iiste.org ISSN 2222-1697 (Paper) ISSN 2222-2847 (Online) Vol.5, No.11, 2014 226 the firm, they do not feel any sense of control over it since their holding is not significant. In addition, shareholders usually invest in many firms in order to spread risk. Hence the motivation may not necessary be in the future of the firm but with short term capital gains and future dividend stream expectations. Moreover, dispersed shareholders may not have sufficient knowledge and information to make important decisions that will impact the future of the firm (lee, 2008). 2.7 Measure of Firm Performance Three main approaches to firm level performance are found in social science research: research based on market prices, accounting ratios and total factor profitability (Fama, 1998). Behavioral finance challenge market based evaluation on grounds that for long periods firms can trade on financial markets at prices that do not reflect their fundamental value. Moreover, is it clear that not all markets are efficient, particularly in developing and emerging countries with nascent stock markets that are known to be illiquid and lacking in breadth and depth. According to (Verweire & Berghe, 2005), Return on Equity (ROE) and Return On Asset (ROA) are two widely used profitability parameters’ to measure companies performance. With similar prominence is earning per share (EPS) and dividend per share (DPS). In this study Return on Assets (ROA), Return on Equity (ROE) and Price- Earnings Ratio (PE) parameters were used. ROA is the net profit as a percentage of the total assets and measures how much profits a firm can achieve using one unit of assets. It helps to evaluate the result of managerial decisions on the use of assets which have been entrusted to them. ROE is the net profit as a percentage of equity value measures the earnings generated by shareholders’ equity of a period of time, usually one year. It encompasses three main levers which management can utilize to ensure health of the firm: profitability; asset management; and financial leverage. Price–Earnings ratio is the ratio of market share price to earnings per share (Fama, 1998). 2.8 Summary of literature reviewed Literature reviewed gave mixed result with no clear cut line whether equity ownership structure influences financial performance of public companies. Some studies indicated that ownership structure only affect certain aspects of accounting performance but not value of the firm in the stock market. In other reviewed studies it was found that there was no systematic relationship between firms’ ownership structure and financial performance while (Miguez and Martin, 2007) had found that degree of ownership control had positive effects on the firm’s value. (Wiwattanakantang, 2001) compare the performance of the firms with an emphasis on different types of controlling shareholders. This comparison finds empirical evidence that family-owned companies, foreign- controlled companies and firms with more than one controlling shareholder are better in terms of ROA than firms without controlling shareholders. (Wiwattanakantang, 2001). It’s on the background of these mixed findings that this study was carried out with intention of shedding light into corporate finance of the effects of ownership structure on the performance of public companies listed in NSE. 2.9 Gaps filled by the study Performance measures used by previous researchers to measure financial performance of public companies with different ownership structures were mostly accounting based, such as return on sales, return on total assets, returns on equity, and operating efficiency measures and as such this study evaluated only return on equity and return on asset parameters. Beside the two, price-earning ratio market based performance measure was also used. In addition, though there has be an ongoing debate on corporate governance mechanisms stipulating various ownership and control structures, with reference to owner and manager relationships, little has been done to show how different ownership identities impacts firm performance. A good equity ownership structure should effectively monitor the board and the decision-making process. This should improve performance as the monitoring mechanisms ensure that shareholders' interests were being promoted. To meet the objectives of this study, this research, therefore sought to examine various types of ownership structures to find out what extent ownership structure influenced firm performance in an emerging market in the context of shareholder-manager and majority-minority shareholder relationships. The literature on ownership and performance has been limited and no systematic patterns of relationship between ownership identity and company performance has been uncovered in the NSE. This could be due to fact that different ownership structures responds to different set of objective which may not be necessarily maximizing share holder wealth in the long term. However there has been increasing empirical evidence on the effects of ownership structure and firm performance in developed markets but little attention have been given in emerging markets such as Kenya to examine dynamics of various ownership and their effects on company’s performance. This study bridged the above mentioned gaps. 3.0 RESEARCH METHODOLOGY 3.1 Research Design The study adopted a descriptive survey research design. Orodho (2003) and Kothari (2004) describe a descriptive survey design as a design that seeks to describe accurately the characteristics of a particular individual, situation or a group.
- 5. Research Journal of Finance and Accounting www.iiste.org ISSN 2222-1697 (Paper) ISSN 2222-2847 (Online) Vol.5, No.11, 2014 227 3.2 Target Population and Accessible Population Population refers to the totality of items under investigation. According to (Mugenda and Mugenda, 2003), the population should have some observable characteristics, to which the researcher intends to generalize the results of the study. In this study the target population consisted of all the companies listed in NSE. Data from NSE Listing manual year 2013 indicates that there are 61 listed companies which form the target population of this study (Appendix III). For the purpose of this study an accessible population was screened from the target population. Firms that satisfied the following selection criteria were considered for composing the accessible population: Company had not been suspended for trading during the period under review for more than one year, Firm was listed before 2008, company had not merged or demerged from another listed company during the period under review and it was not a cross-list from the region. Only 44 out of 61 firms satisfied the above criteria and were considered for the study (Appendix IV). Chief Financial Officers from each firm were the actual respondent. 3.3 Sample and Sampling frame Sampling is the process of selecting a number of individual for a study in such a way that the individuals selected represent the large group from which they were selected. Sampling involves the researcher securing a representative group that will enable the researcher to gain information about the population (Mugenda and Mugenda, 2003). A sample of 61% (sixty one percent) of the 44 firms will be extracted from the population for the purpose of the study. Thus, a sample of 27 companies was selected for the study due to time available for research and budgetary constraints. (Khan, 1993) warned that there is no fixed number of percentages of subjects that determine the size of an adequate sample. The ideal sample is large enough to serve as an adequate representation of the population about which the researcher wishes to generalize and small enough to be selected economically in terms of subject availability, expense in terms of time and money and complexity of data analysis. This study used both stratified sampling and simple random sampling. Stratified random sampling was used in each ownership identity structure to group respondents into four strata. These strata are state linked, Institution-linked, foreign linked and diverse linked ownership structures. Within each of the four strata, simple random sampling was carried out to identify firms to which respondents were sought and issued with questionnaires to respond to the research statements. Financial data on firms’ performance was the average of five years (2008-2012) while primary data on the ownership structure was gathered from publication publications from NSE and CMA. The controlling shareholders invested in the firm for more than 5 years were assumed to be strategic and long-term. TABLE I SAMPLING FRAME Item Target Population Sample (61% of the target Population) State linked 8 5 Institution Linked 20 12 Foreign Linked 13 8 Diverse Linked 2 2 Total 44 27 Source: Primary Data 3.4 Data collection Instruments The instrument used by the researcher in the study was document analysis, and questionnaires with guide, which is a list of questions to be answered by the respondents in order to get facts and information of interest to the researcher. According to (Mugenda and Mugenda, 2003), questionnaires are commonly used to obtain important information about a population under study. The questionnaires were administered during the period the month of July, 2013 and concluded in August 2013. 3.5 Data Collection Procedures Document analysis was used to get secondary data from published annual financial reports of the sampled companies. Financial data on firms’ performance are the average of five years (2008-2012) while primary data on the ownership structure was from publication publications from NSE and CMA. The controlling shareholders of more than 3 years investors were assumed to be strategic and long-term. Primary data to back, verify and supplement secondary data were collected through the administration of questionnaires to the sampled respondents. 3.6 Reliability According to (Mugenda and Mugenda, 2003) reliability is a measure of the degree to which a research instrument yields consistent results or data after repeated trials. An instrument is reliable when it can measure a variable accurately and obtain same results under same conditions over a period of time. In this study, split half
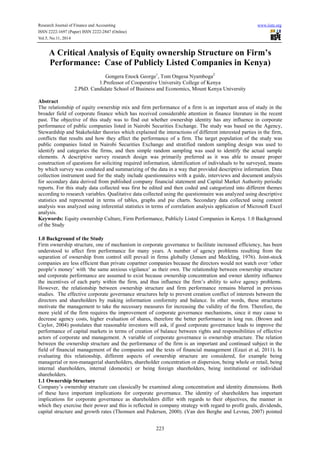
- 6. Research Journal of Finance and Accounting ISSN 2222-1697 (Paper) ISSN 2222-2847 (Online Vol.5, No.11, 2014 method was used to test the instruments, before the actual data collection was do inconsistencies in responses received, essential adjustments such as simplification of language, reframing of the questions and restructuring order of questionnaires was done to ensure that the final instruments would gathered the desired information. 3.7 Validity Validity measure ensures that the research tool is measuring what researcher intends to measure or want to measure. In this study, to validate the data collected, the researcher used other methods for instance comparing it with existing information in various publications. information gathered with various companies’ annual reports and also through observation to ensure desired consistency was achieved. The study also employed content validity method. The validity was tested through discussion with the three chief financial officers of three randomly selected firms, and their proposed changes to the instrument were incorporated to enhance its validity. 3.8 Data Processing and Analysis Data collected was analyzed using SPSS version 19 to generate descriptive and inferential statistics. Microsft Excel was also used to generate graphs and charts. The responses on the likert scale questionnaire were coded and input in the SPSS software. A simple correlat independent variable and the dependent variables. This helped to explain the magnitude and direction of relationship between the variables of the study through the use of correlation, coefficient o the level of significance. The basis of the relationships advanced in the model established how ownership structure influenced the performance of the firm. 3.9 Ethical Issues in Research The researcher endeavored to remain ethical in the every questionnaire. This served to explain the purpose of the study, seek for voluntary participation and assured the respondents of confidentiality. 4.0 RESEARCH FINDINGS AND DISCUSSION 4.1 Interpretation and discussion of results The sample population of the research was 27, therefore 27 questionnaires were administered and 27 questionnaires were analyzed because there was no non follow up of the remaining questionnaires after the first collection. Section B of the questionnaire requested the company ownership information from the respondents. Question B3 required the respondents to indicate the company ownership of their respective companie shows the final distribution of the findings. FIGURE I: PERCENTAGE OF EACH O Source: Primary Source In section C, the various variables that were used to measure the performance of these companies are: Return on Equity, Return on Asset and Price earning Ratio. The performance of the four categories of the companies is as below. 19% 44% 30% 7% 2847 (Online) 228 method was used to test the instruments, before the actual data collection was done. After assessing slight es received, essential adjustments such as simplification of language, reframing of the questions and restructuring order of questionnaires was done to ensure that the final instruments would gathered sures that the research tool is measuring what researcher intends to measure or want to measure. In this study, to validate the data collected, the researcher used other methods for instance comparing it with existing information in various publications. This was effectively done through thorough crosschecking the information gathered with various companies’ annual reports and also through observation to ensure desired consistency was achieved. The study also employed content validity method. The validity was tested through discussion with the three chief financial officers of three randomly selected firms, and their proposed changes to the instrument were incorporated to enhance its validity. Data Processing and Analysis was analyzed using SPSS version 19 to generate descriptive and inferential statistics. Microsft Excel was also used to generate graphs and charts. The responses on the likert scale questionnaire were coded and input in the SPSS software. A simple correlation model was used to measure the relationship between the independent variable and the dependent variables. This helped to explain the magnitude and direction of relationship between the variables of the study through the use of correlation, coefficient o the level of significance. The basis of the relationships advanced in the model established how ownership structure influenced the performance of the firm. The researcher endeavored to remain ethical in the conduct of the study. A letter of introduction was attached to every questionnaire. This served to explain the purpose of the study, seek for voluntary participation and assured 4.0 RESEARCH FINDINGS AND DISCUSSION Interpretation and discussion of results The sample population of the research was 27, therefore 27 questionnaires were administered and 27 questionnaires were analyzed because there was no non-response. This was so because the researcher made a of the remaining questionnaires after the first collection. Section B of the questionnaire requested the company ownership information from the respondents. Question B3 required the respondents to indicate the company ownership of their respective companie shows the final distribution of the findings. OWNERSHIP STRUCTURE In section C, the various variables that were used to measure the performance of these companies are: Return on ty, Return on Asset and Price earning Ratio. The performance of the four categories of the companies is as 44% State Linked Institution Linked Foreign Linked Diverse Linked www.iiste.org ne. After assessing slight es received, essential adjustments such as simplification of language, reframing of the questions and restructuring order of questionnaires was done to ensure that the final instruments would gathered sures that the research tool is measuring what researcher intends to measure or want to measure. In this study, to validate the data collected, the researcher used other methods for instance comparing it This was effectively done through thorough crosschecking the information gathered with various companies’ annual reports and also through observation to ensure desired consistency was achieved. The study also employed content validity method. The validity of the questionnaire was tested through discussion with the three chief financial officers of three randomly selected firms, and their was analyzed using SPSS version 19 to generate descriptive and inferential statistics. Microsft Excel was also used to generate graphs and charts. The responses on the likert scale questionnaire were coded ion model was used to measure the relationship between the independent variable and the dependent variables. This helped to explain the magnitude and direction of relationship between the variables of the study through the use of correlation, coefficient of determination and the level of significance. The basis of the relationships advanced in the model established how ownership conduct of the study. A letter of introduction was attached to every questionnaire. This served to explain the purpose of the study, seek for voluntary participation and assured The sample population of the research was 27, therefore 27 questionnaires were administered and 27 response. This was so because the researcher made a Section B of the questionnaire requested the company ownership information from the respondents. Question B3 required the respondents to indicate the company ownership of their respective companies. The figure below In section C, the various variables that were used to measure the performance of these companies are: Return on ty, Return on Asset and Price earning Ratio. The performance of the four categories of the companies is as
- 7. Research Journal of Finance and Accounting ISSN 2222-1697 (Paper) ISSN 2222-2847 (Online Vol.5, No.11, 2014 Table II : 5 Firms’ Years Percentage Return on Equity Identity 2008 State 0.12 Institutions 0.19 Diverse 0.15 Foreign 0.23 Market Average 0.17 Source: Primary Data TABLE III: 5 FIRMS’ YEARS PERCENTAGE Identity 2008 State 0.05 Institutions 0.09 Diverse 0.09 Foreign 0.14 Market Average 0.09 Source: Primary Data TABLE IV: 5 FIRMS’ YEARS PRICE- Price Earning Ratio Identity 2008 State 10.76 Institutions 19.76 Diverse 8.74 Foreign 24.29 Market Average 15.89 Source: Primary Data The analysis of the above tables is as below: (a) RETURN ON EQUITY VARIABLES (i) CORRELATION BETWEEN MARKET AVERAGE AND STATE LINKED FIRMS FIGURE III: ROE PERFORMANCE Source: Primary Data This output gives the correlation between the market average and the state linked Equity. They have a strong positive correlation with the coefficient correlation of (0.943), indicating that there is statistically significance (p<0.05) linear relationship between the variables. The state linked firms also pe below the average of the Market Price. (ii) CORRELATION BETWEEN THE MARKET AVERAGE AND LOCAL INSTITUTIONS LINKED FIRMS FIG IV: ROE Performance Correlations for Institution Linked Firms 2847 (Online) 229 : 5 Firms’ Years Percentage Return on Equity % Return on Equity 2009 2010 2011 2012 0.12 0.14 0.15 0.14 0.23 0.18 0.18 0.18 0.10 0.18 0.22 0.09 0.28 0.27 0.30 0.40 0.18 0.19 0.21 0.20 ERCENTAGE RETURN ON ASSET % Return on Asset 2009 2010 2011 2012 0.05 0.06 0.06 0.06 0.10 0.08 0.07 0.08 0.05 0.17 0.14 0.07 0.18 0.19 0.20 0.21 0.10 0.13 0.12 0.11 -EARNING RATIO 2008 2009 2010 2011 2012 10.76 8.09 10.58 5.32 5.88 19.76 14.24 18.43 11.16 10.09 8.74 11.71 8.68 3.25 4.95 24.29 13.22 12.53 9.56 9.56 15.89 11.82 12.56 7.32 7.62 The analysis of the above tables is as below: RETURN ON EQUITY VARIABLES CORRELATION BETWEEN MARKET AVERAGE AND STATE LINKED FIRMS ERFORMANCE CORRELATIONS FOR STATE LINKED FIRMS This output gives the correlation between the market average and the state linked firms based on the Return on Equity. They have a strong positive correlation with the coefficient correlation of (0.943), indicating that there is statistically significance (p<0.05) linear relationship between the variables. The state linked firms also pe below the average of the Market Price. CORRELATION BETWEEN THE MARKET AVERAGE AND LOCAL INSTITUTIONS FIG IV: ROE Performance Correlations for Institution Linked Firms www.iiste.org 5 Yr Average 0.13 0.19 0.15 0.30 0.19 5 Yr Average 0.06 0.08 0.10 0.18 0.11 5 Yr Average 8.13 14.74 7.47 13.83 11.04 CORRELATION BETWEEN MARKET AVERAGE AND STATE LINKED FIRMS firms based on the Return on Equity. They have a strong positive correlation with the coefficient correlation of (0.943), indicating that there is statistically significance (p<0.05) linear relationship between the variables. The state linked firms also perform CORRELATION BETWEEN THE MARKET AVERAGE AND LOCAL INSTITUTIONS
- 8. Research Journal of Finance and Accounting ISSN 2222-1697 (Paper) ISSN 2222-2847 (Online Vol.5, No.11, 2014 Source: Primary Data The output is a correlation between the Market Equity. There is a strong Negative correlation with the coefficient on( significance(p<0.05) linear relationship between the variables. The local linked average Market price. (iii) CORRELATION BETWEEN THE MARKET AVERAGE AND FOREIGN LINKED FIG V: ROE Performance Correlations for Foreign Linked Firms Source: Primary Data The result reflects a correlation between the Market average a strong positive correlations with the coefficient of (0.648), indicating there is a statistically significance (p<0.05) linear relationship between the variables. The foreign linked firms perform abov performance. (iv) CORRELATION BETWEEN THE MARKET AVERAGE AND DIVERSE LINKED FIRMS FIG VI: ROE Performance Correlations for Diverse Linked Firms Source: Primary Data This output gives a correlation between the Market average and the Divers indicates a weak positive correlation between the Diverse Linked Firms and the Market averages with the coefficient correlation of (0.377), indicating that there is insignificance (p>0.05) linear relationship between the variables. The performance in the Diverse Linked Firms is slightly below the average market price. The figure below summarizes the performance of the companies according to ROE. 2847 (Online) 230 Source: Primary Data The output is a correlation between the Market average and the local institutions linked Firms on Return On Equity. There is a strong Negative correlation with the coefficient on(-0.511),indicating there is a statistically significance(p<0.05) linear relationship between the variables. The local linked institutions perform below the CORRELATION BETWEEN THE MARKET AVERAGE AND FOREIGN LINKED FIG V: ROE Performance Correlations for Foreign Linked Firms The result reflects a correlation between the Market average and the Foreign linked firm performance. It reflects a strong positive correlations with the coefficient of (0.648), indicating there is a statistically significance (p<0.05) linear relationship between the variables. The foreign linked firms perform abov CORRELATION BETWEEN THE MARKET AVERAGE AND DIVERSE LINKED FIRMS FIG VI: ROE Performance Correlations for Diverse Linked Firms Source: Primary Data This output gives a correlation between the Market average and the Diverse Linked Firms performance. It indicates a weak positive correlation between the Diverse Linked Firms and the Market averages with the coefficient correlation of (0.377), indicating that there is insignificance (p>0.05) linear relationship between the ables. The performance in the Diverse Linked Firms is slightly below the average market price. The figure below summarizes the performance of the companies according to ROE. www.iiste.org average and the local institutions linked Firms on Return On 0.511),indicating there is a statistically institutions perform below the CORRELATION BETWEEN THE MARKET AVERAGE AND FOREIGN LINKED and the Foreign linked firm performance. It reflects a strong positive correlations with the coefficient of (0.648), indicating there is a statistically significance (p<0.05) linear relationship between the variables. The foreign linked firms perform above the average market CORRELATION BETWEEN THE MARKET AVERAGE AND DIVERSE LINKED FIRMS e Linked Firms performance. It indicates a weak positive correlation between the Diverse Linked Firms and the Market averages with the coefficient correlation of (0.377), indicating that there is insignificance (p>0.05) linear relationship between the ables. The performance in the Diverse Linked Firms is slightly below the average market price.
- 9. Research Journal of Finance and Accounting ISSN 2222-1697 (Paper) ISSN 2222-2847 (Online Vol.5, No.11, 2014 Fig VII: Summary of All Firms Returns on Equity Source: Primary Data (b) RETURN ON ASSETS (i) CORRELATION BETWEEN STATE LINKED FIRMS AND MARKET AVERAGES FIG VIII: ROA Performance Correlations for State Linked Firms Source: Primary Data The result reflects a correlation between the Market average and the State linked firm’s performance. I strong positive correlations with the coefficient of (0.687), indicating there is a statistically significance (p<0.05) linear relationship between the variables. The performance in the State Linked firms is much more below the Market average. (ii) CORRELATION BETWEEN THE MARKET AVERAGE AND THE INSTITUTION LINKED FIRMS FIG IX: ROA Performance Correlations for Institution Linked Firms Source: Primary Data The output is a correlation between the Market average and the local institutions linked Firm Assets. There is a strong Negative correlation with the coefficient on( significance(p<0.05) linear relationship between the variables. The local linked institutions perform much below the average Market price. 0 0.2 0.4 0.6 2008 2009 2010 2011 %ReturnonEquity Year Return on Equity Chart 2847 (Online) 231 Fig VII: Summary of All Firms Returns on Equity Source: Primary Data CORRELATION BETWEEN STATE LINKED FIRMS AND MARKET AVERAGES FIG VIII: ROA Performance Correlations for State Linked Firms The result reflects a correlation between the Market average and the State linked firm’s performance. I strong positive correlations with the coefficient of (0.687), indicating there is a statistically significance (p<0.05) linear relationship between the variables. The performance in the State Linked firms is much more below the CORRELATION BETWEEN THE MARKET AVERAGE AND THE INSTITUTION LINKED FIG IX: ROA Performance Correlations for Institution Linked Firms The output is a correlation between the Market average and the local institutions linked Firm Assets. There is a strong Negative correlation with the coefficient on(-0.511),indicating there is a statistically significance(p<0.05) linear relationship between the variables. The local linked institutions perform much below 2011 2012 Return on Equity Chart State Institutions Diverse www.iiste.org CORRELATION BETWEEN STATE LINKED FIRMS AND MARKET AVERAGES The result reflects a correlation between the Market average and the State linked firm’s performance. It reflects a strong positive correlations with the coefficient of (0.687), indicating there is a statistically significance (p<0.05) linear relationship between the variables. The performance in the State Linked firms is much more below the CORRELATION BETWEEN THE MARKET AVERAGE AND THE INSTITUTION LINKED The output is a correlation between the Market average and the local institutions linked Firms on Return On 0.511),indicating there is a statistically significance(p<0.05) linear relationship between the variables. The local linked institutions perform much below
- 10. Research Journal of Finance and Accounting ISSN 2222-1697 (Paper) ISSN 2222-2847 (Online Vol.5, No.11, 2014 (iii) CORRELATION BETWEEN THE MARKET AVERAGE AND THE FOREIGN LINKED FIRMS FIG X: ROA Performance Correlations for Foreign Linked Firms Source: Primary Data This output gives a correlation between the Market average and the Forei indicates a weak positive correlation between the Foreign Linked Firms and the Market averages with the coefficient correlation of (0.395), indicating that there is insignificance (p>0.05) linear relationship between the variables. The performance in the Foreign Linked Firms is above the average market price. (iv) CORRELATIONS BETWEEN THE MARKET AVERAGE AND THE DIVERSE BASED FIRMS FIG XI: ROA Performance Correlations for Diverse Linked Firms Source: Primary Data This output gives the correlation between the market average and the Diverse linked firms based on the Return on Assets. They have a strong positive correlation with the coefficient correlation of (0.943), indicating that there is statistically significance (p<0.05) lin slightly below the average of the Market Price. The figure below shows a summary of the performance according to the Return on Asset. Fig XII: Summary of All Firms Returns on Asset Source: Primary Data (c) PRICE EARNINGS PER RATIO (i) CORRELATIONS BETWEEN STATE LINKED FIRMS AND THE MARKET AVERAGE 0 0.5 %ReturnonAsset Year Return on Asset Chart 2847 (Online) 232 CORRELATION BETWEEN THE MARKET AVERAGE AND THE FOREIGN LINKED FIG X: ROA Performance Correlations for Foreign Linked Firms This output gives a correlation between the Market average and the Foreign Linked Firms performance. It indicates a weak positive correlation between the Foreign Linked Firms and the Market averages with the coefficient correlation of (0.395), indicating that there is insignificance (p>0.05) linear relationship between the iables. The performance in the Foreign Linked Firms is above the average market price. CORRELATIONS BETWEEN THE MARKET AVERAGE AND THE DIVERSE BASED FIG XI: ROA Performance Correlations for Diverse Linked Firms ves the correlation between the market average and the Diverse linked firms based on the Return on Assets. They have a strong positive correlation with the coefficient correlation of (0.943), indicating that there is statistically significance (p<0.05) linear relationship between the variables. The state link firms perform slightly below the average of the Market Price. The figure below shows a summary of the performance according to the Return on Asset. Fig XII: Summary of All Firms Returns on Asset PRICE EARNINGS PER RATIO CORRELATIONS BETWEEN STATE LINKED FIRMS AND THE MARKET AVERAGE Return on Asset Chart State Institutions www.iiste.org CORRELATION BETWEEN THE MARKET AVERAGE AND THE FOREIGN LINKED gn Linked Firms performance. It indicates a weak positive correlation between the Foreign Linked Firms and the Market averages with the coefficient correlation of (0.395), indicating that there is insignificance (p>0.05) linear relationship between the iables. The performance in the Foreign Linked Firms is above the average market price. CORRELATIONS BETWEEN THE MARKET AVERAGE AND THE DIVERSE BASED ves the correlation between the market average and the Diverse linked firms based on the Return on Assets. They have a strong positive correlation with the coefficient correlation of (0.943), indicating that there ear relationship between the variables. The state link firms perform CORRELATIONS BETWEEN STATE LINKED FIRMS AND THE MARKET AVERAGE
- 11. Research Journal of Finance and Accounting ISSN 2222-1697 (Paper) ISSN 2222-2847 (Online Vol.5, No.11, 2014 FIG XIII: PE Performance Correlations for State Linked Firms Source: Primary Data The output is a correlation between the Market average and the St Ratio. There is a weak Negative correlation with the coefficient on ( insignificance (p>0.05), linear relationship between the variables. The state linked firms perform average Market price. (ii) CORRELATIONS BETWEEN INSTITUTION LINKED FIRMS AND MARKET AVERAGE FIG XIV: PE Performance Correlations for Institution Linked Firms Source: Primary Data The output is a correlation between the Market average and the Instit per Ratio. There is a weak Negative correlation with the coefficient on ( insignificance (p>0.05),linear relationship between the variables. The state linked firms perfor average Market price. (iii) CORRELATION BETWEEN FOREIGN LINKED FIRMS AND MARKET AVERAGE FIG XV: PE Performance Correlations for Foreign Linked Firms Source: Primary Data The output is a correlation between the Market average and the Foreign link per Ratio. There is a weak or neglible Negative correlation with the coefficient on ( statistically insignificance (p>0.05), linear relationship between the variables. The foreign linked firms slightly above the average Market price. 2847 (Online) 233 FIG XIII: PE Performance Correlations for State Linked Firms The output is a correlation between the Market average and the State linked Firms based on Price Earning per Ratio. There is a weak Negative correlation with the coefficient on (-0.321), indicating there is a statistically insignificance (p>0.05), linear relationship between the variables. The state linked firms perform CORRELATIONS BETWEEN INSTITUTION LINKED FIRMS AND MARKET AVERAGE FIG XIV: PE Performance Correlations for Institution Linked Firms The output is a correlation between the Market average and the Institution linked Firms based on Price Earning per Ratio. There is a weak Negative correlation with the coefficient on (-0.139), indicating there is a statistically insignificance (p>0.05),linear relationship between the variables. The state linked firms perfor CORRELATION BETWEEN FOREIGN LINKED FIRMS AND MARKET AVERAGE FIG XV: PE Performance Correlations for Foreign Linked Firms The output is a correlation between the Market average and the Foreign linked Firms based on Price Earning per Ratio. There is a weak or neglible Negative correlation with the coefficient on (-0.075), indicating there is a statistically insignificance (p>0.05), linear relationship between the variables. The foreign linked firms slightly above the average Market price. www.iiste.org ate linked Firms based on Price Earning per 0.321), indicating there is a statistically insignificance (p>0.05), linear relationship between the variables. The state linked firms perform below the CORRELATIONS BETWEEN INSTITUTION LINKED FIRMS AND MARKET AVERAGE ution linked Firms based on Price Earning 0.139), indicating there is a statistically insignificance (p>0.05),linear relationship between the variables. The state linked firms perform above the CORRELATION BETWEEN FOREIGN LINKED FIRMS AND MARKET AVERAGE ed Firms based on Price Earning 0.075), indicating there is a statistically insignificance (p>0.05), linear relationship between the variables. The foreign linked firms perform
- 12. Research Journal of Finance and Accounting ISSN 2222-1697 (Paper) ISSN 2222-2847 (Online Vol.5, No.11, 2014 (iv) CORRELATION BETWEEN DIVERSE LINKED FIRMS AND MARKET AVERAGE FIG XVI: PE Performance Correlations for Diverse Linked Firms Source: Primary Data The output is a correlation between the Market average and the Assets. There is a strong Negative correlation with the coefficient on ( significance (p<0.05) linear relationship between the variables. The diverse linked instituti below the average Market price. The figure below shows a summary of the performance according to the Price Earning Ratio. Fig XVII: Summary of All Firms on Price Earning Ratio Source: Primary Data 5.0 SUMMARY, CONCLUSIONS AND RECOMME 5.1 Summary From the analysis, it is clear that the shareholders’ structure and control of the companies listed in the Nairobi Stock Exchange has an impact on the performance of the company. The impact could either be positive or negative. The summary of the findings is as below. 5.2 State Linked Companies From the analysis, it is clear that on accounting performance indicators i.e. ROE and ROA, state linked firms on average at 13% and 6% respectively lagged behind firms in other categories. Market while ROA was 11%. This can be attributed by government using its controlling shareholding position to influence enterprises in the public interest, hence sacrificing entrepreneurial drive to promote social good. This may change the focus from shareholder value mediation to balance interest of all stake holders, thereby causing low yields on return on equity. Political interference may also lead to hiring incompetent board members and management. This coupled with monopolistic natur misuse of resources, hence poor return on assets as they may not be fully utilized. In regard to PE, which is common parameter used by investors to determine if company's stock price is over or und depicts come second last at 8% and below market average of 11%. This can be attributed to the fact that since state owned enterprise future outlook is not very promising in terms of growing the business, in the eyes of investors, they may not be able to pay for such firm expensively today hoping to have their value increase in future. 0 10 20 30 2008 2009 2010 2011 Price-EarningRatio Year Price Earning Ratio Chart 2847 (Online) 234 CORRELATION BETWEEN DIVERSE LINKED FIRMS AND MARKET AVERAGE FIG XVI: PE Performance Correlations for Diverse Linked Firms The output is a correlation between the Market average and the local institutions linked Firms on Return on Assets. There is a strong Negative correlation with the coefficient on (-0.512), indicating there is a statistically significance (p<0.05) linear relationship between the variables. The diverse linked instituti The figure below shows a summary of the performance according to the Price Earning Ratio. Fig XVII: Summary of All Firms on Price Earning Ratio 5.0 SUMMARY, CONCLUSIONS AND RECOMMENDATIONS From the analysis, it is clear that the shareholders’ structure and control of the companies listed in the Nairobi Stock Exchange has an impact on the performance of the company. The impact could either be positive or mary of the findings is as below. From the analysis, it is clear that on accounting performance indicators i.e. ROE and ROA, state linked firms on average at 13% and 6% respectively lagged behind firms in other categories. Market average was 19% on ROE, while ROA was 11%. This can be attributed by government using its controlling shareholding position to influence enterprises in the public interest, hence sacrificing entrepreneurial drive to promote social good. This e focus from shareholder value mediation to balance interest of all stake holders, thereby causing low yields on return on equity. Political interference may also lead to hiring incompetent board members and management. This coupled with monopolistic nature of some of such firm may lead to inefficiency, abuse or misuse of resources, hence poor return on assets as they may not be fully utilized. In regard to PE, which is common parameter used by investors to determine if company's stock price is over or und depicts come second last at 8% and below market average of 11%. This can be attributed to the fact that since state owned enterprise future outlook is not very promising in terms of growing the business, in the eyes of y may not be able to pay for such firm expensively today hoping to have their value increase in 2011 2012 Price Earning Ratio Chart State Institutions Diverse Foreign Market Average www.iiste.org CORRELATION BETWEEN DIVERSE LINKED FIRMS AND MARKET AVERAGE local institutions linked Firms on Return on 0.512), indicating there is a statistically significance (p<0.05) linear relationship between the variables. The diverse linked institutions perform slightly The figure below shows a summary of the performance according to the Price Earning Ratio. From the analysis, it is clear that the shareholders’ structure and control of the companies listed in the Nairobi Stock Exchange has an impact on the performance of the company. The impact could either be positive or From the analysis, it is clear that on accounting performance indicators i.e. ROE and ROA, state linked firms on average was 19% on ROE, while ROA was 11%. This can be attributed by government using its controlling shareholding position to influence enterprises in the public interest, hence sacrificing entrepreneurial drive to promote social good. This e focus from shareholder value mediation to balance interest of all stake holders, thereby causing low yields on return on equity. Political interference may also lead to hiring incompetent board members and e of some of such firm may lead to inefficiency, abuse or misuse of resources, hence poor return on assets as they may not be fully utilized. In regard to PE, which is common parameter used by investors to determine if company's stock price is over or undervalued, state linked depicts come second last at 8% and below market average of 11%. This can be attributed to the fact that since state owned enterprise future outlook is not very promising in terms of growing the business, in the eyes of y may not be able to pay for such firm expensively today hoping to have their value increase in
- 13. Research Journal of Finance and Accounting www.iiste.org ISSN 2222-1697 (Paper) ISSN 2222-2847 (Online) Vol.5, No.11, 2014 235 5.3 Institutional Linked Companies For all the parameters, this category shows mixture of performance. ROE was 19% second best performing category, though at same level with market average. This can be attributed to institutional investors’ gravitation towards stocks of companies that have better governance structure is likely to be stronger than that of individual investors as they have strong fiduciary responsibilities and therefore prefer prudent investments. Better still, they have capacity to demand specific performance level from management and may influence company’s investing strategy. In terms of ROA, this category was the second lowest performance at 8% compared market average of 11% . Though this category of investors scrutinize management to ensure proper usage of firm resources as well as maintaining high efficiency levels, this poor performance can be attributed to the fact that some of these institutional shareholders have heavily invested in highly regulated firms like banks and insurance companies, which have their asset levels and utilization under strict requirement levels. This can hinder management of such firms to fully utilize their assets at their disposal. For instance, a bank cannot lend beyond certain limit stipulated by Central Bank of Kenya, even though it may have capacity do so. Institutional shareholders make investment in companies with enormous future growth potential. This can explain a high PE of 14% highest among the categories. Such companies in the eyes of investors have prospect of doing very well in future, hence they are willing to pay for them at a premium in lieu of wealth growth in future. 5.4 Foreign Linked Companies In this category, both the ROE and ROA is the highest at 30% and 18% respectively, far above market average. Many factors can be attributed to this including specific advantages stemming from advanced technological know-how, marketing and managing skills, export contacts, coordinated relationships with suppliers and customers and reputation among others. These advantages were well reflected in the firm performance. However, these firms mainly consist of foreign shareholders who have made direct investment and have a long term commitment to the business. Foreign investors whose intention is just to hold portfolio of any company, are not concerned on long term prosperity of the firm but short term capital gains that can be realized through stock trading. The PE of this category is relatively moderate at 13.8% slightly above market average of 11%. This implies that in the eyes of the investors, the see long term potential hence paying more presently hoping to reap superior returns in future. 5.5 Diverse Linked Companies Over the period under the study, this category’s ROE and ROA stood at 15% and 10% respectively. In both aspects, the performance was slightly below market average. This can be attributed to nonexistent of major controlling shareholders who can put management on its toes. When there is not a single large shareholder or a group of shareholders that can control the firm, the managers, under the assumption of information asymmetry and opportunity behavior, is believed to take control over the firm. This therefore can lead to management making decisions that may not best serve interest of the shareholders but satisfy their own ends. In terms of PE, the diverse ownership still lags behind other categories and below market average. This can be attributed to perception by investing public that these companies are of low value and as long as status quo is maintained, prospects of good performance in future is still uncertain, thereby unwilling to pay a premium on the shares above their current earning capability. 5.6 Conclusion The research objectives were as below: I. To find out if state ownership has influence on firm performance. II. To ascertain whether ownership by institutions impacts firm performance. III. To investigate whether foreign ownership has effect on firm performance. IV. To find out if diverse ownership affects firm performance. From the findings, it is clear that: I. State ownership has a negative influence on a firms performance II. Ownership by institutions impacts both negatively and positively on a firm’s performance. III. Foreign ownership has positive effect on a firm’s performance IV. Diverse ownership affects a firm’s performance negatively. 5.7 Recommendations Though state need to serve social good, it has attracted other investors some of it enterprises. Therefore it needs to balance social and commercial interest in those enterprises. This can be achieved by positively using its controlling influence to institute robust management systems that will promote efficiency, ensure good corporate governance systems and minimize political interference in running of the enterprises. Institutional ownership influences decision of managers. Hence tend to over scrutinize their action and freedom of making choices. This can tend to bring about complacency of the part of management and not utilities their expertise, creativity and wisdom to execute the corporate strategy. This in the end may lead firm’s inconsistent performance. Some institutional investors may not have long term commitment to the business but short term interest, this will bring conflicting position with those whose investment preferences is long term. Therefore, this
- 14. Research Journal of Finance and Accounting www.iiste.org ISSN 2222-1697 (Paper) ISSN 2222-2847 (Online) Vol.5, No.11, 2014 236 class of investors should not over domineer the management but always harmonize their expectation. In addition for them to meet their desired goals, they need to understand the preferences of other institutional shareholders in the same company. This will help them to align their goals with other shareholders. Firms owned by foreigner who have direct investment has far outperformed others regardless of the industry or sector the investment has been made. Domestic investors need to study model employed by foreign investors and apply the same in managing their firms. The country should also make investment environment conducive to attract more foreign investors. This will help to promote and transfer best business practices to other domestic firms. As opposed to developed markets where most of the firms have many shareholders with no controlling shareholder, the case is different in Kenya and in emerging markets as a whole. Block shareholding is a common place in countries such as USA, and UK. During this study, it was noted that number firms with diverse ownership is still very small. This may be due to founding owners still holding onto their position as well as underdeveloped capital markets in Kenya, where many potential individual has not been keen in investing in. Management of these companies has free hand to steer the company in direction they want, and at time may not to the best interest of all shareholders. Diverse ownership should be encouraged; investors should be educated on opportunities in capital markets, and comprehensive code of corporate governance implement and fully enforced to ensure that investors who invest in such firm are not exploited by management. Potential future study should delve into trickle down effects on the firms category that performs better to other listed companies and other business enterprises in Kenya. Also issue to do with protection of minority shareholders from their rights being overstepped by majority shareholders in making major decision, such as mergers and take-over should be considered. REFERENCES Aitken B J, Harrison AE. 1999. Do domestic firms benefit from direct foreign investment: evidence from Venezuela. American Economic Review 89 Anderson, S.; A de Palma; and J. Thisse. “Privatization and Efficiency in a Differentiated Industry.” European Economic Review, 41 (1997). Boardman, A., Shapiro, D., Vining, R. 1997. The Role of Agency Costs in Explaining the Superior Performance of Foreign MNE Subsidiaries. International Business Review. Vol. 6 no. 3. Brown, L. D.,Caylor, M. L., 2004. "Corporate governance and firm valuation."journal of accounting and public policy 25. Chibber, P. K. and S. K. Majumdar (1999) Foreign Ownership and Profitability: Property Rights, Control and the Performance of Firms in Indian Industry. Journal of Law and Economics 42. Choi, J. J. and S. Yoo (2005) Foreign Investment and Firm Performance. Korean Institute of International Economic Policy. (Discussion Paper). Cornett, M.M., Marcus. A .J. Saunders, A. , Tehranian , H. , 2007 . "The impact of institutional ownership on corporate operating performance."Journal of Banking & Finance 31. Del Guercio, D. “The Distorting Effect of the Prudent-Man Laws on Institutional Equity Investment.” Journal of Financial Economics, 40 (1996). Dewenter, Kathryn L. And Paul H. Malatesta (2001), “State owned and privately owned Firms: An Empirical Analysis of Profitability, Leverage, and Labor Intensity,” American Economic Review 91 (1). Donaldson, L., 1990a, The ethereal hand: organizational economics and management theory, Academy of Management Review, 15. Douma, S., R. George and R. Kabir, 2006. Foreign and domestic ownership, business groups and firm performance: Evidence from a large emerging market. Strat. Mgmt Journal: Eisenhardt, K.M., 1989, Agency theory: an assessment and review, Academy of Management Review, 14, 1. Ezazi, M.S., Sadeghisharif, S. J., Alipour,M., Amjadi,H., 2011. "The Effect of Ownership Structure on Share Price Volatility of Listed Companies in Tehran Stock Exchange: An Empirical Evidence of Iran" .International journal of business and social science Vol. 2 No.5. Fama, E. F. (1998) Market Efficiency, Long-Term Returns, and Behavioral Finance, Journal of Financial Economics 49 Griffith, R. (1999) Using the ARD Establishment - Level Data to Look at Foreign Ownership and Productivity in the United Kingdom. Economic Journal 109. Jensen, M. C. and Meckling, W.H. 1976. “Theory of the Firm: Managerial Behavior, Agency Costs, and Ownership Structure”, Journal of Financial Economics , no. 3. Khan, P., (1993). Research Methodology: A Step-by-Step Guide for Beginners, Qounte: Mumbai. Khanna, T., and K. Palepu (1999) Emerging Market Business Groups, Foreign Investors, and Corporate Governance. NBER Working Paper Series 6955. Kothari C (2004). Research Methodology: Methods and Techniques, 2nd edition. New Age International
- 15. Research Journal of Finance and Accounting www.iiste.org ISSN 2222-1697 (Paper) ISSN 2222-2847 (Online) Vol.5, No.11, 2014 237 Publishers, New Delhi, India. La Porta, Rafael, Florencio Lopez-de-Silanes, Andrei Shleifer, and Robert Vishny, 1998a, Law and finance, Journal of Political Economy 106. Leech, D. et al (1991): Ownership Structure, Control Type Classifications and the Performance of Large British Companies. The Economic Journal, November, 1991. Lee, S. (2008). Ownership Structure and Financial Performance: Evidence from Panel Data of South Korea. University of Utah, Department of Economics, Working Paper No.17 Levrau & L.A.A. Van Den Berghe, 2007. Corporate Governance and Board Effectiveness: Beyond Formalism” Working Papers of Faculty of Economics and Business Administration, Ghent University, Belgium , Ghent University, Faculty of Economics and Business Administration. Minguez Vera, A., and Martin Ugedo, J. F. (2007), “Does ownership structure affect value? A panel data analysis for the Spanish market,” International Review of Financial Analysis, 16(1). Mugenda, O.M., and Mugenda, A.G., (2003). Research Methods: Quantitative and Qualitative Approaches. Act Press, Nairobi. Orodho AJ (2003). Essentials of Educational and Social Science Research Method. Nairobi: Masola Publishers. Shleifer, A., and Vishny, R., 1986, Large Shareholders and Corporate Control, Journal of Political Economy 94. Thomsen, S. and Pedersen, T. (2000), Ownership structure and economic performance in the largest European companies. Strat. Mgmt. J., 21. Verweire, K. & Van der Berghe, L. (2005). ' Integrated performance management: a guide to strategy implementation'. London: Sage. Wiwattanakantang Y. 2001. Controlling shareholders and corporate value: Evidence from Thailand. Pacific Basin Finance Journal 9. Wiwattanakantang, Y 2000, 'The Ownership Structure, Capital Structure and Performance of Thai Firms', Hitotsubashi University. Xu, X., and Wang, Y., 1997, Ownership Structure, Corporate Governance, and Corporate Performance: The Case of Chinese Stock Companies, World Bank Policy Research Publication Working Paper. Xu Xiaonian and Wang Yan, (1999). “Ownership structure and corporate governance in Chinese Stock companies” China Economic Review 10.
- 16. The IISTE is a pioneer in the Open-Access hosting service and academic event management. The aim of the firm is Accelerating Global Knowledge Sharing. More information about the firm can be found on the homepage: http://www.iiste.org CALL FOR JOURNAL PAPERS There are more than 30 peer-reviewed academic journals hosted under the hosting platform. Prospective authors of journals can find the submission instruction on the following page: http://www.iiste.org/journals/ All the journals articles are available online to the readers all over the world without financial, legal, or technical barriers other than those inseparable from gaining access to the internet itself. Paper version of the journals is also available upon request of readers and authors. MORE RESOURCES Book publication information: http://www.iiste.org/book/ IISTE Knowledge Sharing Partners EBSCO, Index Copernicus, Ulrich's Periodicals Directory, JournalTOCS, PKP Open Archives Harvester, Bielefeld Academic Search Engine, Elektronische Zeitschriftenbibliothek EZB, Open J-Gate, OCLC WorldCat, Universe Digtial Library , NewJour, Google Scholar