

Empfohlen
Weitere ähnliche Inhalte
Was ist angesagt?
Was ist angesagt? (20)
Ähnlich wie 潜在クラス分析
Mehr von Yoshitake Takebayashi
Mehr von Yoshitake Takebayashi (19)
潜在クラス分析
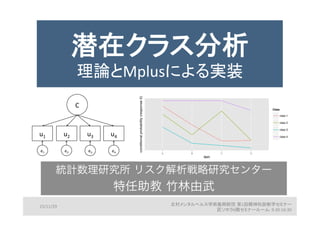
- 1. 潜在クラス分析 理論とMplusによる実装 統計数理研究所 リスク解析戦略研究センター 特任助教 竹林由武 15/11/29 北村メンタルヘルス学術振興財団 第1回精神科診断学セミナー 匠ソホラ6階セミナールーム: 9:30-‐16:30 u1 u2 C u3 u4 e1 e2 e3 e4 A B C D item conditionalprobability(response2) Class class 1: class 2: class 3: class 4:
- 2. 発表の構成 2 理 論 書き方 実 装 潜在クラス分析とは? 研究を始める前に知っておきたい 論文執筆上のチェックポイント Mplusによる潜在クラス分析の実施 出力結果の解釈
- 3. 発表の構成 3 理 論 書き方 実 装 潜在クラス分析とは? 研究を始める前に知っておきたい 論文執筆上のチェックポイント Mplusによる潜在クラス分析の実施 出力結果の解釈
- 4. 観測変数間の関係を、未観測の変数を導入して説明するモデル 潜在変数モデル 4 X1 X2 X3 潜在 変数 e1 e2 e3 直接測定不能な変数 e.g., 知能, 性格, うつ病 直接測定可能な変数 e.g., 知能検査の項目, 性格検査の項目, うつ病
- 5. 観測変数間の関係を、未観測の変数を導入して説明 潜在変数モデル 5 X1 X2 X3 潜在 変数 e1 e2 e3 X1 X2 X3 Y1 Y2 Y3 Y1 1.0 Y2 0.6 1.0 Y3 0.7 0.6 1.0
- 6. 潜在変数の得点の変化が X1-‐X3の観測変数の変化を説明 潜在変数モデル 6 潜在変数 潜在変数 潜在変数 X1 X2 X3 X1 X2 X3 % e1 e2 e3 観測変数を従属変数とし 潜在変数を独立変数とする回帰モデル 従属変数 = b*独立変数 + 誤差
- 7. 観測変数間の関係は、潜在変数と観測変数の関係 に置き変わるので、観測変数間は互いに独立 潜在変数モデル 7 X1 X2 X3 潜在 変数 e1 e2 e3 X1 X2 X3 Y1 Y2 Y3 Y1 1.0 Y2 0.6 1.0 Y3 0.7 0.6 1.0 局所独立の仮定
- 8. 潜在クラスモデル 8 症状 A 症状 B 症状 C 潜在 変数 e1 e2 e3 局所独立性の仮定 症状 A 症状 B 症状 C 潜在 変数 e1 e2 e3 局所独立 局所非独立 潜在変数で観測変数が説明される場合に、観測変数間の関連はゼロと仮定
- 9. 潜在クラスモデル 9 U1 U2 U3 C e1 e2 e3 潜在変数 連続 質的 観測変数 連続 因子分析 潜在プロフィール分析 質的 項目反応理論 潜在クラス分析 潜在クラス分析 観測変数・潜在変数ともに 質的変数の潜在変数モデル
- 10. 質的な潜在変数モデル 10 質的な潜在変数モデルの目的 個人を異質な部分集団に分類 潜在する部分母集団 = 潜在クラス Density Curves Data Density 20 30 40 50 60 70 80 0.000.010.020.030.04 成人の体重 例) 成人の体重の分布 ピークは二つ. 2つの集団が混在. 緑: 女性 赤: 男性 母集団:成人 部分母集団:性別 (男性, 女性) 確率密度
- 11. 潜在クラス分析の適用 11 基本的 • 精神疾患の疾患分類 • 特定の精神疾患のサブタイプ分類 発展的 (他の分析モデルとの組み合わせ) • サブタイプの予測・サブタイプによる予測 • 治療反応性の予測
- 12. 適用例 12 事例 ① 患者:トラウマ経験を有する退役軍人492名 デザイン:横断研究 測定指標:DSM-IVのPTSDと乖離の現有症状 結果:3クラス抽出 PTSD軽症群, PTSD重症群, PTSDと乖離併発群 併発群がPTSD症状より重篤 Wolf, E. J., Miller, M. W., Reardon, A. F., Ryabchenko, K. A., CasNllo, D., & Freund, R. (2012). A latent class analysis of dissociaNon and posTraumaNc stress disorder: Evidence for a dissociaNve subtype. Archives of General Psychiatry, 69(7), 698-‐705.
- 13. 適用例 13 事例 ② 患者:臨床試験に参加するうつ病患者2239名 デザイン:横断研究 測定指標:QUIDS (うつの症状評価) 結果:4クラス抽出 軽症群, 中等症群, 重症で過食群 重症で不眠群 Ulbricht, C. M., Rothschild, A. J., & Lapane, K. L. (2015). The associaNon between latent depression subtypes and remission a]er treatment with citalopram: A latent class analysis with distal outcome. Journal of affecNve disorders, 188, 270-‐277. GAD, SADが重度群に関連 クラスと他の指標との関連
- 14. 因子分析モデル→潜在クラスモデル 14 2つの観測変数 (連続変数)が相関 抑うつ 気分 快の欠落 未観測の要因 (連続変数)が2変数の相関を説明 抑うつ 気分 快の欠落 抑うつ 状態 潜在変数/因子 (構成概念)
- 15. 因子分析モデル 15 4つの観測変数が相関 Y1 抑うつ 気分 Y2 快の欠落 Y3 睡眠不足 Y4 体重低下 Y1 Y2 Y3 Y4 Y1 1.0 Y2 0.6 1.0 Y3 0.7 0.6 1.0 Y4 0.5 0.6 0.5 1.0
- 16. 因子分析モデル 16 観測変数の相関を潜在変数が説明 抑うつ 気分 快の欠落 抑うつ 状態 睡眠不足 体重低下 e1 e2 e3 e4 Y1 Y2 Y3 Y4 Y1 1.0 Y2 0.6 1.0 Y3 0.7 0.6 1.0 Y4 0.5 0.6 0.5 1.0 因子得点
- 17. 因子分析モデル 17 推定された因子得点(潜在変数)は 連続変数, 正規分布 ! e1 e2 e3 e4
- 18. 因子分析モデル 18 因子得点(潜在変数)と観測変数の関係 F e1 e2 e3 e4 1.2 -‐0.4 0.2 -‐1.5 -‐1.4 3.3 0.8 -‐0.2 -‐0.1 0.9 ・ ・ ・ ・ ・ ・ ・ ・ ・ ・ 0.7 0.3 0.2 -‐0.4 1.5 Y1 Y2 Y3 Y4 0.8 1.4 -‐0.3 -‐0.2 4.1 3.1 3.2 4.2 ・ ・ ・ ・ ・ ・ ・ ・ 1.0 0.9 0.3 2.2 因子得点 (構成概念)の得点が高い→各観測変数の得点が高い 因子得点 観測変数
- 19. 因子分析 vs 潜在クラス分析 19 ID 観測変数 A B C D E F 1 4 4 4 2 2 2 2 4 4 4 2 2 2 3 4 4 4 2 2 2 4 3 3 3 1 1 1 5 3 3 3 1 1 1 6 3 3 3 1 1 1 f1 f2 c1 c2 因子分析モデル 似通った応答パターンの 観測変数をまとめる 潜在クラスモデル 似通った応答パターンの 個人をまとめる item centered approach Personcentered Approach
- 20. 因子分析 vs 潜在クラス分析 20 ID 観測変数 A B C D E F 1 4 4 4 2 2 2 2 4 4 4 2 2 2 3 4 4 4 2 2 2 4 3 3 3 1 1 1 5 3 3 3 1 1 1 6 3 3 3 1 1 1 f1 f2 c1 c2 因子分析モデル 似通った回答パターンの 観測変数をまとめる 潜在クラスモデル 似通った回答パターンの 個人をまとめる item centered approach Personcentered Approach
- 21. 因子分析 vs 潜在クラス分析 21 ID 観測変数 A B C D E F 1 4 4 4 2 2 2 2 4 4 4 2 2 2 3 4 4 4 2 2 2 4 3 3 3 1 1 1 5 3 3 3 1 1 1 6 3 3 3 1 1 1 f1 f2 c1 c2 因子分析モデル 似通った回答パターンの 観測変数をまとめる 潜在クラスモデル 似通った回答パターンの 個人をまとめる item centered approach Personcentered Approach
- 22. 潜在クラスモデル 22 2つの観測変数 (2値変数)が相関 抑うつ 気分 (あり、なし) 快の欠落 (あり、なし) 未観測の要因 (カテゴリ変数)が 2変数の相関を説明 抑うつ 気分 (あり、なし) 快の欠落 (あり、なし) クラス (1, 2) 潜在変数/因子 (構成概念)
- 23. 潜在クラスモデル 23 観測変数はカテゴリカル 潜在変数もカテゴリカル ! e1 e2 e3 e4 因子得点 → 所属確率の高いクラス 1 2 潜在プロフィール分析は、観測変数が連続変数という違いだけで、 分析の目的は、潜在クラス分析と同様
- 24. 潜在クラスモデルの推定 24 個人を応答 (回答)パターンに基づいて分類 症状 A 症状 B 症状 C Class 1 e1 e2 e3 症状 D e3 0.80 0.80 0.80 0.80 症状 A 症状 B 症状 C Class 2 e1 e2 e3 症状 D e3 0.75 0.75 0.25 0.25 パス係数:条件付き応答確率 例) クラス1の所属するという条件の下で、症状Aに「あり」と回答する確率が80%
- 25. 潜在クラスモデルの推定 25 個人を応答パターンに基づいて分類 0 0.1 0.2 0.3 0.4 0.5 0.6 0.7 0.8 0.9 1 項目 1 項目 2 項目 3 項目 4 Class 1 Class 2 はい (1) いいえ (0) 不眠抑うつ 楽しみ 体重 Class 1 重症 Class 2 気分優勢 40% 60% クラスの構成割合 条件付き応答確率 クラスの解釈
- 26. 分析のイメージの足がかり 26 調査対象:青年2087名 測定指標:非行項目5つ「あり」「なし」 「あり」の応答率 親に嘘つく .57 騒音等 .49 器物破損 .17 万引き .24 窃盗 < $50 .20 集団抗争 .19
- 28. 適用例 28 事例: 推定されたパラメータ 潜在クラス クラス 1 非行なし 軽度群 2 言語的 敵対群 3 万引き群 4 全般的 非行群 メンバー 構成割合 .49 .26 .18 .06 あり回答の条件つき確率 親に嘘 .33 .81 .78 .89 騒音等 .20 .82 .62 1.00 器物破損 .01 .25 .25 .89 万引き .03 .02 .92 .88 窃盗 < $50 .00 .03 .73 .88 集団抗争 .04 .31 .24 .64
- 29. 適用例 29 クラスメンバーの構成割合 (probabilities of membership) 0 0.1 0.2 0.3 0.4 0.5 0.6 潜在クラス1 潜在クラス2 潜在クラス3 潜在クラス4 構成割合 合計すると1になる サブグループ (クラス)のサイズを把握
- 30. 適用例 30 条件付き応答確率 (conditional response probability) 各クラスの特徴を把握 0 0.1 0.2 0.3 0.4 0.5 0.6 0.7 0.8 0.9 1 項目1 項目2 項目3 項目4 項目5 項目6 クラス1 (49%) クラス2 (26%) クラス3 (18%) クラス4 (6%)
- 31. 潜在クラスモデル 31 P(Xvi =1) = πcπic c=1 C ∑ 簡単のため、1項目の潜在クラスモデル πc c=1 C ∑ πic = p(Xvi =1|C = c) =個人が一つのクラスに所属する確率の合計 =1 = 個人が特定のクラス(c)の下で、 項目iに対して1に回答する確率 πc = 個人が特定のクラスに所属する確率 ※1人が複数のクラスのいずれか1つに所属するという制約の下 P(Xvi =1) 簡単のため、1項目の潜在クラスモデル =ある個人(v)が項目iで1に回答する確率 クラスサイズパラメータ (クラスの構成比) 条件つき応答確率
- 32. 潜在クラスモデル 32 条件つき応答確率 うつ病 健常 クラス構成比 .10 .90 抑うつ気分 あり .80 .30 なし .20 .70 不眠 あり .80 .30 なし .20 .70 πc πic P(Xvi =1,1) = πcπic c=1 C ∑ πc1=うつ病群のクラス構成比 = 0.10 πi1c1 = うつ群下でのありあり確率 = (.80 * .80) = .64 πc1πi1c1 = .10 * 0.64 = 0.064 ありありパターンの確率 πc2=健常群の = 0.90 πi1c2 = 健常群下 = (.30 * .30) = .0.09 πc2πi1c2 = .90 * 0.004 = 0.081 = .0.081+ 0.064 = 0.145 πcπic c=1 C ∑
- 33. 潜在クラスモデル 33 うつ病 健常 潜在クラスの割合 .10 .90 抑うつ気分 あり .80 .30 なし .20 .70 不眠 あり .80 .30 なし .20 .70 うつ群のなしなし確率= (.20 * .20)*.10 = .004 健常群のなしなし確率= (.70 * .70)*.90 = .441 うつ病群のありあり確率+健常群のありあり確率 = .445 なしなしパターンの割合
- 34. 潜在クラスモデル 34 うつ病 健常 潜在クラスの割合 .10 .90 抑うつ気分 あり .80 .30 なし .20 .70 不眠 あり .80 .30 なし .20 .70 うつ群のありあり確率= (.20 * .80)*.10 = .016 健常群のありあり確率= (.70 * .30)*.90 = .189 うつ病群のありあり確率+健常群のありあり確率 = .205 なしありパターンの割合 ありなしはありなしと同確率
- 35. 潜在クラスモデル 35 うつ病 健常 潜在クラスの割合 .10 .90 抑うつ気分 あり .80 .30 なし .20 .70 不眠 あり .80 .30 なし .20 .70 全回答パターン, 4パターン, [あり, あり], [なしなし], [なし,あり][あり, あり] ありありパターンの割合=.145 なしなしパターンの割合= .445 ありなしパターンの割合 =.205 なしありパターンの割合=.205 計1
- 36. 潜在クラスモデルの推定 36 症状A 症状B 症状C 症状D パターン度数 1 1 0 0 15 0 1 1 1 14 1 0 0 0 11 1 0 1 1 8 0 1 0 0 23 ・ ・ ・ ・ 1 1 1 1 9 潜在クラス分析のデータ構造
- 37. 潜在クラスモデルの推定 37 症状A 症状B 症状C 症状D 潜在 クラス nijkl パターン度数 1 1 0 0 2 9 0 1 1 1 1 6 1 0 0 0 2 3 1 0 1 1 1 11 0 1 0 0 2 8 ・ ・ ・ ・ 1 1 1 1 1 9 潜在クラスの推定をし、 クラスサイズパラメータ 条件付き応答確率を推定
- 38. 潜在クラスの推定 38 症状A 症状B 症状C 症状D 潜在 クラス nijkl パターン度数 1 1 0 0 ? 9 0 1 1 1 ? 6 1 0 0 0 ? 3 1 0 1 1 ? 11 0 1 0 0 ? 8 ・ ・ ・ ・ ・ ・ 1 1 1 1 ? 9 潜在クラスは未知 欠測値として扱いEMアルゴリズムにより最尤推定
- 39. パラメータの推定 39 EMアルゴリズムによる最尤推定法 -‐ 解の初期値依存性が高い -‐ 局所最適化の問題 -‐ 収束基準の影響 分析実行時に、セッティングに配慮 デフォルト設定だとMplusでもうまくいかない
- 40. 潜在クラス分析 • 3つのステップ ① 最適なクラス数を決定 ② 分類の正確性を評価 ③ クラスの解釈 40 最終的なクラス数の決定は③まで含めて複合的に判断
- 41. クラス数の選定 41 クラス数を1から順位増加させ、最適なモデルを 尤度比検定、情報量基準から判断する 尤度比検定 Vuong-Lo-Mendell-Rubin LIikelihood Ratio Test (VLMR) Adjusted Lo-Mendell-Rubin Ratio Test (ALMR) Bootstrapped Likelihood Ratio Test (BLRT) 情報量基準 AIC, BICなど Nylund, K. L., Asparouhov, T., & Muthén, B. O. (2007). Deciding on the number of classes in latent class analysis and growth mixture modeling: A Monte Carlo simulaNon study. Structural equaNon modeling, 14(4), 535-‐569. あるクラス数 (K)のモデルとK-1のクラスのモデルで、尤度比検定 有意差が認められなくなったらK-1クラスのモデルを採択 推奨:BLRT, BIC
- 42. 記載例 • 方法の節 In order to determine the optimal number of classes, different number of latent classes was modeled starting from 1 (e.g., only one class of cannabis users), then 2, and so on until we reach an optimal solution. Different criteria were used to select the most appropriate model (59). These criteria included the following information criteria: deviance, the Akaike information criterion (AIC) (60), the Bayesian information criterion (BIC), and the sample-size adjusted Bayesian information criterion (SSBIC) (61), to compare the relative fit of solutions. Better fitting solutions are reflected in lower values on the indices. We also considered likelihood ratio tests, including the Vuong‒Lo‒ Mendell‒Rubin and Lo‒Mendell‒Rubin adjusted likelihood ratio tests ‒ ALRTs (62). ALRT tests are adequate for non-nested mixture models and test the significance of the difference in fit between two models with a one class difference. We also considered the recommended Bootstrapped Likelihood Ratio Test [BLRT; (63)]. The criterion for significance was α < 0.05. We also relied on entropy, which is indicative of the degree of homogeneity within and independence between classes (60). 42
- 43. 記載例 • 結果の節 43
- 44. 分類の正確性 • 事後所属確率 クラスの所属メンバーが各クラスに所属する確率 ・(相対) エントロピー (entropy) 44 範囲: 0-1 高.80, 中.60, 低.40 (Clark, 2010) .70以上 正確 (Nagin, 2005) 1 2 3 1 .76 .15 .09 2 .06 .91 .03 3 .04 .04 .92 EN(k) = − Pik lnPik K=1 K ∑ i=1 N ∑ REN(k) =1− EN(k) N •ln(K)
- 45. 解釈: 記載例 45 -‐ 潜在クラスの構成、条件付き応答確率 (表) Tsai, J., Harpaz-‐Rotem, I., Pilver, C. E., Wolf, E. J., Hoff, R. A., Levy, K. N., ... & Pietrzak, R. H. (2014). Latent class analysis of personality disorders in adults with posTraumaNc stress disorder: results from the NaNonal Epidemiologic Survey on Alcohol and Related CondiNons. The Journal of clinical psychiatry, 75(3), 276-‐284.
- 46. 解釈:記載例 • 記載例 (図) 46 Tsai, J., Harpaz-‐Rotem, I., Pilver, C. E., Wolf, E. J., Hoff, R. A., Levy, K. N., ... & Pietrzak, R. H. (2014). Latent class analysis of personality disorders in adults with posTraumaNc stress disorder: results from the NaNonal Epidemiologic Survey on Alcohol and Related CondiNons. The Journal of clinical psychiatry, 75(3), 276-‐284. 横軸に項目 縦軸に条件付き応答確率 クラスごと線プロット PTSDの人格障害並存パターン
- 47. 解釈 47 • 記載例 (図) 横軸にクラス 縦軸に条件付き応答確率 項目ごとバープロット 薬物依存と感情(うつ不安)障害の 並存パターン Salom, C. L., BeTs, K. S., Williams, G. M., Najman, J. M., & AlaN, R. (2015). Predictors of comorbid polysubstance use and mental health disorders in young adults—a latent class analysis. AddicNon.
- 48. 共変量を含む潜在クラス分析 48 症状 A 症状 B 症状 C 潜在 クラス e1 e2 e3 共変量 クラス数が2値: ロジスティック回帰 クラス数が3値以上: 多項目ロジスティック回帰 回帰モデル的に共変量を投入 共変量の得点が上がると、特定のクラスの所属確率が上がる、というように、 回帰モデルと同様の解釈が可能であるため、解釈が容易
- 49. 記載例 • 方法の節 49 Next, covariates including gender, exposure type, and funcNoning, were regressed on class membership in a mulNnomial logisNc regression simultaneously to assess if subjects within class differ significantly on these characterisNcs (condiNonal model). Galatzer-‐Levy, I. R., Nickerson, A., Litz, B. T., & Marmar, C. R. (2013). PaTerns of lifeNme PTSD comorbidity: A latent class analysis. Depression and anxiety, 30(5), 489-‐496. 共変量からクラスを予測する多項ロジスティック回帰を、 潜在クラス分析モデルに含み同時に検討
- 50. 記載例 50 Compared to the low comorbidity class, the substance dependent class and the depressed– anxious class were significantly more likely to have been physically abused by a partner (substance dependent: Est = 2.24, SE = 0.54,P ≤ .001; depressed–anxious: Est = 1.49, SE = 0.50,P ≤ .01). Interestingly, the substance dependent class was significantly more likely to report physical abuse by a parent compared to the depressed–anxious class (Est =1.95, SE = 0.89, P ≤ .05). Both the substance depen-dent and the depressed–anxious classes reported greaterPTSD severity than the low comorbidity class. Thesetwo classes were also more likely to report having beenbeaten by a parent compared to the low comorbidity class(substance dependent: Est = 0.89, SE = 0.37, P ≤ . 05;depressed–anxious: Est = 0.65, SE = 0.29, P ≤ .05), butnot greater frequency or interference with daily life (seeTable 3). Galatzer-‐Levy, I. R., Nickerson, A., Litz, B. T., & Marmar, C. R. (2013). PaTerns of lifeNme PTSD comorbidity: A latent class analysis. Depression and anxiety, 30(5), 489-‐496. 結果の節
- 51. 発表の構成 51 理 論 書き方 実 装 潜在クラス分析とは? 研究を始める前に知っておきたい 論文執筆上のチェックポイント Mplusによる潜在クラス分析の実施 出力結果の解釈
- 52. 論文報告上のポイント 52 統計的手法を用いた論文を査読する際の要点を解説 記載事項を踏まえて論文執筆→採択率UP!! 第13章: 潜在クラス分析 Karen M. Samuelsen C. Mitchell. Dayton Samuelsen, K. M. & Dayton, C. M. (2010). Latent Class Analysis. The reviewer’s guide to quanNtaNve methods in the social sciences. Routledge.
- 53. 記載事項 53 - 観測 (顕在変数) - 共変量 - 標本抽出とサンプルサイズ - 使用したソフトウェア - モデルの収束判断と識別 - Boundary value閾値 - 潜在クラス、構成割合の適切性 - クラスのメンバーシップ
- 54. 記載事項 54 観測変数 どのようなカテゴリを用いたか明記 - 2値のカテゴリ変数 - 3値以上のカテゴリ変数 2値に加工した場合も明記 - 順序カテゴリ変数
- 55. • 記載例 (2値の場合) 55 A structured diagnosNc interview was conducted using the World Mental Health Survey IniNaNve version of the World Health OrganizaNon Composite InternaNonal DiagnosNc Interview (WMH-‐CIDI), from which DSM-‐IV Axis I Diagnoses[18 ] and age of onset were derived . ・・・中略・・・ All diagnoses were dummy coded (0 = absent; 1 = present) for study of paTerns of comorbidity among respondents using LCA. Galatzer-‐Levy, I. R., Nickerson, A., Litz, B. T., & Marmar, C. R. (2013). PaTerns of lifeNme PTSD comorbidity: A latent class analysis. Depression and anxiety, 30(5), 489-‐496. どのようにコーディングを行った明記する
- 56. 記載事項 56 共変量 1) 共変量として回帰モデル的に入れる 2) grouping variableとして扱う (多母集団同時分析的) 2が主流 標本サイズが小さい場合には、共変量を投入した方が 良い推定結果が得られるため、積極的に含んだ方が良い ※共変量を含む合理性がなければ、無理に入れない。
- 57. 記載事項 57 標本抽出法 理想:標的母集団を代表する無作為抽出標本 現実:複雑な調査デザイン - クラスターの存在、サンプリングの偏り → デザインを無視して解析→バイアス大 複雑な調査デザインの場合に補正をかける - サンプリングによる重み付け推定 - Jackknife法の標準誤差による推定 MplusではTYPE=COMPLEXオプションで指定 PaTerson, B. H., Dayton, C. M., & Graubard, B. I. (2002). Latent class analysis of complex sample survey data: applicaNon to dietary data. Journal of the American StaNsNcal AssociaNon, 97(459), 721-‐741.
- 58. 標本抽出 • 記載例 58 Sampling weights and other variables that account for the complex survey design of NaHonal Psychiatric Morbidity Survey 2000 were used in all analyses to enhance the reliability and validity of the parameter esNmates, standard error and model fit calculaNons. 代表的な調査データでは、 sampling weightが既出なので、それを使用 Bebbington, P. E., McBride, O., Steel, C., Kuipers, E., Radovanovič, M., Brugha, T., ... & Freeman, D. (2013). The structure of paranoia in the general populaNon. The BriNsh Journal of Psychiatry, 202(6), 419-‐427.
- 59. 記載事項 59 例数 500以上は必要 (Finch & Bronk, 2014) 500も取れない場合の工夫 (Wurpts & Geiser, 2014) - クラスとの関連が強い共変量を投入 - 良質なindicatorを使用 (負荷が高い) - indicator数を増やす (6以上) ※ 標本サイズが100以下だと工夫しても 安定しない Finch W. H., Bronk K. C. (2011). ConducNng confirmatory latent class analysis using Mplus. Struct. Equ. Modeling 18, 132–151 10.1080/10705511.2011.532732 Wurpts, I. C., & Geiser, C. (2014). Is adding more indicators to a latent class analysis beneficial or detrimental? Results of a Monte-‐Carlo study. FronNers in psychology, 5.
- 60. 標本サイズ 60 Wurpts, I. C., & Geiser, C. (2014). Is adding more indicators to a latent class analysis beneficial or detrimental? Results of a Monte-‐Carlo study. FronNers in psychology, 5. indicator数6以上、indicatorの質高、関連の強い共変量を含む場合、バイアス小
- 61. 標本サイズ • 記載例 61 多くの論文は、大規模調査の2次データ解析。 標本サイズが大きく2次データの解析なので、 例数設計に関する記載がほとんどない。
- 62. 記載事項 62 使用したソフトウェア ソフトウェア名とバージョンを明記 ソフトウェアによってデフォルト設定が違う -‐ 標準誤差の算出 -‐ 初期値の設定 -‐ 局所非独立の場合の対処 -‐ 最尤推定かベイズ推定か
- 63. 使用ソフトウェア 63 初期値設定の問題 潜在クラス分析の推定、EMアルゴリズムを使用 EMアルゴリズムによる推定は初期値依存性が高い 初期値によって、局所最適化が起こる可能性あり 複数の初期値をランダムに設定し、複数の推定結果で、 一貫している結果を採用 (Mplusはデフォルト)
- 64. 記載事項 64 - モデルの収束と識別 最尤推定の収束基準を明示 (Mplusは0.000001) - 最適化がlocalかglobalかに影響する 推定されたパラメータの分散共分散行列を明示 - モデルの識別性の判断根拠 (負の値が入ってなければ良い) ※ 現状の論文では報告されていることは稀だが、報告されていると望ましい
- 65. 記載事項 65 - Boundary value適合度 条件付き応答確率の境界値が0または1に近接する項 目が多い場合、モデルが過剰適合している可能性 - 潜在クラス、構成割合の適切性 極めて小さいサイズのクラスが抽出された場合、そ れが妥当か - クラスのメンバーシップ 理論、先行研究と照らして、 妥当または解釈可能なクラス分類か?
- 66. 発表の構成 66 理 論 書き方 実 装 潜在クラス分析とは? 研究を始める前に知っておきたい 論文執筆上のチェックポイント Mplusによる潜在クラス分析の実施 出力結果の解釈
- 67. Mplusによる潜在クラス分析 67 最強の構造方程式モデリングのソフトウェア 日本語の解説書 (国内唯一) ・ソフトの入手法やダウンロード法も解説あり ・潜在クラス分析の章 (第14章 混合分布モデル)の執筆担当 ホームページから、 マニュアル、サンプルコード、 サンプルデータなど入手可能 hTps://www.statmodel.com/
- 68. サンプルデータ 68 UCLA大の潜在クラス分析解説ページから入手 hTp://www.ats.ucla.edu/stat/mplus/dae/lca1.htm lca1.dat クリック! ページをスクロールして後半にデータのリンク
- 69. サンプルデータ 69 UCLA大の潜在クラス分析解説ページから入手 hTp://www.ats.ucla.edu/stat/mplus/dae/lca1.htm lca1.dat: ・ 飲酒行動に関する仮想データ ・ 1000名の成人 ・ 飲酒行動9項目を2値で回答 (「いいえ(0)」, 「はい(1)」) 1. お酒を飲むのが好きである 2. 度数の強いお酒を飲む 3. 朝,二日酔いがあった 4. 仕事中にお酒を飲んだ 5. 酔っぱらうためにお酒を飲む 6. お酒の味が好きだ 7. 眠りにつくためにお酒を飲む 8. 飲酒に対人関係が支障をうける 9. 頻繁にバーに行く
- 70. データ構造 70 lca1.dat: コンマ区切りのテキストファイル 変数名は入れない (スクリプトであとから指定)
- 72. スクリプト:基本設定 72 Title: Data: Variables: Analysis: タイトルを設定(任意) 使用するデータファイル名を指定 解析に使用する変数を設定 解析方法を指定
- 73. スクリプト:基本設定 73 Title: FicNtous Latent Class Analysis. Data: File is lca1.dat ; !スクリプト( .inp)と同じフォルダに ! タイトルを設定(任意) ! 使用するデータファイル名を指定 ! の後の文はコメントアウトされる (分析から無視される)
- 74. スクリプト:基本設定 74 Variable: names = id item1-‐item9; auxiliary = id; usevariables = item1-‐item9; categorical = item1-‐item9; classes = c(2); ! 使用する変数を設定 ! データに含まれる全変数にラベルづけ ! 解析には含まれないが、 出力データセットに含めたい変数指定 ! 解析使用する変数指定 ! カテゴリ変数であることを指定 ! 潜在クラス数を指定
- 75. スクリプト:基本設定 75 Analysis: Type=mixture; Starts = 500 50; sNteraNon 50; lrtbootstrap =500; lrtstarts = 50 20 50 20; ! 分析の設定 ! 混合分布モデルを行う際に指定 ! 初期値を指定 ! 収束までの反復回数 ! ブートストラップ尤度比検定の初期値 ! ブートスラップの反復回数
- 76. Tips • 局所最適化のチェック - 最大尤度の安定性 複数の初期値で出てきた最大尤度が安定してるか - 条件付き応答確率 推定値が極値となっている場合 (0 or 1) Mplusでは閾値として算出される (-15 or 15) ※これは、余計にクラスが抽出されている 場合にも起こる 76
- 77. Tips • 局所最適化への対処 - 十分な数のランダム初期値を設定 (500以上推奨) (Mplusのデフォルトはstarts = 10 2) - 十分な数の初期最適化の反復回数 (Mplusのデフォルトはstiteration = 10) - 小さなクラスを選好する - 収束基準を厳しくする (Mplusのデフォルトは、convergence = 0.000001) - 異なるソフトウェア・データで再現性をチェック (Rだと、LCAはpoLCA, LPAはMclust) 77
- 78. スクリプト:出力設定 78 Plot: type is plot3; series is item1 (1) item2 (2) item3 (3) item4 (4) item5 (5) item6 (6) item7 (7) item8 (8) item9 (9); Output: tech11 tech14; ! プロットの設定 ! 条件付き応答確率のプロット ! VLMR, BLRTの結果を出力
- 79. スクリプト:出力設定 79 Savedata: file is lca1_save.txt ; save is cprob; format is free; ! データの保存 ! 条件付き応答確率を保存 ! 任意のファイル名
- 80. 便利コマンド ANALYSISコマンドでoptseedオプションを指 定すると、2回目以降同じ解析をする際に、反 復計算の大半が省略され高速化 ANALYSIS: optseed = 120506; 80 RANDOM STARTS RESULTS RANKED FROM THE BEST TO THE WORST LOGLIKELIHOOD VALUES Final stage loglikelihood values at local maxima, seeds, and iniNal stage start numbers: -‐4251.208 120506 45
- 81. 81 コードが書けたら、 「File」→「Save as」で 任意の名前と場所に保存 RUNボタンを押し、 解析実行.
- 82. 分析実行中… 82 MS-‐DOSのwindowが出てきたら無事分析実行 エラーの場合、.outファイルがすぐに出てくる。 エラーメッセージに基づいて対処。 潜在クラス分析の実行には、反復計算のアルゴリズムを多用するので、 出力が得られるまでに時間がかかる。
- 83. 出力の見方:まずは適合度 83 相対指標 情報量基準 絶対指標 尤度比検定 モデル適合度
- 84. 出力の見方 84 相対指標 尤度比検定によるモデル比較 クラス数を増やしても有意じゃなくなるところまで、クラス数を増やして分析を繰り返す
- 85. 出力の見方 85 相対指標 尤度比検定によるモデル比較 クラス数を増やしても有意じゃなくなるところまで、クラス数を増やして分析を繰り返す
- 86. 出力の見方:次に分類精度 86 各クラスメンバーの、 各クラスへの所属確率 Entoropy クラスサイズ パラメータ
- 88. 出力の見方 88 条件付き応答確率 (プロット) 「View graph」 を押し、 “Sample propoNon and esNmated Probability”を 選択しView をクリック
- 89. 出力の見方 89 条件付き応答確率 (プロット) “plot esNmated only」を選択し、 完了をクリック どの選択肢の 応答確率を提示す るか選択し、OK!!
- 92. 共変量を含むモデル MODEL: %OVERALL% c on age gender; 92 MODELコマンドで、共変量が潜在クラスに回帰することを指定
- 93. 参考図書 93 入門・理論的 解析のノウハウ 日本語
- 94. TAKE HOME MESSAGE 94 • LCA、母集団に潜在する部分母集団の存在 を項目群への反応パターンから検出 • BICかBLRTでクラス数を判断 • entropy、所属確率から分類精度を判断 • 条件付き応答確率のパターンプロットで、 各クラスの特徴を解釈・記述