SlideShare ist ein Scribd-Unternehmen logo
1 von 5
Downloaden Sie, um offline zu lesen
MOISTURE EQUILIBRIUM IN PAPER-OIL INSULATION SYSTEMS
T. v. Oommen, Member, IEEE
Westinghouse Electric Corporation
469 Sharpsville Ave.
Sharon, Pennsylvania 16146
Summary
Electrical equipment such as power
transformers with a paper-oil insulating system
have varying rnaisture levels dependent on ambient
and operating conditions. The total water content
is distributed between the paper and the oil in a
ratio that is predominantly in favor of the
paper. Small changes in temperature significantly
alter the water content of the oil, but only
slightly that of the paper. To prediet these
changes isotherms showing the relationship between
the water content of the paper and of the oil may
be used. These isotherms may be obtained
experimentally, or more easily by combining known
absorption curves for paper and oil; refinement
and extrapolation to lower humidity range may be
done with the help of theoretica! relationsbips
such as the Langmuir, Freundlich and the B.E.T.
isotherms and Arrhenius type temperature
dependence. Equilibrium curves constructed by
these methods are presented and discussed.
Moisture Equilibrium Curves
The insulation system in an electrical
equipment such as a power transformer consists of
cellulosic materials (paper and pressboard) and
processed mineral oil. The insulation is first
dried out to a rnaisture level in the range 0.3 to
1. 0 percent and then oil impregnated and final ly
immersed in oil.
Since paper has a great affinity for water,
the residual rnaisture will be mostly in the solid
insulation. At 20°C the paper will hold 3000
times more water than oil. As the temperature
rises the affinity for water is lowered for the
paper while the reverse is true for the oil. Thus
at 40°C the distribution ratio is 1000 to 1 for
the paper-oil system, and at 60°C the ratio is 400
to 1.
The rnaisture distri bution characteristics are
easily deduced from a set of rnaisture equilibrium
curves at several temperatures. The best known
set of such curves is the 'Fabre-Pichon Curves'
publisbed in a 1960 CIGRE paper,l see Figure 1.
Since the rnaisture level in the insulation is
usually below 2 percent, only the lower part of
the curves are used. Another set of curves
obtained from more recent data will be presented
later.
The uses of these curves for practical
interpretations are many. As noted above, the
distribution ratios at various temperatures are
obtained. Another valuable application is in
estimating the rnaisture in the insulation from
rnaisture measurements on an oil sample. When the
equipment is in operation this is perhaps the only
method of estimating the rnaisture level in the
insulation. To illustrate, if the moisture level
in the oil at 30°C is 3 ppm, the corresponding
CH1952-ll83/0000-0162 $1.00 © 1983 IEEE 162
level in the paper is a bout one percent. It is
possible to prediet what the rnaisture level in the
oil will be at an elevated temperature. The
rnaisture level in the paper remains virtually the
same over a wide range of temperatures, hence it
is only necessary to read the rnaisture level in
oil from the isotherm for the required
temperature. Thus, at 70°C, the rnaisture level in
oil could be 9 ppm if the moisture level in the
paper is one percent as at 30°C. On cooling down
to 30°C, the rnaisture level should return to
3 ppm, but in practice it may take a long time for
equilibration. The measured rnaisture content in
oil could therefore be between 3 and 9 ppm. The
use of the curves to prediet the rnaisture level in
insulation under non-equilibrium conditions will
result in erroneous estimates.
10
8
6
4
0 20 40
PPM WATER IN OIL
Figure 1. Fabre-Pichon Curves for
Moisture Distri bution in Kraft Paper/Oil
System, Ref. 1
What happens on cooling the system is of
special significance. The rnaisture level in oil at
operating temperatures is low enough to preserve
the full electrical strength which is determined
by the degree of rnaisture saturation. At 70°C the
saturation level is 360 ppm, hence 9 ppm is less
than 3 percent saturation. The electric strength
of oil deteriorates appreciably only above SO
percent saturation. There are situations where
this degree of saturation may result if the oil is
rapidly caoled to sub-zero temperatures when the
rnaisture solubility is considerably lower. It is
even possible to exceed saturation values and form
water droplets or ice, especially in the cooler
parts such as radiators. If the equipment is
re-energized in this condition, dielectric failure
is possible due to the presence of water
droplets. The presence of above normal levels of
rnaisture in oil should therefore be taken
seriously.
Construction of Equilibrium Curves
One set of equilibrium curves, as in Figure
1, may not be applicable to all systems because
both the paper and the oil may be of different
types. Direct equilibration of paper in oil at
several temperatures in a laboratory setup is
possible, but takes considerable time. One recent
publication2 gives data on rnaisture levels by
this method but isotherms have not been presented.
An indirect method of obtaining the curves
will be discussed below. This invalves the
combination of the rnaisture equilibrium curves for
paper and oil obtained independently. One
advantage of this methad is that paper that is not
oil impregnated achieves equilibrium conditlons at
various relative humidities much faster than
oil-impregnated paper. Another advantage is that
the equilibrium rnaisture content of oil at various
relative humidities is easily obtained from
solubility data.
The major part of the effort is in obtaining
the sorption curves for paper at several
temperatures. Sorption is a general term covering
adsorption and desorption. For cellulose and
other natura! fibers, the equilibrium curves
(showing rnaisture content at various relative
humidities) for adsorption and desorption are
different, hence same difficulty arises in
chaosing the sorption curves. The sorption
characteristics for paper are discussed in more
detail below.
Sorption Curves for Paper
Electrical grade paper is made from 100%
kraft wood pulp. The sorption characteristics of
paper and the raw pulp may be assurned to be
identical. However, the sorption curves for wood
pulp are significantly different from those for
catton fibers, the purest form of natura!
cellulose.
We may use published data on the sorption
characteristics of wood pulp, such as Jeffries3,
shown in Table I.
The sorption isotherms constructed from this
data are shown in Figure 2. The slightly
different paths for adsorption and desorption are
due to hysterisis effect. If the sample is not
dried out completely and is allowed to adsorb
rnaisture from an intermediate rnaisture range on
the desorption path, the adsorption path will be
initially a tie-line conneeting the two paths,
merging with the adsorption curve (see Figure 2
for a specific case). A similar situation exists
when a sample is dried from an intermediate
rnaisture range on the adsorption path. Since it
is difficult to know whether the starting point is
on the adsorption or desorption curve, same
163
uncertainty exists in predieting the direction of
the initia! path. Insulation is usually dri ed out
to very low rnaisture levels, henee adsorption of
rnaisture should follow an adsorption path close to
the true path.
Table I
Sorption Date for Wood Pulp, Ref. 3
Moisture in Pulp, %
R.H. 3o•c 6o•c 9o•c
% a d a d a d
s 1.7S 1.2S 1.2S 1.4 0.8S 0.9S
10 2.4 2.8 1.8 1. 9S 1.4 l.SS
20 3.4 3.8S 2.7 2.9 2.1 2.3
30 4.4 4.8S 3.S 3.7S 2.7S 3.1
40 S.2S S.9 4.2S 4.6 3.4 3.8S
so 6.2 7.0S S.l s.ss 4.1 4.7
60 7.3 8.2 6.0 6.6 4.9S s.6S
70 8.4S 9.SS 7.0S 7.9S S.8S 6.7S
80 10.1 U.4S 8.6 9.8 7.6 8.7S
90 13.3 lS.l 11.6 10.6
9S 16.6 14.7 12.8
100 2S 22 18
a: adsorption; d: desorption
..
...
~
...
Q
0
0
•
•
c
•
=
•
-
12
10
a
•
4
2
Figure 2.
Pulp from
Sorption
Jeffries'
Curves
Data,
for Wood
Table I
The sorption curves may be obtained for
intermediate temperatures by appropriate
interpolation techniques. One of the most useful
relationships for interpolation is
log W = A+!
T
(1)
where W is the water content, T is the absolute
temperature, and A and B are constants.4 Linear
plots may be constructed using semi-log vs. 1/T
graph paper. A set of plots for rnaisture
adsorption at the various relative humidities are
shown in Figure 3. A similar set may be
-rr-
TEMPERATURE C
Figure 3. Moisture Content Variation
with Temperature: log W vs. 1/T Plots
constructed for rnaisture desorption. Figure 4 is
a set of adsorption isotherms constructed from the
plots in Figure 3 for the temperature range o•c to
loo•c at 1o•c intervals. Relative humidities
above 50 percent are not considered here.
Other relationships such as B.E.T.,
Freundlich and Langmuir (discussed later) may also
be used, but are more cumbersome.
Sorption of Moisture by Insulating Oil
Insulating oils such as transformer oil have
law affinity for water; there is, however,
difference in solubility characteristics between
paraffinic and naphthenic oils. Naphthenic oils
absorb more moisture, perhaps due to the higher
aromatic content. The solubility i ncreases
markedly with increasing temperature. Thus, at
3o•c, normally refined transformer oil
(naphthenic) dissolves a bout 80 ppm moisture; at
7o•c the solubility is 360 ppm. Since the
solubility limit corresponds to a 100 percent
humidity level, solubility at lower humidities are
164
111
a:
::I
1-
Ul
ë
:E
1/1
16
14
8
,._ RELATIVE HUMIDITY
I
I
·I
I
100
Figure 4. Adsorption Curves for Wood
Pulp Based on Figure 3.
also needed. Fortunately, the solubility of water
in oil is linearly proportional to the relative
humidity5, so it is easy to obtain data for any
given relative humidity. Table II gives the
solubility data at various relative humidities and
temperatures for normally refined naphthenic
transformer oil. The saturation values for 100%
humidity may be computed for any temperature from
the equation:
T, •c
0
10
20
30
40
50
60
70
80
90
100
log S - 1670 + 7.42
T
Table II
Sorption of Water in Oil
Relative Humidity, %
10 20 30 40 50
PPM Water in Oil
2 4 6 8 10
3.3 6.6 9.9 13.2 16.5
5.3 10.6 15.9 21.2 26.5
8 16 24 32 40
12 24 36 48 60
18 36 54 72 90
26 52 78 104 130
36 72 108 144 180
50 100 150 200 250
66 132 198 264 330
88 176 264 352 440
(2)
100
(S)
20
33
53
80
120
180
260
360
500
660
880
Sorption Curves for Paper-Oil System
By combining the sorption data on paper
(Figure 4) and the data in Table II, we may obtain
a set of curves shown in Figure 5. The broken
lines indicate desorption curves. At low rnaisture
levels they tend to merge with the adsorption
curves.
a:
w
~
é(
~
z
w
a:
:::1
1-
{/)
0
2
~
8
40 60
PPM MOISTURE IN OIL
Figure 5. Moisture
for Paper-Oil System
Equilibrium Curves
Figure 5 may be compared with Figure 1
obtained by direct measurements on a paper-oil
system. At elevated temperatures the isotherms
are similar, but at lower temperatures some
divergence is observed. This could be due to
incomplete equilibrium conditions in the paper-oil
system at lower temperatures which cause the
measured rnaisture level in oil higher than
expected levels.
Sorption Curves for the Low Moisture Region
The curves in Figure 1 and 5 are not very
reliable in the low rnaisture range, e.g., below 2
percent in the paper. Conditioning of paper below
10 percent R.H. is impractical, hence other
methods are used. The best method, perhaps, is to
measure the vapor pressure of water in the gas
space above the sample in a sealed system. Beer
et. al. reported in 1966 a set of plots
constructed from data based on this technique.6
Since relative humidity and
are connected by the relationship
% R.H.
vapor pressure
(3)
165
where p0 is the saturated water vapor pressure,
it is easy to construct sorption curves similar to
Figure 4. These curves may be combined with the
data in Table II to construct the desired sorption
curves. Figure 6 shows the sorption curves for
kraft paper (or pressboard) oil system in the low
rnaisture range obtained by this method.
i
,..
..
!
!!
0
:I
"'
Solubility Limit, PPM
20 JO 50 80 120
5 ..~~~-T~~_,~-r--r-~--~-.--,
- IIIOI8TURI! IN OL
Figure 6. Moisture Equilibrium Curves
for Paper-Oil System, Low Moisture Region
Sorption Isotherms: General?
The sorption curves in Figure
fitted exactly by any mathematica!
but several relationsbips are known
approximations at different rnaisture
4 cannot be
relationship,
that are good
ranges.
1. Low Moisture Region: The Langmuir
2.
relationship:
(4)
is applicable. This is a theoretica!
relationship derived on the assumption
that a unimolecular layer of water builds
up, rapidly at first, then slower, as the
vapor pressure is increased. The curve
should flatten out to a horizontal line.
(w is water content per unit weight of
paper.)
Low and Intermediate Range: The
Freundlich or classica! isotherm,
W = Kpl/n (5)
is empirical in nature but is the most
widely used relationship. This becomes a
linear relationship when log W and log p
are used. The plots due to Beer et. al.,
previously menticned were obtained in
this manner.
a:
w
a.
c
a.
3. The Full Range:
A theoretical relationship known as the
B.E.T. equation was derived by Brunauer,
Emmett and Teller on the assumption of a
multi-layer adsorption model. Initially
a monolayer is formed, but additional
layers of water molecules are built up
thereafter which cause the sorption curve
to go steep again at high relative
humdities. The B.E.T. relationship is
given in simplified form:
(6)
where x
w
p/p0 or (R.H.)/100
Water content per unit weight of
paper
4
w corresponding to a monolayer
A constant, but temperature
dependent by an exponentlal
relationship
The equation may be reduced to a linear
form:
y=a+mx (7)
where m is the slope.
I
"'/
MEASU~ED
I 
'. LANGMUIR
100
... RELATIVE HUMIDITY
Figure 7.
Adsorption
Experimental
Comparison
Isotherms
Curve
of Predicted
with
for
the
70°C.
166
Any of above relationships, especially the
linear farms may be used for interpolation. The
sorption curves may then be reconstructed.
Figure 7 shows reconstructed B.E.T., Langmuir
and Freundlich adsorption isotherms for paper at
70°C, and compares with the measured isotherm
(Figure 4). A common point was selee ted at 2. 5
percent water content. The observations noted
above are validated by the curves.
eonelusion
Moisture equilibrium curves for a paper-oil
system may be obtained indirectly by combining the
sorption curves for paper and oil. The curves
enable estimation of rnaisture level in insulation
from rnaisture measurements on oil. Predietion of
rnaisture changes during warmup and cooling is
possible, but eautien must be exercised in the
interpretation because of the possibility for
non-equilibrium condition at the time of the
measurement s.
1.
2.
3.
4.
5.
6.
7.
1340E
References
J. Fabre and A. Pichon, "Deteriorating
Processes and Products of Paper in Oil,
Application to Transformers" CIGRE Paper No.
137, 1960.
w. w. Guidi and
Methods
H.
for
P. Fullerton,
Predietion of
"Mathematical
Moisture Take-Up and Removed in Large Power
Transformers," Paper C74 242-4 presented at
the 1974 IEEE PES Winter Meeting, New York.
R. Jeffries,
Cellulose and
Journal of
Transactions,
339-74.
"The Sorption of
Eight Other Textile
the Textile
Vol. 51, No. 9,
Water by
Polymers,"
Institute
1960, PP•
w. A. Wink, "The Effect of Relative Humidity
and Temperature on Paper Properties, TAPPI,
Vol. 44, No. 6, 1961, pp. 171-80.
J. Bingeli, J. Froidevaux and R. Kratzer,
"The Treatment of Transformers, Quality and
Completion Criteria and the Process, CIGRE
Paper No. 110, 1966.
G. Beer, G. Gasparani, F. Osimo and F. Ross,
"Experimental Data on the Drying-out of
Insulation Samples and Test Coil for
Transformers" CIGRE Paper No. 135, 1966.
S. Glasstone, Textbook of Physical Chemistry,
Secend Ed. Van Nostrand Co., 1946, Chapter
XIV.

Weitere ähnliche Inhalte

Ähnlich wie Curvas de oommen.pdf

This report outlines the procedure followed during the distilla.docx
This report outlines the procedure followed during the distilla.docxThis report outlines the procedure followed during the distilla.docx
This report outlines the procedure followed during the distilla.docxherthalearmont
 
Dryer Surface Temperature Response Characteristics
Dryer Surface Temperature Response CharacteristicsDryer Surface Temperature Response Characteristics
Dryer Surface Temperature Response CharacteristicsKadant Inc.
 
Agc wp-dissolved gases in transformer insulation fluids
Agc wp-dissolved gases in transformer insulation fluidsAgc wp-dissolved gases in transformer insulation fluids
Agc wp-dissolved gases in transformer insulation fluidsAGC International, LLC
 
Evaporation effects on jetting performance
Evaporation effects on jetting performanceEvaporation effects on jetting performance
Evaporation effects on jetting performanceRobert Cornell
 
Distillation Blending and Cutpoint Temperature Optimization in Scheduling Ope...
Distillation Blending and Cutpoint Temperature Optimization in Scheduling Ope...Distillation Blending and Cutpoint Temperature Optimization in Scheduling Ope...
Distillation Blending and Cutpoint Temperature Optimization in Scheduling Ope...Brenno Menezes
 
245887main meteorology teacherres-ch11.r3
245887main meteorology teacherres-ch11.r3245887main meteorology teacherres-ch11.r3
245887main meteorology teacherres-ch11.r3Tanvir Shovon
 
Peer Reviewed CETI 14-045: Experimental Investigation of Wet Gas Dew Point Pr...
Peer Reviewed CETI 14-045: Experimental Investigation of Wet Gas Dew Point Pr...Peer Reviewed CETI 14-045: Experimental Investigation of Wet Gas Dew Point Pr...
Peer Reviewed CETI 14-045: Experimental Investigation of Wet Gas Dew Point Pr...Uchenna Odi, PhD, MBA
 
2015_Doble Paper
2015_Doble Paper2015_Doble Paper
2015_Doble PaperKevin Riley
 
PyTeCK: A Python-based automatic testing package for chemical kinetic models
PyTeCK: A Python-based automatic testing package for chemical kinetic modelsPyTeCK: A Python-based automatic testing package for chemical kinetic models
PyTeCK: A Python-based automatic testing package for chemical kinetic modelsOregon State University
 
J2006 termodinamik 1 unit8
J2006 termodinamik 1 unit8J2006 termodinamik 1 unit8
J2006 termodinamik 1 unit8Malaysia
 
Gas laws in anaesthesia
Gas laws in anaesthesiaGas laws in anaesthesia
Gas laws in anaesthesiaDavis Kurian
 
Desiccant
DesiccantDesiccant
Desiccantahp2011
 
Liquid Nitrogen Cooling in an Electronic Equipment under low pressure
Liquid Nitrogen Cooling in an Electronic Equipment under low pressureLiquid Nitrogen Cooling in an Electronic Equipment under low pressure
Liquid Nitrogen Cooling in an Electronic Equipment under low pressureUsamaArifKhanNiazi
 
Psychrometry and air conditioning
Psychrometry and air conditioningPsychrometry and air conditioning
Psychrometry and air conditioningnitin184shukla
 
RADTEC98_rheology_final
RADTEC98_rheology_finalRADTEC98_rheology_final
RADTEC98_rheology_finalPatrick Yang
 
HMT HEAT EXCHAnnnvnnbnnbnnvnvnvnvNGER 1.pdf
HMT HEAT EXCHAnnnvnnbnnbnnvnvnvnvNGER 1.pdfHMT HEAT EXCHAnnnvnnbnnbnnvnvnvnvNGER 1.pdf
HMT HEAT EXCHAnnnvnnbnnbnnvnvnvnvNGER 1.pdfRaviShankar269655
 

Ähnlich wie Curvas de oommen.pdf (20)

This report outlines the procedure followed during the distilla.docx
This report outlines the procedure followed during the distilla.docxThis report outlines the procedure followed during the distilla.docx
This report outlines the procedure followed during the distilla.docx
 
Dryer Surface Temperature Response Characteristics
Dryer Surface Temperature Response CharacteristicsDryer Surface Temperature Response Characteristics
Dryer Surface Temperature Response Characteristics
 
Agc wp-dissolved gases in transformer insulation fluids
Agc wp-dissolved gases in transformer insulation fluidsAgc wp-dissolved gases in transformer insulation fluids
Agc wp-dissolved gases in transformer insulation fluids
 
Evaporation effects on jetting performance
Evaporation effects on jetting performanceEvaporation effects on jetting performance
Evaporation effects on jetting performance
 
8 ee7 hve lab manual
8 ee7 hve lab manual8 ee7 hve lab manual
8 ee7 hve lab manual
 
Distillation Blending and Cutpoint Temperature Optimization in Scheduling Ope...
Distillation Blending and Cutpoint Temperature Optimization in Scheduling Ope...Distillation Blending and Cutpoint Temperature Optimization in Scheduling Ope...
Distillation Blending and Cutpoint Temperature Optimization in Scheduling Ope...
 
245887main meteorology teacherres-ch11.r3
245887main meteorology teacherres-ch11.r3245887main meteorology teacherres-ch11.r3
245887main meteorology teacherres-ch11.r3
 
Peer Reviewed CETI 14-045: Experimental Investigation of Wet Gas Dew Point Pr...
Peer Reviewed CETI 14-045: Experimental Investigation of Wet Gas Dew Point Pr...Peer Reviewed CETI 14-045: Experimental Investigation of Wet Gas Dew Point Pr...
Peer Reviewed CETI 14-045: Experimental Investigation of Wet Gas Dew Point Pr...
 
2015_Doble Paper
2015_Doble Paper2015_Doble Paper
2015_Doble Paper
 
Termo 7 ca 03 1
Termo 7 ca 03 1Termo 7 ca 03 1
Termo 7 ca 03 1
 
PyTeCK: A Python-based automatic testing package for chemical kinetic models
PyTeCK: A Python-based automatic testing package for chemical kinetic modelsPyTeCK: A Python-based automatic testing package for chemical kinetic models
PyTeCK: A Python-based automatic testing package for chemical kinetic models
 
J2006 termodinamik 1 unit8
J2006 termodinamik 1 unit8J2006 termodinamik 1 unit8
J2006 termodinamik 1 unit8
 
Gas laws in anaesthesia
Gas laws in anaesthesiaGas laws in anaesthesia
Gas laws in anaesthesia
 
Desiccant
DesiccantDesiccant
Desiccant
 
Liquid Nitrogen Cooling in an Electronic Equipment under low pressure
Liquid Nitrogen Cooling in an Electronic Equipment under low pressureLiquid Nitrogen Cooling in an Electronic Equipment under low pressure
Liquid Nitrogen Cooling in an Electronic Equipment under low pressure
 
Moisture in textile
Moisture in textileMoisture in textile
Moisture in textile
 
Psychrometry and air conditioning
Psychrometry and air conditioningPsychrometry and air conditioning
Psychrometry and air conditioning
 
RADTEC98_rheology_final
RADTEC98_rheology_finalRADTEC98_rheology_final
RADTEC98_rheology_final
 
HMT HEAT EXCHAnnnvnnbnnbnnvnvnvnvNGER 1.pdf
HMT HEAT EXCHAnnnvnnbnnbnnvnvnvnvNGER 1.pdfHMT HEAT EXCHAnnnvnnbnnbnnvnvnvnvNGER 1.pdf
HMT HEAT EXCHAnnnvnnbnnbnnvnvnvnvNGER 1.pdf
 
Capillary Rise
Capillary RiseCapillary Rise
Capillary Rise
 

Kürzlich hochgeladen

Top Rated Pune Call Girls Budhwar Peth ⟟ 6297143586 ⟟ Call Me For Genuine Se...
Top Rated  Pune Call Girls Budhwar Peth ⟟ 6297143586 ⟟ Call Me For Genuine Se...Top Rated  Pune Call Girls Budhwar Peth ⟟ 6297143586 ⟟ Call Me For Genuine Se...
Top Rated Pune Call Girls Budhwar Peth ⟟ 6297143586 ⟟ Call Me For Genuine Se...Call Girls in Nagpur High Profile
 
Glass Ceramics: Processing and Properties
Glass Ceramics: Processing and PropertiesGlass Ceramics: Processing and Properties
Glass Ceramics: Processing and PropertiesPrabhanshu Chaturvedi
 
Call for Papers - African Journal of Biological Sciences, E-ISSN: 2663-2187, ...
Call for Papers - African Journal of Biological Sciences, E-ISSN: 2663-2187, ...Call for Papers - African Journal of Biological Sciences, E-ISSN: 2663-2187, ...
Call for Papers - African Journal of Biological Sciences, E-ISSN: 2663-2187, ...Christo Ananth
 
Russian Call Girls in Nagpur Grishma Call 7001035870 Meet With Nagpur Escorts
Russian Call Girls in Nagpur Grishma Call 7001035870 Meet With Nagpur EscortsRussian Call Girls in Nagpur Grishma Call 7001035870 Meet With Nagpur Escorts
Russian Call Girls in Nagpur Grishma Call 7001035870 Meet With Nagpur EscortsCall Girls in Nagpur High Profile
 
Online banking management system project.pdf
Online banking management system project.pdfOnline banking management system project.pdf
Online banking management system project.pdfKamal Acharya
 
MANUFACTURING PROCESS-II UNIT-1 THEORY OF METAL CUTTING
MANUFACTURING PROCESS-II UNIT-1 THEORY OF METAL CUTTINGMANUFACTURING PROCESS-II UNIT-1 THEORY OF METAL CUTTING
MANUFACTURING PROCESS-II UNIT-1 THEORY OF METAL CUTTINGSIVASHANKAR N
 
UNIT-V FMM.HYDRAULIC TURBINE - Construction and working
UNIT-V FMM.HYDRAULIC TURBINE - Construction and workingUNIT-V FMM.HYDRAULIC TURBINE - Construction and working
UNIT-V FMM.HYDRAULIC TURBINE - Construction and workingrknatarajan
 
Structural Analysis and Design of Foundations: A Comprehensive Handbook for S...
Structural Analysis and Design of Foundations: A Comprehensive Handbook for S...Structural Analysis and Design of Foundations: A Comprehensive Handbook for S...
Structural Analysis and Design of Foundations: A Comprehensive Handbook for S...Dr.Costas Sachpazis
 
Processing & Properties of Floor and Wall Tiles.pptx
Processing & Properties of Floor and Wall Tiles.pptxProcessing & Properties of Floor and Wall Tiles.pptx
Processing & Properties of Floor and Wall Tiles.pptxpranjaldaimarysona
 
High Profile Call Girls Nagpur Meera Call 7001035870 Meet With Nagpur Escorts
High Profile Call Girls Nagpur Meera Call 7001035870 Meet With Nagpur EscortsHigh Profile Call Girls Nagpur Meera Call 7001035870 Meet With Nagpur Escorts
High Profile Call Girls Nagpur Meera Call 7001035870 Meet With Nagpur EscortsCall Girls in Nagpur High Profile
 
AKTU Computer Networks notes --- Unit 3.pdf
AKTU Computer Networks notes ---  Unit 3.pdfAKTU Computer Networks notes ---  Unit 3.pdf
AKTU Computer Networks notes --- Unit 3.pdfankushspencer015
 
Java Programming :Event Handling(Types of Events)
Java Programming :Event Handling(Types of Events)Java Programming :Event Handling(Types of Events)
Java Programming :Event Handling(Types of Events)simmis5
 
The Most Attractive Pune Call Girls Budhwar Peth 8250192130 Will You Miss Thi...
The Most Attractive Pune Call Girls Budhwar Peth 8250192130 Will You Miss Thi...The Most Attractive Pune Call Girls Budhwar Peth 8250192130 Will You Miss Thi...
The Most Attractive Pune Call Girls Budhwar Peth 8250192130 Will You Miss Thi...ranjana rawat
 
The Most Attractive Pune Call Girls Manchar 8250192130 Will You Miss This Cha...
The Most Attractive Pune Call Girls Manchar 8250192130 Will You Miss This Cha...The Most Attractive Pune Call Girls Manchar 8250192130 Will You Miss This Cha...
The Most Attractive Pune Call Girls Manchar 8250192130 Will You Miss This Cha...ranjana rawat
 
UNIT-III FMM. DIMENSIONAL ANALYSIS
UNIT-III FMM.        DIMENSIONAL ANALYSISUNIT-III FMM.        DIMENSIONAL ANALYSIS
UNIT-III FMM. DIMENSIONAL ANALYSISrknatarajan
 
MANUFACTURING PROCESS-II UNIT-5 NC MACHINE TOOLS
MANUFACTURING PROCESS-II UNIT-5 NC MACHINE TOOLSMANUFACTURING PROCESS-II UNIT-5 NC MACHINE TOOLS
MANUFACTURING PROCESS-II UNIT-5 NC MACHINE TOOLSSIVASHANKAR N
 
(PRIYA) Rajgurunagar Call Girls Just Call 7001035870 [ Cash on Delivery ] Pun...
(PRIYA) Rajgurunagar Call Girls Just Call 7001035870 [ Cash on Delivery ] Pun...(PRIYA) Rajgurunagar Call Girls Just Call 7001035870 [ Cash on Delivery ] Pun...
(PRIYA) Rajgurunagar Call Girls Just Call 7001035870 [ Cash on Delivery ] Pun...ranjana rawat
 
Call Girls Pimpri Chinchwad Call Me 7737669865 Budget Friendly No Advance Boo...
Call Girls Pimpri Chinchwad Call Me 7737669865 Budget Friendly No Advance Boo...Call Girls Pimpri Chinchwad Call Me 7737669865 Budget Friendly No Advance Boo...
Call Girls Pimpri Chinchwad Call Me 7737669865 Budget Friendly No Advance Boo...roncy bisnoi
 

Kürzlich hochgeladen (20)

Top Rated Pune Call Girls Budhwar Peth ⟟ 6297143586 ⟟ Call Me For Genuine Se...
Top Rated  Pune Call Girls Budhwar Peth ⟟ 6297143586 ⟟ Call Me For Genuine Se...Top Rated  Pune Call Girls Budhwar Peth ⟟ 6297143586 ⟟ Call Me For Genuine Se...
Top Rated Pune Call Girls Budhwar Peth ⟟ 6297143586 ⟟ Call Me For Genuine Se...
 
(INDIRA) Call Girl Aurangabad Call Now 8617697112 Aurangabad Escorts 24x7
(INDIRA) Call Girl Aurangabad Call Now 8617697112 Aurangabad Escorts 24x7(INDIRA) Call Girl Aurangabad Call Now 8617697112 Aurangabad Escorts 24x7
(INDIRA) Call Girl Aurangabad Call Now 8617697112 Aurangabad Escorts 24x7
 
Glass Ceramics: Processing and Properties
Glass Ceramics: Processing and PropertiesGlass Ceramics: Processing and Properties
Glass Ceramics: Processing and Properties
 
Call for Papers - African Journal of Biological Sciences, E-ISSN: 2663-2187, ...
Call for Papers - African Journal of Biological Sciences, E-ISSN: 2663-2187, ...Call for Papers - African Journal of Biological Sciences, E-ISSN: 2663-2187, ...
Call for Papers - African Journal of Biological Sciences, E-ISSN: 2663-2187, ...
 
Russian Call Girls in Nagpur Grishma Call 7001035870 Meet With Nagpur Escorts
Russian Call Girls in Nagpur Grishma Call 7001035870 Meet With Nagpur EscortsRussian Call Girls in Nagpur Grishma Call 7001035870 Meet With Nagpur Escorts
Russian Call Girls in Nagpur Grishma Call 7001035870 Meet With Nagpur Escorts
 
Online banking management system project.pdf
Online banking management system project.pdfOnline banking management system project.pdf
Online banking management system project.pdf
 
MANUFACTURING PROCESS-II UNIT-1 THEORY OF METAL CUTTING
MANUFACTURING PROCESS-II UNIT-1 THEORY OF METAL CUTTINGMANUFACTURING PROCESS-II UNIT-1 THEORY OF METAL CUTTING
MANUFACTURING PROCESS-II UNIT-1 THEORY OF METAL CUTTING
 
UNIT-V FMM.HYDRAULIC TURBINE - Construction and working
UNIT-V FMM.HYDRAULIC TURBINE - Construction and workingUNIT-V FMM.HYDRAULIC TURBINE - Construction and working
UNIT-V FMM.HYDRAULIC TURBINE - Construction and working
 
Structural Analysis and Design of Foundations: A Comprehensive Handbook for S...
Structural Analysis and Design of Foundations: A Comprehensive Handbook for S...Structural Analysis and Design of Foundations: A Comprehensive Handbook for S...
Structural Analysis and Design of Foundations: A Comprehensive Handbook for S...
 
Processing & Properties of Floor and Wall Tiles.pptx
Processing & Properties of Floor and Wall Tiles.pptxProcessing & Properties of Floor and Wall Tiles.pptx
Processing & Properties of Floor and Wall Tiles.pptx
 
High Profile Call Girls Nagpur Meera Call 7001035870 Meet With Nagpur Escorts
High Profile Call Girls Nagpur Meera Call 7001035870 Meet With Nagpur EscortsHigh Profile Call Girls Nagpur Meera Call 7001035870 Meet With Nagpur Escorts
High Profile Call Girls Nagpur Meera Call 7001035870 Meet With Nagpur Escorts
 
AKTU Computer Networks notes --- Unit 3.pdf
AKTU Computer Networks notes ---  Unit 3.pdfAKTU Computer Networks notes ---  Unit 3.pdf
AKTU Computer Networks notes --- Unit 3.pdf
 
Java Programming :Event Handling(Types of Events)
Java Programming :Event Handling(Types of Events)Java Programming :Event Handling(Types of Events)
Java Programming :Event Handling(Types of Events)
 
The Most Attractive Pune Call Girls Budhwar Peth 8250192130 Will You Miss Thi...
The Most Attractive Pune Call Girls Budhwar Peth 8250192130 Will You Miss Thi...The Most Attractive Pune Call Girls Budhwar Peth 8250192130 Will You Miss Thi...
The Most Attractive Pune Call Girls Budhwar Peth 8250192130 Will You Miss Thi...
 
Water Industry Process Automation & Control Monthly - April 2024
Water Industry Process Automation & Control Monthly - April 2024Water Industry Process Automation & Control Monthly - April 2024
Water Industry Process Automation & Control Monthly - April 2024
 
The Most Attractive Pune Call Girls Manchar 8250192130 Will You Miss This Cha...
The Most Attractive Pune Call Girls Manchar 8250192130 Will You Miss This Cha...The Most Attractive Pune Call Girls Manchar 8250192130 Will You Miss This Cha...
The Most Attractive Pune Call Girls Manchar 8250192130 Will You Miss This Cha...
 
UNIT-III FMM. DIMENSIONAL ANALYSIS
UNIT-III FMM.        DIMENSIONAL ANALYSISUNIT-III FMM.        DIMENSIONAL ANALYSIS
UNIT-III FMM. DIMENSIONAL ANALYSIS
 
MANUFACTURING PROCESS-II UNIT-5 NC MACHINE TOOLS
MANUFACTURING PROCESS-II UNIT-5 NC MACHINE TOOLSMANUFACTURING PROCESS-II UNIT-5 NC MACHINE TOOLS
MANUFACTURING PROCESS-II UNIT-5 NC MACHINE TOOLS
 
(PRIYA) Rajgurunagar Call Girls Just Call 7001035870 [ Cash on Delivery ] Pun...
(PRIYA) Rajgurunagar Call Girls Just Call 7001035870 [ Cash on Delivery ] Pun...(PRIYA) Rajgurunagar Call Girls Just Call 7001035870 [ Cash on Delivery ] Pun...
(PRIYA) Rajgurunagar Call Girls Just Call 7001035870 [ Cash on Delivery ] Pun...
 
Call Girls Pimpri Chinchwad Call Me 7737669865 Budget Friendly No Advance Boo...
Call Girls Pimpri Chinchwad Call Me 7737669865 Budget Friendly No Advance Boo...Call Girls Pimpri Chinchwad Call Me 7737669865 Budget Friendly No Advance Boo...
Call Girls Pimpri Chinchwad Call Me 7737669865 Budget Friendly No Advance Boo...
 

Curvas de oommen.pdf

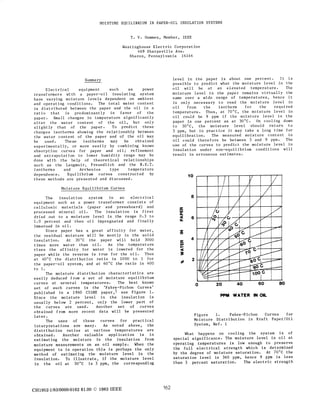
  • 1. MOISTURE EQUILIBRIUM IN PAPER-OIL INSULATION SYSTEMS T. v. Oommen, Member, IEEE Westinghouse Electric Corporation 469 Sharpsville Ave. Sharon, Pennsylvania 16146 Summary Electrical equipment such as power transformers with a paper-oil insulating system have varying rnaisture levels dependent on ambient and operating conditions. The total water content is distributed between the paper and the oil in a ratio that is predominantly in favor of the paper. Small changes in temperature significantly alter the water content of the oil, but only slightly that of the paper. To prediet these changes isotherms showing the relationship between the water content of the paper and of the oil may be used. These isotherms may be obtained experimentally, or more easily by combining known absorption curves for paper and oil; refinement and extrapolation to lower humidity range may be done with the help of theoretica! relationsbips such as the Langmuir, Freundlich and the B.E.T. isotherms and Arrhenius type temperature dependence. Equilibrium curves constructed by these methods are presented and discussed. Moisture Equilibrium Curves The insulation system in an electrical equipment such as a power transformer consists of cellulosic materials (paper and pressboard) and processed mineral oil. The insulation is first dried out to a rnaisture level in the range 0.3 to 1. 0 percent and then oil impregnated and final ly immersed in oil. Since paper has a great affinity for water, the residual rnaisture will be mostly in the solid insulation. At 20°C the paper will hold 3000 times more water than oil. As the temperature rises the affinity for water is lowered for the paper while the reverse is true for the oil. Thus at 40°C the distribution ratio is 1000 to 1 for the paper-oil system, and at 60°C the ratio is 400 to 1. The rnaisture distri bution characteristics are easily deduced from a set of rnaisture equilibrium curves at several temperatures. The best known set of such curves is the 'Fabre-Pichon Curves' publisbed in a 1960 CIGRE paper,l see Figure 1. Since the rnaisture level in the insulation is usually below 2 percent, only the lower part of the curves are used. Another set of curves obtained from more recent data will be presented later. The uses of these curves for practical interpretations are many. As noted above, the distribution ratios at various temperatures are obtained. Another valuable application is in estimating the rnaisture in the insulation from rnaisture measurements on an oil sample. When the equipment is in operation this is perhaps the only method of estimating the rnaisture level in the insulation. To illustrate, if the moisture level in the oil at 30°C is 3 ppm, the corresponding CH1952-ll83/0000-0162 $1.00 © 1983 IEEE 162 level in the paper is a bout one percent. It is possible to prediet what the rnaisture level in the oil will be at an elevated temperature. The rnaisture level in the paper remains virtually the same over a wide range of temperatures, hence it is only necessary to read the rnaisture level in oil from the isotherm for the required temperature. Thus, at 70°C, the rnaisture level in oil could be 9 ppm if the moisture level in the paper is one percent as at 30°C. On cooling down to 30°C, the rnaisture level should return to 3 ppm, but in practice it may take a long time for equilibration. The measured rnaisture content in oil could therefore be between 3 and 9 ppm. The use of the curves to prediet the rnaisture level in insulation under non-equilibrium conditions will result in erroneous estimates. 10 8 6 4 0 20 40 PPM WATER IN OIL Figure 1. Fabre-Pichon Curves for Moisture Distri bution in Kraft Paper/Oil System, Ref. 1 What happens on cooling the system is of special significance. The rnaisture level in oil at operating temperatures is low enough to preserve the full electrical strength which is determined by the degree of rnaisture saturation. At 70°C the saturation level is 360 ppm, hence 9 ppm is less than 3 percent saturation. The electric strength
  • 2. of oil deteriorates appreciably only above SO percent saturation. There are situations where this degree of saturation may result if the oil is rapidly caoled to sub-zero temperatures when the rnaisture solubility is considerably lower. It is even possible to exceed saturation values and form water droplets or ice, especially in the cooler parts such as radiators. If the equipment is re-energized in this condition, dielectric failure is possible due to the presence of water droplets. The presence of above normal levels of rnaisture in oil should therefore be taken seriously. Construction of Equilibrium Curves One set of equilibrium curves, as in Figure 1, may not be applicable to all systems because both the paper and the oil may be of different types. Direct equilibration of paper in oil at several temperatures in a laboratory setup is possible, but takes considerable time. One recent publication2 gives data on rnaisture levels by this method but isotherms have not been presented. An indirect method of obtaining the curves will be discussed below. This invalves the combination of the rnaisture equilibrium curves for paper and oil obtained independently. One advantage of this methad is that paper that is not oil impregnated achieves equilibrium conditlons at various relative humidities much faster than oil-impregnated paper. Another advantage is that the equilibrium rnaisture content of oil at various relative humidities is easily obtained from solubility data. The major part of the effort is in obtaining the sorption curves for paper at several temperatures. Sorption is a general term covering adsorption and desorption. For cellulose and other natura! fibers, the equilibrium curves (showing rnaisture content at various relative humidities) for adsorption and desorption are different, hence same difficulty arises in chaosing the sorption curves. The sorption characteristics for paper are discussed in more detail below. Sorption Curves for Paper Electrical grade paper is made from 100% kraft wood pulp. The sorption characteristics of paper and the raw pulp may be assurned to be identical. However, the sorption curves for wood pulp are significantly different from those for catton fibers, the purest form of natura! cellulose. We may use published data on the sorption characteristics of wood pulp, such as Jeffries3, shown in Table I. The sorption isotherms constructed from this data are shown in Figure 2. The slightly different paths for adsorption and desorption are due to hysterisis effect. If the sample is not dried out completely and is allowed to adsorb rnaisture from an intermediate rnaisture range on the desorption path, the adsorption path will be initially a tie-line conneeting the two paths, merging with the adsorption curve (see Figure 2 for a specific case). A similar situation exists when a sample is dried from an intermediate rnaisture range on the adsorption path. Since it is difficult to know whether the starting point is on the adsorption or desorption curve, same 163 uncertainty exists in predieting the direction of the initia! path. Insulation is usually dri ed out to very low rnaisture levels, henee adsorption of rnaisture should follow an adsorption path close to the true path. Table I Sorption Date for Wood Pulp, Ref. 3 Moisture in Pulp, % R.H. 3o•c 6o•c 9o•c % a d a d a d s 1.7S 1.2S 1.2S 1.4 0.8S 0.9S 10 2.4 2.8 1.8 1. 9S 1.4 l.SS 20 3.4 3.8S 2.7 2.9 2.1 2.3 30 4.4 4.8S 3.S 3.7S 2.7S 3.1 40 S.2S S.9 4.2S 4.6 3.4 3.8S so 6.2 7.0S S.l s.ss 4.1 4.7 60 7.3 8.2 6.0 6.6 4.9S s.6S 70 8.4S 9.SS 7.0S 7.9S S.8S 6.7S 80 10.1 U.4S 8.6 9.8 7.6 8.7S 90 13.3 lS.l 11.6 10.6 9S 16.6 14.7 12.8 100 2S 22 18 a: adsorption; d: desorption .. ... ~ ... Q 0 0 • • c • = • - 12 10 a • 4 2 Figure 2. Pulp from Sorption Jeffries' Curves Data, for Wood Table I
  • 3. The sorption curves may be obtained for intermediate temperatures by appropriate interpolation techniques. One of the most useful relationships for interpolation is log W = A+! T (1) where W is the water content, T is the absolute temperature, and A and B are constants.4 Linear plots may be constructed using semi-log vs. 1/T graph paper. A set of plots for rnaisture adsorption at the various relative humidities are shown in Figure 3. A similar set may be -rr- TEMPERATURE C Figure 3. Moisture Content Variation with Temperature: log W vs. 1/T Plots constructed for rnaisture desorption. Figure 4 is a set of adsorption isotherms constructed from the plots in Figure 3 for the temperature range o•c to loo•c at 1o•c intervals. Relative humidities above 50 percent are not considered here. Other relationships such as B.E.T., Freundlich and Langmuir (discussed later) may also be used, but are more cumbersome. Sorption of Moisture by Insulating Oil Insulating oils such as transformer oil have law affinity for water; there is, however, difference in solubility characteristics between paraffinic and naphthenic oils. Naphthenic oils absorb more moisture, perhaps due to the higher aromatic content. The solubility i ncreases markedly with increasing temperature. Thus, at 3o•c, normally refined transformer oil (naphthenic) dissolves a bout 80 ppm moisture; at 7o•c the solubility is 360 ppm. Since the solubility limit corresponds to a 100 percent humidity level, solubility at lower humidities are 164 111 a: ::I 1- Ul ë :E 1/1 16 14 8 ,._ RELATIVE HUMIDITY I I ·I I 100 Figure 4. Adsorption Curves for Wood Pulp Based on Figure 3. also needed. Fortunately, the solubility of water in oil is linearly proportional to the relative humidity5, so it is easy to obtain data for any given relative humidity. Table II gives the solubility data at various relative humidities and temperatures for normally refined naphthenic transformer oil. The saturation values for 100% humidity may be computed for any temperature from the equation: T, •c 0 10 20 30 40 50 60 70 80 90 100 log S - 1670 + 7.42 T Table II Sorption of Water in Oil Relative Humidity, % 10 20 30 40 50 PPM Water in Oil 2 4 6 8 10 3.3 6.6 9.9 13.2 16.5 5.3 10.6 15.9 21.2 26.5 8 16 24 32 40 12 24 36 48 60 18 36 54 72 90 26 52 78 104 130 36 72 108 144 180 50 100 150 200 250 66 132 198 264 330 88 176 264 352 440 (2) 100 (S) 20 33 53 80 120 180 260 360 500 660 880
  • 4. Sorption Curves for Paper-Oil System By combining the sorption data on paper (Figure 4) and the data in Table II, we may obtain a set of curves shown in Figure 5. The broken lines indicate desorption curves. At low rnaisture levels they tend to merge with the adsorption curves. a: w ~ é( ~ z w a: :::1 1- {/) 0 2 ~ 8 40 60 PPM MOISTURE IN OIL Figure 5. Moisture for Paper-Oil System Equilibrium Curves Figure 5 may be compared with Figure 1 obtained by direct measurements on a paper-oil system. At elevated temperatures the isotherms are similar, but at lower temperatures some divergence is observed. This could be due to incomplete equilibrium conditions in the paper-oil system at lower temperatures which cause the measured rnaisture level in oil higher than expected levels. Sorption Curves for the Low Moisture Region The curves in Figure 1 and 5 are not very reliable in the low rnaisture range, e.g., below 2 percent in the paper. Conditioning of paper below 10 percent R.H. is impractical, hence other methods are used. The best method, perhaps, is to measure the vapor pressure of water in the gas space above the sample in a sealed system. Beer et. al. reported in 1966 a set of plots constructed from data based on this technique.6 Since relative humidity and are connected by the relationship % R.H. vapor pressure (3) 165 where p0 is the saturated water vapor pressure, it is easy to construct sorption curves similar to Figure 4. These curves may be combined with the data in Table II to construct the desired sorption curves. Figure 6 shows the sorption curves for kraft paper (or pressboard) oil system in the low rnaisture range obtained by this method. i ,.. .. ! !! 0 :I "' Solubility Limit, PPM 20 JO 50 80 120 5 ..~~~-T~~_,~-r--r-~--~-.--, - IIIOI8TURI! IN OL Figure 6. Moisture Equilibrium Curves for Paper-Oil System, Low Moisture Region Sorption Isotherms: General? The sorption curves in Figure fitted exactly by any mathematica! but several relationsbips are known approximations at different rnaisture 4 cannot be relationship, that are good ranges. 1. Low Moisture Region: The Langmuir 2. relationship: (4) is applicable. This is a theoretica! relationship derived on the assumption that a unimolecular layer of water builds up, rapidly at first, then slower, as the vapor pressure is increased. The curve should flatten out to a horizontal line. (w is water content per unit weight of paper.) Low and Intermediate Range: The Freundlich or classica! isotherm, W = Kpl/n (5) is empirical in nature but is the most widely used relationship. This becomes a linear relationship when log W and log p are used. The plots due to Beer et. al., previously menticned were obtained in this manner.
  • 5. a: w a. c a. 3. The Full Range: A theoretical relationship known as the B.E.T. equation was derived by Brunauer, Emmett and Teller on the assumption of a multi-layer adsorption model. Initially a monolayer is formed, but additional layers of water molecules are built up thereafter which cause the sorption curve to go steep again at high relative humdities. The B.E.T. relationship is given in simplified form: (6) where x w p/p0 or (R.H.)/100 Water content per unit weight of paper 4 w corresponding to a monolayer A constant, but temperature dependent by an exponentlal relationship The equation may be reduced to a linear form: y=a+mx (7) where m is the slope. I "'/ MEASU~ED I '. LANGMUIR 100 ... RELATIVE HUMIDITY Figure 7. Adsorption Experimental Comparison Isotherms Curve of Predicted with for the 70°C. 166 Any of above relationships, especially the linear farms may be used for interpolation. The sorption curves may then be reconstructed. Figure 7 shows reconstructed B.E.T., Langmuir and Freundlich adsorption isotherms for paper at 70°C, and compares with the measured isotherm (Figure 4). A common point was selee ted at 2. 5 percent water content. The observations noted above are validated by the curves. eonelusion Moisture equilibrium curves for a paper-oil system may be obtained indirectly by combining the sorption curves for paper and oil. The curves enable estimation of rnaisture level in insulation from rnaisture measurements on oil. Predietion of rnaisture changes during warmup and cooling is possible, but eautien must be exercised in the interpretation because of the possibility for non-equilibrium condition at the time of the measurement s. 1. 2. 3. 4. 5. 6. 7. 1340E References J. Fabre and A. Pichon, "Deteriorating Processes and Products of Paper in Oil, Application to Transformers" CIGRE Paper No. 137, 1960. w. w. Guidi and Methods H. for P. Fullerton, Predietion of "Mathematical Moisture Take-Up and Removed in Large Power Transformers," Paper C74 242-4 presented at the 1974 IEEE PES Winter Meeting, New York. R. Jeffries, Cellulose and Journal of Transactions, 339-74. "The Sorption of Eight Other Textile the Textile Vol. 51, No. 9, Water by Polymers," Institute 1960, PP• w. A. Wink, "The Effect of Relative Humidity and Temperature on Paper Properties, TAPPI, Vol. 44, No. 6, 1961, pp. 171-80. J. Bingeli, J. Froidevaux and R. Kratzer, "The Treatment of Transformers, Quality and Completion Criteria and the Process, CIGRE Paper No. 110, 1966. G. Beer, G. Gasparani, F. Osimo and F. Ross, "Experimental Data on the Drying-out of Insulation Samples and Test Coil for Transformers" CIGRE Paper No. 135, 1966. S. Glasstone, Textbook of Physical Chemistry, Secend Ed. Van Nostrand Co., 1946, Chapter XIV.