Q3 2024 Earnings Conference Call and Webcast Slides
A study on performance of sector wise mutual fund schemes in India
1. 1
CHAPTER I
1.1Introduction
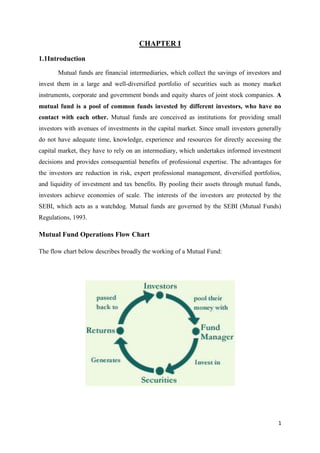
Mutual funds are financial intermediaries, which collect the savings of investors and
invest them in a large and well-diversified portfolio of securities such as money market
instruments, corporate and government bonds and equity shares of joint stock companies. A
mutual fund is a pool of common funds invested by different investors, who have no
contact with each other. Mutual funds are conceived as institutions for providing small
investors with avenues of investments in the capital market. Since small investors generally
do not have adequate time, knowledge, experience and resources for directly accessing the
capital market, they have to rely on an intermediary, which undertakes informed investment
decisions and provides consequential benefits of professional expertise. The advantages for
the investors are reduction in risk, expert professional management, diversified portfolios,
and liquidity of investment and tax benefits. By pooling their assets through mutual funds,
investors achieve economies of scale. The interests of the investors are protected by the
SEBI, which acts as a watchdog. Mutual funds are governed by the SEBI (Mutual Funds)
Regulations, 1993.
Mutual Fund Operations Flow Chart
The flow chart below describes broadly the working of a Mutual Fund:
2. 2
1.2 INDUSTRY PROFILE
History and Structure of Indian Mutual Fund Industry
The mutual fund industry in India started in 1963 with the formation of Unit Trust of
India, at the initiative of the Government of India and Reserve Bank. The history of mutual
funds in India can be broadly divided into four distinct phases:
First Phase – 1964-87
Unit Trust of India (UTI) was established on 1963 by an Act of Parliament. It was set
up by the Reserve Bank of India and functioned under the Regulatory and administrative
control of the Reserve Bank of India. In 1978 UTI was de-linked from the RBI and the
Industrial Development Bank of India (IDBI) took over the regulatory and administrative
control in place of RBI. The first scheme launched by UTI was Unit Scheme 1964. At the end
of 1988 UTI had Rs.6,700crores of assets under management.
Second Phase – 1987-1993 (Entry of Public Sector Funds)
1987 marked the entry of non- UTI, public sector mutual funds set up by public sector
banks and Life Insurance Corporation of India (LIC) and General Insurance Corporation of
India (GIC). SBI Mutual Fund was the first non- UTI Mutual Fund established in June 1987
followed by Canbank Mutual Fund (Dec 87), Punjab National Bank Mutual Fund (Aug 89),
Indian Bank Mutual Fund (Nov 89), Bank of India (Jun 90), Bank of Baroda Mutual Fund
(Oct 92). LIC established its mutual fund in June 1989 while GIC had set up its mutual fund
in December 1990. At the end of 1993, the mutual fund industry had assets under
management of Rs.47, 004 crores.
Third Phase – 1993-2003 (Entry of Private Sector Funds)
With the entry of private sector funds in 1993, a new era started in the Indian mutual
fund industry, giving the Indian investors a wider choice of fund families. Also, 1993 was the
year in which the first Mutual Fund Regulations came into being, under which all mutual
funds, except UTI were to be registered and governed. The erstwhile Kothari Pioneer (now
merged with Franklin Templeton) was the first private sector mutual fund registered in July
1993. The 1993 SEBI (Mutual Fund) Regulations were substituted by a more comprehensive
and revised Mutual Fund Regulations in 1996.
3. 3
Fourth Phase – since February 2003
In February 2003, following the repeal of the Unit Trust of India Act 1963 UTI was
bifurcated into two separate entities. One is the Specified Undertaking of the Unit Trust of
India with assets under management of Rs.29, 835 crores as at the end of January 2003,
representing broadly, the assets of US 64 scheme, assured return and certain other schemes.
The Specified Undertaking of Unit Trust of India, functioning under an administrator and
under the rules framed by Government of India and does not come under the purview of the
Mutual Fund Regulations.
Classification of Mutual Fund Schemes:
Any mutual fund has an objective of earning income for the investors and/ or getting
increased value of their investments. To achieve these objectives mutual funds adopt different
strategies and accordingly offer different schemes of investments. On this basis the simplest
way to categorize schemes would be to group these into two broad classifications:
Operational Classification and Portfolio Classification:
Operational classification highlights the two main types of schemes, i.e., open-ended and
close-ended which are offered by the mutual funds.
Portfolio classification projects the combination of investment instruments and investment
avenues available to mutual funds to manage their funds. Any portfolio scheme can be either
open ended or close ended.
Operational Classification
(A) Open Ended Schemes: As the name implies the size of the scheme (Fund) is open – i.e.,
not specified or pre-determined. Entry to the fund is always open to the investor who can
subscribe at any time. Such fund stands ready to buy or sell its securities at any time. It
implies that the capitalization of the fund is constantly changing as investors sell or buy their
shares.
(B) Close Ended Schemes: Such schemes have a definite period after which their shares/
units are redeemed. Unlike open-ended funds, these funds have fixed capitalization, i.e., their
corpus normally does not change throughout its life period. Close ended fund units trade
4. 4
among the investors in the secondary market since these are to be quoted on the stock
exchanges.
Portfolio Classification of Funds:
Following are the portfolio classification of funds, which may be offered. This classification
may be on the basis of (A) Return, (B) Investment Pattern, (C) Specialised sector of
investment, (D) Leverage and (E) Others.
(A) Return based classification:
To meet the diversified needs of the investors, the mutual fund schemes are made to enjoy a
good return. Returns expected are in form of regular dividends or capital appreciation or a
combination of these two.
1. Income Funds: For investors who are more curious for returns, Income funds are floated.
Their objective is to maximize current income. Such funds distribute periodically the income
earned by them. These funds can further be splitted up into categories: those that stress
constant income at relatively low risk and those that attempt to achieve maximum income
possible, even with the use of leverage. Obviously, the higher the expected returns, the higher
the potential risk of the investment.
2. Growth Funds: Such funds aim to achieve increase in the value of the underlying
investments through capital appreciation. Such funds invest in growth oriented securities
which can appreciate through the expansion production facilities in long run. An investor
who selects such funds should be able to assume a higher than normal degree of risk.
3. Conservative Funds: The fund with a philosophy of “all things to all” issue offer
document announcing objectives as: (i) To provide a reasonable rate of return, (ii) To protect
the value of investment and, (iii) To achieve capital appreciation consistent with the
fulfillment of the first two objectives.
(B) Investment Based Classification:
Mutual funds may also be classified on the basis of securities in which they invest. Basically,
it is renaming the subcategories of return based classification.
1. Equity Fund: Such funds, as the name implies, invest most of their investible shares in
equity shares of companies and undertake the risk associated with the investment in equity
5. 5
shares. Such funds are clearly expected to outdo other funds in rising market, because these
have almost all their capital in equity. Equity funds again can be of different categories
varying from those that invest exclusively in high quality „blue chip companies to those that
invest solely in the new, unestablished companies. The strength of these funds is the expected
capital appreciation. Naturally, they have a higher degree of risk.
2. Bond Funds: such funds have their portfolio consisted of bonds, debentures, etc. this type
of fund is expected to be very secure with a steady income and little or no chance of capital
appreciation. Obviously risk is low in such funds. In this category we may come across the
funds called „Liquid Funds‟ which specialize in investing short-term money market
instruments. The emphasis is on liquidity and is associated with lower risks and low returns.
3. Balanced Fund: The funds, which have in their portfolio a reasonable mix of equity and
bonds, are known as balanced funds. Such funds will put more emphasis on equity share
investments when the outlook is bright and will tend to switch to debentures when the future
is expected to be poor for shares.
(C) Sector Based Funds: There are number of funds that invest in a specified sector of
economy. While such funds do have the disadvantage of low diversification by putting all
their all eggs in one basket, the policy of specializing has the advantage of developing in the
fund managers an intensive knowledge of the specific sector in which they are investing.
1.3 ABOUT THE ORGANISATION
KARVY, is a premier integrated financial services provider, and ranked among the
top five in the country in all its business segments, services over 16 million individual
investors in various capacities, and provides investor services to over 300 corporate,
comprising the who is who of Corporate India. KARVY covers the entire spectrum of
financial services such as Stock broking, Depository Participants, Distribution of financial
products - mutual funds, bonds, fixed deposit, equities, Insurance Broking, Commodities
Broking, Personal Finance Advisory Services, Merchant Banking & Corporate Finance,
placement of equity, IPO‟s, among others. Karvy has a professional management team and
ranks among the best in technology, operations and research of various industrial segments.
6. 6
KARVY-EARLY DAYS
The birth of Karvy was on a modest scale in 1981. It began with the vision and
enterprise of a small group of practicing Chartered Accountants who founded the flagship
company Karvy Consultants Limited. We started with consulting and financial accounting
automation, and carved inroads into the field of registry and share accounting by 1985. Thus
over the last 20 years Karvy has traveled the success route, towards building a reputation as
an integrated financial services provider, offering a wide spectrum of services.
Vision of Karvy
Vision is crystal clear and its mind frame is much directed. “To be pioneering financial
services company. And continue to grow at a healthy pace, year after year, decade after
decade”. Company‟s foray into IT-enabled services and internet business has provided an
opportunity.
Mission Statement of Karvy
An organization exists to accomplish something or achieve something. The
mission statement indicates what an organization wants to achieve. The mission
statement may be changed periodically to take advantage of new opportunities or
respond to new market conditions. Karvy‟s mission statement is “To Bring
IndusKarvy works as intermediary between industry and people. Karvy work as
investment advisor and helps people to invest their money same way Karvy helps
industry in achieving finance from people by issuing shares, debentures, bonds,
mutual funds, fixed deposits etc. Company employees are to work independently yet
collectively towards achieving the organizations goals.
SERVICES
Commodities trading (NCDEX & MCX)
Personal finance advisory services
Corporate finance & merchant banking
Depository participant services (NSDL & CDSL)
Financial products distribution (investments/loan products)
Mutual fund services
Stock broking (NSE & BSE, F&O)
Insurance (life & general)
7. 7
Registrar & transfer agents
KARVY CONSULTANTS LIMITED
As the flagship company of the Karvy Group, Karvy Consultants Limited has always
remained at the helm of organizational affairs, pioneering business policies, work ethic and
channels of progress. They have now transferred this business into a joint venture with
Computer share Limited of Australia, the world‟s largest registrar. With a growing secondary
market presence, we have transferred this business to Karvy Stock Broking Limited (KSBL),
our associate and a member of NSE, BSE and HSE.
KARVY STOCK BROKING LIMITED
Member - National Stock Exchange (NSE), the Bombay Stock Exchange (BSE), and
The Hyderabad Stock Exchange (HSE).Karvy Stock Broking Limited, one of the
cornerstones of the Karvy edifice, flows freely towards attaining diverse goals of the
customer through varied services.
MUTUAL FUND SERVICES
Karvy have attained a position of immense strength as a provider of across-the-board
transfer agency services to AMCs, Distributors and Investors.Nearly 40% of the top-notch
AMCs including prestigious clients like Deutsche AMC and UTI swear by the quality and
range of services that we offer. Besides providing the entire back office processing, we
provide the link between various Mutual Funds and the investor, including services to the
distributor, the prime channel in this operation.
ACHIEVEMENTS
Among the top 5 stock brokers in India (4% of NSE volumes)
India's No. 1 Registrar & Securities Transfer Agents
Among the to top 3 Depository Participants
Largest Network of Branches & Business Associates
ISO 9002 certified operations by DNV
Among top 10 Investment bankers
Largest Distributor of Financial Products
Adjudged as one of the top 50 IT uses in India by MIS Asia
Full Fledged IT driven operations
8. 8
1.4 NEED FOR THE STUDY
Progressive liberalization of economic policies has led to a rapid growth of capital
market, money market and financial services industry. Consistent with this evolution of the
financial sector, the mutual fund industry has also come to occupy an important place in
India. It forms an important part of the capital market, providing the benefits of a diversified
portfolio and expert fund management to a large number of investors, particularly small
investors. With the improvement in deployment of investment through markets, the need and
scope for mutual fund operations has increased tremendously. Over the last couple of years
mutual funds have given impressive returns, especially equity funds. Many funds
outperformed markets. Equity markets were in the limelight. Investors who were not exposed
to equity stocks suddenly infused funds. AUM [Asset Under Management] grew considerably
and fund houses were on a spree of launching new schemes.
Growth funds which aim at giving capital appreciation invest in growth stocks of the
fastest growing companies. Since these funds are more risky providing above average
earnings, investors pay a premium for the same. These funds have grown to become
extensively popular in India. All the leading fund houses offer several schemes under the
growth funds today.So it is interesting to learn the growth phase of these funds over this
period to till date.
1.5 OBJECTIVES OF THE STUDY
To evaluate the performance of Mutual Fund Scheme
To evaluate the trend movement of mutual fund earning
To identify expected future earnings of mutual fund scheme
To recommend the best sectoral mutual fund to the investors
9. 9
CHAPTER II
RESEARCH DEGIG AND METHODOLOGY
2.1 Research Design
A research design is the arrangement of conditions for collection and analysis of data in a
manner that aims to combine relevance to the research purpose with economy in procedure.
In this study, analytical study has been used.
2.2 Scope of the Study
It helps in measuring the amount of returns the fund yield.The study helps to identify funds
which gives that high return and which fund gives that low return. The study aims to project
the return in the forthcoming period. It shows the trend projection over the period
2.3 Review of Literature
Prof. Banerjee, Ashok 1
used Return Based Style Analysis (RBSA) to evaluate equity mutual
funds in India using quadratic optimization of an asset class factor model proposed by William Sharpe
and analysis of the relative performance of the funds with respect to their style benchmarks. Their
study found that the mutual funds generated positive monthly returns on the average, during the study
period of January 2000 through June 2005. The ELSS funds lagged the Growth funds or all funds
taken together, with respect to returns generated. The mean returns of the growth funds or all funds
were not only positive but also significant. The ELSS funds also demonstrated marginally higher
volatility (standard deviation) than the Growth funds.
Panwar, Sharad and Dr. Madhumathi2
identified differences in characteristics of public-sector
sponsored & private-sector sponsored mutual funds find the extent of diversification in the portfolio
of securities of public-sector sponsored and private-sector sponsored mutual funds and compare the
performance of public-sector sponsored and private-sector sponsored mutual funds using traditional
investment measures. They primarily use Jensen‟s alpha, Sharpe information ratio, excess standard
deviation adjusted return (eSDAR) and find out that portfolio risk characteristics measured through
private-sector Indian sponsored mutual funds seems to have outperformed both Public- sector
1
Prof. Banerjee, Ashok et. Al (2007),”Performance Evaluation of Indian Mutual Funds vis-à-vis their style
benchmarks”, www.ssrn.com, paper no.962827 and PP.1-18
2
Panwar,Sharad and Dr. Madhumathi (2006), “Characteristics and performance evaluation of selected mutual
funds in India”, www.ssrn.com, paper no.876402 and PP. 1-19
10. 10
sponsored and Private-sector foreign sponsored mutual funds and the general linear model of analysis
of covariance establishes differences in performance among the three classes of mutual funds in terms
of portfolio diversification.
Dr.Rao.D.N3
analyzed the performance of selected open-ended equity mutual fund using
Sharpe Ratio, Hypothesis testing and return based on yield. The most important finding of the study
had been that only four Growth plans and one Dividend plan (5 out of the 42 plans studied) could
generate higher returns than that of the market which is contrary to the general opinion prevailing in
the Indian mutual fund market. Even the Sharpe ratios of Growth plans and the corresponding
Dividend plans stand testimony to the relatively better performance of Growth plans. The statistical
tests in terms of F-test and t-Test further corroborate the significant performance differences between
the Growth plans and Dividend plans.
Wolasmal, Hewad4
looked at some measures of composite performance that combine risk
and return levels into a single value using Treynor‟s ratio, Sharpe‟s ratio, Jenson‟s measure. The study
analyzed the performance of 80 mutual funds and based on the analysis of these 80 funds, it was
found that none of the mutual funds were fully diversified. This implied there is still some degree of
unsystematic risk that one cannot get rid of through diversification. This also led to another
conclusion that none of those funds would land on Markowitz‟s efficient portfolio curve.
Dr.Rao.D.N had one more study5
that talked about a 4-step model for selecting the right
equity fund and illustrated the same in the context of equity mutual funds in Saudi Arabia. The study
revealed that most of the funds invested in Arab stocks had been in existence for less than a year and
the volatility of the GCC stock markets contributed to the relatively poor performance of these funds
and the turnaround of these funds could take place only with the rallying of GCC and other Arab
markets. Out of the six categories of equity mutual funds in Saudi Arabia discussed above, Funds
invested in Asian and European stocks were more consistent in their performance and yielded
relatively higher returns than other categories, though funds invested in Saudi stocks yielded higher 3-
year returns. Given the future outlook of Asian economies, particularly China and India and the newly
emerging economies such as Brazil and Russia, funds invested in the stocks of these countries are
likely to continue their current performance in near future.
3
Rao,D.N (2006), “Investment styles and Performance of Equity Mutual Funds in India”, www.ssrn.com, paper
no. 922595 and PP. 1-30
4
Wolasmal,Hewad, “Performance evaluation of mutual funds”, published by Econ WPA, paper no. 0509023 and
PP. 1-20
5
Rao,D.N. (2006), “4 Step model to evaluate performance of Mutual Funds in Saudi Arabia” www.ssrn.com,
paper no.946937 and PP. 1-16
11. 11
Agrawal, Deepak 6
, analyzed the Indian Mutual Fund Industry pricing mechanism
with empirical studies on its valuation. It also analyzed data at both the fund-manager and
fund-investor levels. It stated that mispricing of the Mutual funds could be evaluated by
comparing the return on market and return on stock. During the pricing period, if the return
on stock is negative, then it indicates overpricing and if are positive indicates under pricing.
Prof.S.Vanitha8, carried outthe performance evaluation of Indian Mutual Funds in a bear
market through relative performance index, risk-return analysis and other measures. The data used
were monthly closing NAVs, and the study period was from April 01st, 2006 to January 31st, 2010.
The S&P CNX Nifty Return was considered as the Market Returns. The highly traded Equity Growth
2.4 Sources of Data
The data that has been used in this research is the secondary data. The secondary data
is the data that are used already. The data of category average return has acquired from the
Karvy monthly newsletter.
2.5 Limitation of the Study
The time consumption of the study will be very effective to compare debt and equity
funds of the selected companies
Initially all mutual fund schemes were directly linked to stock market. But now
numerous schemes which are independent of stock market (debt &
money market funds) are introduced and such schemes‟ returns need not have co-
relation with S&P CNX nifty, and the nifty is not adjusted for dividends.
The past data is used, the past data cannot be the indicator of the future.
Numerical data for short period of time are projecting forthcoming shorter period
6
Agrawal,Deepak (2007), “Measuring Performance of Indian Mutual funds”, www.ssrn.com, paper no.1311761
and PP. 1-17
8 Prof S.Vanitha Assistant Professor, Department of Commerce and Financial Studies, Bharathidasan
University, Trichirappalli-620 024, Tamil Nadu, India.
E.Mail -commvani@yahoo.com.
12. 12
CHAPTER-III
ANALYSIS AND INTERPRETATION
In the Analysis and Interpretation, we used to analyze the trend movement of mutual fund
with the help of “Method of Least Square”.
METHOD OF LEAST SQUARE:
MEANING
By the method of least square, a straight line trend can be fitted, to the given time
series of data. It is a mathematical, as well as, an analytical method. With its help, economic
and business time series data can be fitted and this helps in forecasting and predicting.The
straight line trend or the first degree parabola is represented by the mathematical equation.
y=a+bx
y=required trend value
x=unit of time
a,b=constant or unknowns
The values of unknowns or constants can be calculated by the following two normal
equations.
1) ∑Y=na+b∑ X
2) ∑ X Y=a∑X+b
PURPOSE
The method of least square is used to find the trend value of mutual fund to the given
time series of data. This tool is used in predicting the movement of mutual fund.
13. 13
TABLE NO 3.1
ANALYSIS OF THE TREND IN THE DIVERSIFIED
LARGE-CAP SCHEME
Source of the Data: Karvy Monthly News Letter feb 2013
n=5;
The above table 3.1.shows the trend projection of large capital MF scheme. It denotes
the positive trend for the year 2008-12.
It is concluded that in the year 2014, the expected value of large capital is Rs.16.72
per unit.
TREND PROJECTION:
YEAR 2008 2009 2010 2011 2012 2013 2014
AVERAGE
RETURN(Y)
3.32 7.51 18 15.4 7.38 - -
TREND
RETURN(Ye)
7.12 8.72 10.32 11.92 13.52 15.12 16.72
YEAR
AVERAGE
RETURN(Y)
YEAR-2010
(X)
XY
TREND
RETURN(Ye)
2008 3.32 -2 -6.64 4 7.12
2009 7.51 -1 -7.51 1 8.72
2010 18 0 0 0 10.32
2011 15.4 1 15.4 1 11.92
2012 7.38 2 14.76 4 13.52
∑Y=51.61 ∑ X =0
∑ X Y
=16.01
=10
14. 14
CHART NO 3.1
CHART SHOWING THE TREND PROJECTION OF DIVERSIFIED LARGE-
CAP SCHEME
7.12
8.72
10.32
11.92
13.52
15.12
16.72
0
2
4
6
8
10
12
14
16
18
20
YEAR 2008 2009 2010 2011 2012 2013
EARNING
Year
TREND RETURN(Ye) AVERAGE RETURN(Y)
15. 15
TABLE NO 3.2
ANALYSIS OF THE TREND IN THE DIVERSIFIED
MID-CAP SCHEME
Source of the Data: Karvy Monthly News Letter feb 2013
n=5;
The above table shows trend projection of Mid-cap MF scheme. The table denotes the
positive trend for the year 2008-12.
It is concluded that in the year 2014, the expected value of Mid-cap scheme is
Rs.27.16 per unit.
TREND PROJECTION:
YEAR 2008 2009 2010 2011 2012 2013 2014
AVERAGE
RETURN(Y)
3.35 9.7 27.01 18.54 6.83 - -
TREND
RETURN(Ye)
6.04 9.56 13.08 16.6 20.12 23.64 27.16
YEAR
AVERAGE
RETURN(Y)
YEAR-2010
(X)
XY TREND(Ye)
2008 3.35 −2 -6.7 4 6.04
2009 9.7 -1 9.7 1 9.56
2010 27.01 0 0 0 13.08
2011 18.54 1 18.54 1 16.6
2012 6.83 2 13.66 4 20.12
∑Y=65.43 ∑ X =0 ∑ X Y =35.2 =10
16. 16
CHART NO 3.2
CHART SHOWING THE TREND PROJECTION OF DIVERSIFIED MID-
CAP SCHEME
6.04
9.56
13.08
16.6
20.12
23.64
27.16
0
5
10
15
20
25
30
YEAR 2008 2009 2010 2011 2012 2013
EARNING
Year
TREND RETURN(Ye) AVERAGE RETURN(Y)
17. 17
TABLE:3.3
ANALYSIS OF THE TREND IN THE DIVERSIFIED
MULTI-CAP SCHEME
Source of the Data: Karvy Monthly News Letter feb 2013
n=5;
The above table shows trend projection of multi capital MF scheme. The table denotes
the positive trend for the year 2008-12.
It is concluded that in the year 2014, the expected value of multi- capital scheme is
Rs.15.97 per unit.
TREND PROJECTION:
YEAR 2008 2009 2010 2011 2012 2013 2014
AVERAGE
RETURN(Y)
3.03 7.08 17.5 14.89 6.78 - -
TREND
RETURN(Ye)
6.79 8.32 9.85 11.38 12.91 14.44 15.97
YEAR
AVERAGE
RETURN(Y)
YEAR-2010
(X)
XY TREND(Ye)
2008 3.03 -2 -6.06 4 6.79
2009 7.08 -1 -7.08 1 8.32
2010 17.5 0 0 0 9.85
2011 14.89 1 14.89 1 11.38
2012 6.78 2 13.56 4 12.91
∑Y=49.28 ∑ X =0
∑ X Y
=15.31
=10
18. 18
CHART NO: 3.3
CHART SHOWING THE TREND PROJECTION OF DIVERSIFIED MULTI-
CAP SCHEME
6.79
8.32
9.85
11.38
12.91
14.44
15.97
0
2
4
6
8
10
12
14
16
18
20
YEAR 2008 2009 2010 2011 2012 2013
EARNING
Year
TREND RETURN(Ye) AVERAGE RETURN(Y)
19. 19
TABLE:3.4
ANALYSIS OF THE TREND IN THE DIVERSIFIED
SMALL-CAP SCHEME
Source of the Data: Karvy Monthly News Letter feb 2013
n=5;
The above table shows trend projection of small capital MF scheme. The table
denotes the positive trend for the year 2008-12.
It is concluded that in the year 2014, the expected value of small capital scheme is
Rs.13.86 per unit.
TREND PROJECTION:
YEAR 2008 2009 2010 2011 2012 2013 2014
AVERAGE
RETURN(Y)
-1.57 3.47 19.19 14.82 1.78 - -
TREND
RETURN(Ye)
4.38 5.96 7.54 9.12 10.7 12.28 13.86
YEAR
AVERAGE
RETURN(Y)
YEAR-2010
(X)
XY TREND(Ye)
2008 -1.57 -2 3.14 4 4.38
2009 3.47 -1 -3.47 1 5.96
2010 19.19 0 0 0 7.54
2011 14.82 1 14.82 1 9.12
2012 1.78 2 3.56 4 10.7
∑Y=37.69 ∑ X =0 ∑ X Y=18.05 =10
20. 20
CHART NO: 3.4
CHART SHOWING THE TREND PROJECTION OF DIVERSIFIED SMALL-
CAP SCHEME
4.38
5.96
7.54
9.12
10.7
12.28
13.86
-5
0
5
10
15
20
25
YEAR 2008 2009 2010 2011 2012 2013
EARNING
Year
TREND RETURN(Ye) AVERAGE RETURN(Y)
21. 21
TABLE:3.5
ANALYSIS OF THE TREND IN THE SECTOR FUNDS
BANKING & FINANCIAL SERVICES
Source of the Data: Karvy Monthly News Letter feb 2013
n=5;
The above table shows trend projection of banking & financialsector specific MF
scheme. The table denotes the positive trend for the year 2008-12.
It is concluded that in the year 2014, the expected value of banking & financial sector
specific scheme is Rs.21.93 per unit.
TREND PROJECTION:
YEAR 2008 2009 2010 2011 2012 2013 2014
AVERAGE
RETURN(Y)
13.93 15.62 31.27 24.21 12.63 - -
TREND
RETURN(Ye)
18.33 18.93 19.53 20.13 20.73 21.33 21.93
YEAR AVERAGE
RETURN(Y)
YEAR-2010
(X)
XY TREND(Ye)
2008 13.93 -2 -27.86 4 18.33
2009 15.62 -1 -15.62 1 18.93
2010 31.27 0 0 0 19.53
2011 24.21 1 24.21 1 20.13
2012 12.63 2 25.26 4 20.73
∑Y=97.66 ∑ X =0 ∑ X Y =5.99 =10
22. 22
CHART NO: 3.5
CHART SHOWING THE TREND PROJECTION OF SECTOR FUNDS
BANKING & FINANCIAL SERVICES
18.33 18.93 19.53 20.13 20.73 21.33 21.93
0
5
10
15
20
25
30
35
YEAR 2008 2009 2010 2011 2012 2013
EARNING
Year
TREND RETURN(Ye) AVERAGE RETURN(Y)
23. 23
TABLE:3.6
ANALYSIS OF THE TREND IN THE SECTOR FUNDS
ENERGY&POWER
Source of the Data: Karvy Monthly News Letter feb 2013
n=5;
The above table shows trend projection of sector fund-Energy & power MF scheme.
The table denotes the positive trend for the year 2008-12.
It is concluded that in the year 2014, the expected value sector fund-Energy &
powerscheme isRs. 10.94 per unit.
TREND PROJECTION:
YEAR 2008 2009 2010 2011 2012 2013 2014
AVERAGE
RETURN(Y)
-4.09 -8.08 1.14 6.25 1.69 - -
TREND
RETURN(Ye)
-4.54 -1.96 0.62 3.2 5.78 8.36 10.94
YEAR AVERAGE
RETURN(Y)
YEAR-2010
(X)
XY TREND(Ye)
2008 -4.09 -2 8.18 4 -4.54
2009 -8.08 -1 8.08 1 -1.96
2010 1.14 0 0 0 0.62
2011 6.25 1 6.25 1 3.2
2012 1.69 2 3.38 4 5.78
∑Y=-3.09 ∑ X =0 ∑ X Y
=25.89
=10
24. 24
CHART NO: 3.6
CHART SHOWING THE TREND PROJECTION OF SECTOR FUNDS
ENERGY&POWER
-4.54
-1.96
0.62
3.2
5.78
8.36
10.94
-10
-5
0
5
10
15
YEAR 2008 2009 2010 2011 2012 2013
EARNING
Year
TREND RETURN(Ye) AVERAGE RETURN(Y)
25. 25
TABLE:3.7
ANALYSIS OF THE TREND IN THE SECTOR FUNDS
FMCG
Source of the Data: Karvy Monthly News Letterfeb 2013
n=5;
The above table shows trend projection of sector funds-FMCG MF scheme. The table
denotes the negative trend for the year 2008-12.
It is concluded that in the year 2014, the expected value sector funds-FMCG scheme
is Rs.20.23 per unit.
TREND PROJECTION:
YEAR 2008 2009 2010 2011 2012 2013 2014
AVERAGE
RETURN(Y)
16.17 28.15 39.4 13.66 3.78 - -
TREND
RETURN(Ye)
28.07 24.15 20.23 16.31 12.39 8.47 4.55
YEAR AVERAGE
RETURN(Y)
YEAR-2010
(X)
XY TREND(Ye)
2008 16.17 -2 -32.34 4 28.07
2009 28.15 -1 -28.15 1 24.15
2010 39.4 0 0 0 20.23
2011 13.66 1 13.66 1 16.31
2012 3.78 2 7.56 4 12.39
∑Y=101.16 ∑ X =0 ∑ X Y =
-39.27
=10
26. 26
CHART NO:3.7
CHART SHOWING THE TREND PROJECTION OF SECTOR FUNDS
FMCG
28.07
24.15
20.23
16.31
12.39
8.47
4.55
0
5
10
15
20
25
30
35
40
45
YEAR 2008 2009 2010 2011 2012 2013
EARNING
Year
TREND RETURN(Ye) AVERAGE RETURN(Y)
27. 27
TABLE:3.8
ANALYSIS OF THE TREND IN THE SECTOR FUNDS
INFRASTRUCTURE
Source of Data: Kary Monthly News Letter Feb 2013
n=5;
The above table shows trend projection of infrastructure sector MF scheme. The table
denotes the positive trend for the year 2008-12.
It is concluded that in the year 2014, the expected value of infrastructure sector MF
scheme is Rs. 12.93per unit.
TREND PROJECTION:
YEAR 2008 2009 2010 2011 2012 2013 2014
AVERAGE
RETURN(Y)
-5.11 -2.68 6.44 8.88 2.73 - -
TREND
RETURN(Ye)
-3.39 -0.67 2.05 4.77 7.49 10.21 12.93
YEAR AVERAGE
RETURN(Y)
YEAR-2010
(X)
XY TREND(Ye)
2008 -5.11 -2 10.22 4 -3.39
2009 -2.68 -1 2.68 1 -0.67
2010 6.44 0 0 0 2.05
2011 8.88 1 8.88 1 4.77
2012 2.73 2 5.46 4 7.49
∑Y=10.26 ∑ X =0 ∑ X Y
=27.24
=10
28. 28
CHART NO:3.8
CHART SHOWING THE TREND PROJECTION OF SECTOR FUNDS
INFRASTRUCTURE
-3.39
-0.67
2.05
4.77
7.49
10.21
12.93
-8
-6
-4
-2
0
2
4
6
8
10
12
14
YEAR 2008 2009 2010 2011 2012 2013
EARNING
Year
TREND RETURN(Ye) AVERAGE RETURN(Y)
29. 29
TABLE:3.9
ANALYSIS OF THE TREND IN THE SPECIALITY
CONTRA
Source of the Data: Karvy Monthly News Letter feb 2013
n=5;
The above table shows trend projection of specialty-contra MF scheme. The table
denotes the positive trend for the year 2008-12.
It is concluded that in the year 2014, the expected value of specialty-contra MF
scheme isRs. 16.63 per unit.
TREND PROJECTION:
YEAR 2008 2009 2010 2011 2012 2013 2014
AVERAGE
RETURN(Y)
5.33 5.95 18.18 16.76 7.33 -
TREND
RETURN(Ye)
7.75 9.23 10.71 12.19 13.67 15.14 16.63
YEAR
AVERAGE
RETURN(Y)
YEAR-2010
(X)
XY TREND(Ye)
2008 5.33 -2 -10.66 4 7.75
2009 5.95 -1 -5.95 1 9.23
2010 18.18 0 0 0 10.71
2011 16.76 1 16.76 1 12.19
2012 7.33 2 14.66 4 13.67
∑Y=53.55 ∑ X =0
∑ X Y
=14.81
=10
30. 30
CHART NO:3. 9
CHART SHOWING THE TREND PROJECTION OF SPECIALITY
CONTRA
7.75
9.23
10.71
12.19
13.67
15.14
16.63
0
2
4
6
8
10
12
14
16
18
20
YEAR 2008 2009 2010 2011 2012 2013
EARNING
Year
TREND RETURN(Ye) AVERAGE RETURN(Y)
31. 31
TABLE:3.10
ANALYSIS OF THE TREND IN THE SPECIALITY
GLOBAL SCHEME
Source of the Data: Karvy Monthly News Letter feb 2013
n=5;
The above table shows trend projection of specialty-global MF scheme. The table
denotes the positive trend for the year 2008-12.
It is concluded that in the year 2014, the expected value of specialty-global MF
scheme isRs. 5.47 per unit.
TREND PROJECTION:
YEAR 2008 2009 2010 2011 2012 2013 2014
AVERAGE
RETURN(Y)
3.41 5.47 8.71 6.13 3.22 - -
TREND
RETURN(Ye)
5.334 5.362 5.39 5.41 5.43 5.45 5.47
YEAR
AVERAGE
RETURN(Y)
YEAR-2010
(X)
XY TREND(Ye)
2008 3.41 -2 -6.82 4 5.334
2009 5.47 -1 -5.47 1 5.362
2010 8.71 0 0 0 5.39
2011 6.13 1 6.13 1 5.41
2012 3.22 2 6.44 4 5.43
∑Y=26.94 ∑ X =0 ∑ X Y =0.28 =10
32. 32
CHART NO: 3.10
CHART SHOWING THE TREND PROJECTION OF SPECIALITY
GLOBAL SCHEME
5.334 5.362 5.39 5.41 5.43 5.45 5.47
0
1
2
3
4
5
6
7
8
9
10
YEAR 2008 2009 2010 2011 2012 2013
EARNING
Year
TREND RETURN(Ye) AVERAGE RETURN(Y)
33. 33
TABLE:3.11
ANALYSIS OF THE TREND IN THE SPECIALITY
INDEX-SENSEX SCHEME
Source of the Data: Karvy Monthly News Letter feb 2013
n=5;
The above table shows trend projection of specialty-Index Sensex MF scheme. The
table denotes the positive trend for the year 2008-12.
It is concluded that in the year 2014, the expected value of specialty-Index Sensex MF
scheme is Rs.16.56 per unit.
TREND PROJECTION:
YEAR 2008 2009 2010 2011 2012 2013 2014
AVERAGE
RETURN(Y)
2.46 7.24 16.46 15.1 7.16 - -
TREND
RETURN(Ye)
6.24 7.96 9.68 11.4 13.12 14.84 16.56
YEAR
AVERAGE
RETURN(Y)
YEAR-2010
(X)
XY TREND(Ye)
2008 2.46 -2 -4.92 4 6.24
2009 7.24 -1 -7.24 1 7.96
2010 16.46 0 0 0 9.68
2011 15.1 1 15.1 1 11.4
2012 7.16 2 14.32 4 13.12
∑Y=48.42 ∑ X =0
∑ X Y
=17.26
=10
34. 34
CHART NO: 3.11
CHART SHOWING THE TREND PROJECTION OF SPECIALITY
INDEX-SENSEX SCHEME
6.24
7.96
9.68
11.4
13.12
14.84
16.56
0
2
4
6
8
10
12
14
16
18
YEAR 2008 2009 2010 2011 2012 2013
EARNING
Year
TREND RETURN(Ye) AVERAGE RETURN(Y)
35. 35
TABLE:3.12
ANALYSIS OF THE TREND IN THE EQUITY ETFs
Source of the Data: Karvy Monthly News Letter feb 2013
n=5;
The above table shows trend projection of Equity-ETF MF scheme. The table denotes
the positive trend for the year 2008-12.
It is concluded that in the year 2014, the expected value of Equity-ETF scheme is
Rs.17.23 per unit.
TREND PROJECTION:
YEAR 2008 2009 2010 2011 2012 2013 2014
AVERAGE
RETURN(Y)
5.10 8.58 18.19 16.3 8.81 - -
TREND
RETURN(Ye)
8.37 9.88 11.39 12.9 14.41 15.82 17.23
YEAR
AVERAGE
RETURN(Y)
YEAR-2010
(X)
XY TREND(Ye)
2008 5.10 -2 -10.2 4 8.37
2009 8.58 -1 -8.58 1 9.88
2010 18.19 0 0 0 11.39
2011 16.3 1 16.3 1 12.9
2012 8.81 2 17.62 4 14.41
∑Y=56.98 ∑ X =0
∑ X Y
=15.14
=10
36. 36
CHART NO:3.12
CHART SHOWING THE TREND PROJECTION OF EQUITY ETFs
8.37
9.88
11.39
12.9
14.41
15.82
17.23
0
2
4
6
8
10
12
14
16
18
20
YEAR 2008 2009 2010 2011 2012 2013
EARNING
Year
TREND RETURN(Ye) AVERAGE RETURN(Y)
37. 37
TABLE:3.13
ANALYSIS OF THE TREND IN THE ARBITRAGE FUNDS
DEBT-ORIENTED
Source of the Data: Karvy Monthly News Letter feb 2013
n=5;
The above table shows trend projection of arbitrage funds-Debt oriented MF scheme.
The table denotes the positive trend for the year 2008-12.
It is concluded that in the year 2014, the expected value of arbitrage funds-Debt
oriented MF scheme is Rs.11.22 per unit.
TREND PROJECTION:
YEAR 2008 2009 2010 2011 2012 2013 2014
AVERAGE
RETURN(Y)
7.16 8.14 9.83 5.05 2.93 - -
TREND
RETURN(Ye)
4.32 5.47 6.62 7.77 8.92 10.07 11.22
YEAR AVERAGE
RETURN(Y)
YEAR-2010
(X)
XY TREND(Ye)
2008 7.16 -2 -14.32 4 4.32
2009 8.14 -1 -8.14 1 5.47
2010 9.83 0 0 0 6.62
2011 5.05 1 5.05 1 7.77
2012 2.93 2 5.86 4 8.92
∑Y=33.11 ∑ X =0 ∑ X Y =-
11.55
=10
38. 38
CHART NO: 3.13
CHART SHOWING THE TREND PROJECTION OF ARBITRAGE FUNDS
DEBT-ORIENTED
4.32
5.47
6.62
7.77
8.92
10.07
11.22
0
2
4
6
8
10
12
YEAR 2008 2009 2010 2011 2012 2013
EARNING
Year
TREND RETURN(Ye) AVERAGE RETURN(Y)
39. 39
TABLE:3.14
ANALYSIS OF THE TREND IN THE ARBITRAGE FUNDS
EQUITY ORIENTED
Source of the Data: Karvy Monthly News Letter feb 2013
n=5;
The above table shows trend projection of arbitrage funds-equity oriented MF
scheme. The table denotes the positive trend for the year 2008-12.
It is concluded that in the year 2014, the expected value of arbitrage funds-equity
oriented MF scheme is Rs.8.23 per unit.
TREND PROJECTION:
YEAR 2008 2009 2010 2011 2012 2013 2014
AVERAGE
RETURN(Y)
7.18 8.11 10.87 5.09 2.54 - -
TREND
RETURN(Ye)
5.98 6.37 6.79 7.15 7.51 7.87 8.23
YEAR
AVERAGE
RETURN(Y)
YEAR-2010
(X)
XY TREND(Ye)
2008 7.18 -2 -14.36 4 5.98
2009 8.11 -1 8.11 1 6.37
2010 10.87 0 0 0 6.79
2011 5.09 1 5.09 1 7.15
2012 2.54 2 5.08 4 7.51
∑Y=33.79 ∑ X =0 ∑ X Y =3.92 =10
40. 40
CHART NO: 3.14
CHART SHOWING THE TREND PROJECTION OF ARBITRAGE FUNDS
EQUITY ORIENTED
5.98
6.37
6.79
7.15
7.51
7.87
8.23
0
2
4
6
8
10
12
YEAR 2008 2009 2010 2011 2012 2013
EARNING
Year
TREND RETURN(Ye) AVERAGE RETURN(Y)
41. 41
TABLE:3.15
ANALYSIS OF THE TREND IN THE BALANCED FUNDS
DEBT-ORIENTED
Source of the Data: Karvy Monthly News Letter feb 2013
n=5;
The above table shows trend projection of balanced funds-Debt oriented MF scheme.
The table denotes the positive trend for the year 2008-12.
It is concluded that in the year 2014, the expected value of balanced funds-Debt
orientedMF scheme is Rs.8.59 per unit.
TREND PROJECTION:
YEAR 2008 2009 2010 2011 2012 2013 2014
AVERAGE
RETURN(Y)
2.49 5.77 11.45 8.26 4 - -
TREND
RETURN(Ye)
5.29 5.84 6.39 6.94 7.49 8.04 8.59
YEAR AVERAGE
RETURN(Y)
YEAR-2010
(X)
XY TREND(Ye)
2008 2.49 -2 -4.98 4 5.29
2009 5.77 -1 -5.77 1 5.84
2010 11.45 0 0 0 6.39
2011 8.26 1 8.26 1 6.94
2012 4 2 8 4 7.49
∑Y=31.97 ∑ X =0 ∑ X Y =5.51 =10
42. 42
CHART NO: 3.15
CHART SHOWING THE TREND PROJECTION OF BALANCED FUNDS
DEBT-ORIENTED
5.29
5.84
6.39
6.94
7.49
8.04
8.59
0
2
4
6
8
10
12
14
YEAR 2008 2009 2010 2011 2012 2013
EARNING
Year
TREND RETURN(Ye) AVERAGE RETURN(Y)
43. 43
TABLE:3.16
ANALYSIS OF THE TREND IN THE BALANCED FUNDS
EQUITY ORIENTED
Source of the Data: Karvy Monthly News Letter feb 2013
n=5;
The above table shows trend projection of balanced funds-equity oriented MF
scheme. The table denotes the positive trend for the year 2008-12.
It is concluded that in the year 2014, the expected value balanced funds-equity
oriented MF scheme is Rs.6.88 per unit.
TREND PROJECTION:
YEAR 2008 2009 2010 2011 2012 2013 2014
AVERAGE
RETURN(Y)
5.77 8.52 17 12.71 6.05 - -
TREND
RETURN(Ye)
4.06 4.53 5 5.47 5.94 6.41 6.88
YEAR
AVERAGE
RETURN(Y)
YEAR-2010
(X)
XY TREND(Ye)
2008 5.77 -2 -11.54 4 4.06
2009 8.52 -1 -8.52 1 4.53
2010 17 0 0 0 5
2011 12.71 1 12.71 1 5.47
2012 6.05 2 12.1 4 5.94
∑Y=50.05 ∑ X =0 ∑ X Y =4.75 =10
44. 44
CHART NO:3.16
CHART SHOWING THE TREND PROJECTION OF BALANCED FUNDS
EQUITY ORIENTED
4.06 4.53 5 5.47 5.94 6.41 6.88
0
2
4
6
8
10
12
14
16
18
YEAR 2008 2009 2010 2011 2012 2013
EARNING
Year
TREND RETURN(Ye) AVERAGE RETURN(Y)
45. 45
TABLE:3.17
ANALYSIS OF THE TREND IN THE FUND-OF-FUNDS
HYBRID ORIENTED
Source of the Data: Karvy Monthly News Letter feb 2013
n=5;
The above table shows trend projection of fund of funds-Hybrid oriented MF scheme.
The table denotes the positive trend for the year 2008-12.
It is concluded that in the year 2014, the expected value of fund of funds-Hybrid
oriented MF scheme is Rs.10.26 per unit.
TREND PROJECTION:
YEAR 2008 2009 2010 2011 2012 2013 2014
AVERAGE
RETURN(Y)
7.8 6.87 12.3 8.48 4.07 - -
TREND
RETURN(Ye)
6.72 7.31 7.9 8.49 9.08 9.67 10.26
YEAR
AVERAGE
RETURN(Y)
YEAR-2010
(X)
XY TREND(Ye)
2008 7.8 -2 -15.6 4 6.72
2009 6.87 -1 -6.87 1 7.31
2010 12.3 0 0 0 7.9
2011 8.48 1 8.48 1 8.49
2012 4.07 2 8.14 4 9.08
∑Y=39.52 ∑ X =0 ∑ X Y =-5.85 =10
46. 46
CHART NO:3. 17
CHART SHOWING THE TREND PROJECTION OF FUND-OF-FUNDS
HYBRID ORIENTED SCHEME
6.72
7.31
7.9
8.49
9.08
9.67
10.26
0
2
4
6
8
10
12
14
YEAR 2008 2009 2010 2011 2012 2013
EARNING
Year
TREND RETURN(Ye) AVERAGE RETURN(Y)
47. 47
TABLE:3.18
ANALYSIS OF THE TREND IN THE FUND-OF-FUNDS
OVERSEAS
Source of the Data: Karvy Monthly News Letter feb 2013
n=5;
The above table shows trend projection of fund of funds-overseas MF scheme. The
table denotes the positive trend for the year 2008-12.
It is concluded that in the year 2014, the expected value of fund of funds-overseas
scheme is Rs.8.57 per unit.
TREND PROJECTION:
YEAR 2008 2009 2010 2011 2012 2013 2014
AVERAGE
RETURN(Y)
5.10 8.85 12.42 7.43 4.67 - -
TREND
RETURN(Ye)
7.25 7.47 7.69 7.91 8.13 8.35 8.57
CHART NO:3.18
YEAR
AVERAGE
RETURN(Y)
YEAR-2010
(X)
XY TREND(Ye)
2008 5.10 -2 -10.2 4 7.25
2009 8.85 -1 -8.85 1 7.47
2010 12.42 0 0 0 7.69
2011 7.43 1 7.43 1 7.91
2012 4.67 2 9.34 4 8.13
∑Y=38.47 ∑ X =0 ∑ X Y =-2.28 =10
48. 48
CHART SHOWING THE TREND PROJECTION OF FUND-OF-FUNDS
OVERSEAS
TABLE:3.19
7.25 7.47 7.69 7.91 8.13 8.35 8.57
0
2
4
6
8
10
12
14
YEAR 2008 2009 2010 2011 2012 2013
EARNING
Year
TREND RETURN(Ye) AVERAGE RETURN(Y)
49. 49
ANALYSIS OF THE TREND IN THE INCOME
LONG TERM
Source of the Data: Karvy Monthly News Letter feb 2013
n=5;
The above table shows trend projection of Income-long term MF scheme. The table
denotes the positive trend for the year 2008-12.
It is concluded that in the year 2014, the expected value Income-long term MF
scheme is Rs.11.26 per unit.
TREND PROJECTION:
YEAR 2008 2009 2010 2011 2012 2013 2014
AVERAGE
RETURN(Y)
7.38 7.92 10.36 5.64 3.01 - -
TREND
RETURN(Ye)
4.66 5.76 6.86 7.96 9.06 10.16 11.26
CHART NO: 3.19
YEAR AVERAGE
RETURN(Y)
YEAR-2010
(X)
XY TREND(Ye)
2008 7.38 -2 -14.76 4 4.66
2009 7.92 -1 -7.92 1 5.76
2010 10.36 0 0 0 6.86
2011 5.64 1 5.64 1 7.96
2012 3.01 2 6.02 4 9.06
∑Y=34.31 ∑ X =0 ∑ X Y =-
11.02
=10
50. 50
CHART SHOWING THE TREND PROJECTION OF INCOME
LONG TERM
TABLE:3.20
4.66
5.76
6.86
7.96
9.06
10.16
11.26
0
2
4
6
8
10
12
YEAR 2008 2009 2010 2011 2012 2013
EARNING
Year
TREND RETURN(Ye) AVERAGE RETURN(Y)
51. 51
ANALYSIS OF THE TREND IN THE INCOME
MEDIUM TERM
Source of the Data: Karvy Monthly News Letter feb 2013
n=5;
The above table shows trend projection of Income medium term MF scheme. The
table denotes the positive trend for the year 2008-12.
It is concluded that in the year 2014, the expected value of Income medium term MF
scheme is Rs.12.87 per unit.
TREND PROJECTION:
YEAR 2008 2009 2010 2011 2012 2013 2014
AVERAGE
RETURN(Y)
8.36 8.09 9.98 4.87 2.25 - -
TREND
RETURN(Ye)
3.63 5.17 6.71 8.25 9.79 11.33 12.87
CHART NO: 3.20
CHART SHOWING THE TREND PROJECTION OF INCOME
YEAR
AVERAGE
RETURN(Y)
YEAR-2010
(X)
XY TREND(Ye)
2008 8.36 -2 -16.72 4 3.63
2009 8.09 -1 -8.09 1 5.17
2010 9.98 0 0 0 6.71
2011 4.87 1 4.87 1 8.25
2012 2.25 2 4.5 4 9.79
∑Y=33.55 ∑ X =0
∑ X Y =-
15.44
=10
52. 52
MEDIUM TERM
TABLE:3.21
ANALYSIS OF THE TREND IN THE INCOME
3.63
5.17
6.71
8.25
9.79
11.33
12.87
0
2
4
6
8
10
12
14
YEAR 2008 2009 2010 2011 2012 2013
EARNING
Year
TREND RETURN(Ye) AVERAGE RETURN(Y)
53. 53
SHORT-TERM
Source of the Data: Karvy Monthly News Letter feb 2013
n=5;
The above table shows trend projection of income-short term MF scheme. The table
denotes the positive trend for the year 2008-12.
It is concluded that in the year 2014, the expected value of income-short term MF
scheme is Rs.12.64 per unit.
TREND PROJECTION:
YEAR 2008 2009 2010 2011 2012 2013 2014
AVERAGE
RETURN(Y)
8.25 7.98 9.64 4.68 2.28 - -
TREND
RETURN(Ye)
3.52 5.04 6.56 8.08 9.6 11.12 12.64
CHART NO: 21
CHART SHOWING THE TREND PROJECTION OF INCOME
SHORT-TERM
YEAR
AVERAGE
RETURN(Y)
YEAR-2010
(X)
XY TREND(Ye)
2008 8.25 -2 -16.5 4 3.52
2009 7.98 -1 -7.98 1 5.04
2010 9.64 0 0 0 6.56
2011 4.68 1 4.68 1 8.08
2012 2.28 2 4.56 4 9.6
∑Y=32.83 ∑ X =0
∑ X Y =-
15.24
=10
54. 54
TABLE:3.22
ANALYSIS OF THE TREND IN THE GILT
LONG TERM
3.52
5.04
6.56
8.08
9.6
11.12
12.64
0
2
4
6
8
10
12
14
YEAR 2008 2009 2010 2011 2012 2013
EARNING
Year
TREND RETURN(Ye) AVERAGE RETURN(Y)
55. 55
Source of the Data: Karvy Monthly News Letter feb 2013
n=5;
The above table shows trend projection of GILT long term MF scheme. The table
denotes the positive trend for the year 2008-12.
It is concluded that in the year 2014, the expected value of GILT long term MF
scheme is Rs.20.54 per unit.
TREND PROJECTION:
YEAR 2008 2009 2010 2011 2012 2013 2014
AVERAGE
RETURN(Y)
7.64 7.32 9.93 6.07 3.72 - -
TREND
RETURN(Ye)
5.13 7.7 10.27 12.84 15.4 17.97 20.54
CHART NO: 22
CHART SHOWING THE TREND PROJECTION OF GILT
YEAR
AVERAGE
RETURN(Y)
YEAR-2010
(X)
XY TREND(Ye)
2008 7.64 -2 -15.28 4 5.13
2009 7.32 -1 -7.32 1 7.7
2010 9.93 0 0 0 10.27
2011 6.07 1 6.07 1 12.84
2012 3.72 2 7.44 4 15.4
∑Y=34.68 ∑ X =0 ∑ X Y =-9.09 =10
56. 56
LONG TERM
TABLE:3.23
ANALYSIS OF THE TREND IN THE GILT
5.13
7.7
10.27
12.84
15.4
17.97
20.54
0
5
10
15
20
25
YEAR 2008 2009 2010 2011 2012 2013
EARNING
Year
TREND RETURN(Ye) AVERAGE RETURN(Y)
57. 57
MEDIUM TERM
Source of the Data: Karvy Monthly News Letter feb 2013
n=5;
The above table shows trend projection of GILT medium term MF scheme. The table
denotes the positive trend for the year 2008-12.
It is concluded that in the year 2014, the expected value of GILT medium term MF
scheme is Rs.12.87 per unit.
TREND PROJECTION:
YEAR 2008 2009 2010 2011 2012 2013 2014
AVERAGE
RETURN(Y)
8.36 8.09 9.98 4.87 2.25 - -
TREND
RETURN(Ye)
3.63 5.17 6.71 8.25 9.79 11.33 12.87
CHART NO:3. 23
CHART SHOWING THE TREND PROJECTION OF GILT
YEAR
AVERAGE
RETURN(Y)
YEAR-2010
(X)
XY TREND(Ye)
2008 8.36 -2 -16.72 4 3.63
2009 8.09 -1 -8.09 1 5.17
2010 9.98 0 0 0 6.71
2011 4.87 1 4.87 1 8.25
2012 2.25 2 4.5 4 9.79
∑Y=33.55 ∑ X =0
∑ X Y =-
15.44
=10
58. 58
MEDIUM TERM
TABLE:3.24
ANALYSIS OF THE TREND IN THE GILT
3.63
5.17
6.71
8.25
9.79
11.33
12.87
0
2
4
6
8
10
12
14
YEAR 2008 2009 2010 2011 2012 2013
EARNING
Year
TREND RETURN(Ye) AVERAGE RETURN(Y)
59. 59
SHORT-TERM
Source of the Data: Karvy Monthly News Letter feb 2013
n=5;
The above table shows trend projection of GILT-short term MF scheme. The table
denotes the positive trend for the year 2008-12.
It is concluded that in the year 2014, the expected value of GILT-short term MF
scheme is Rs.9.28 per unit.
TREND PROJECTION:
YEAR 2008 2009 2010 2011 2012 2013 2014
AVERAGE
RETURN(Y)
6.12 6.66 8.58 4.59 2.67 - -
TREND
RETURN(Ye)
3.94 4.83 5.72 6.61 7.5 8.39 9.28
CHART NO:3.24
CHART SHOWING THE TREND PROJECTION OF GILT
YEAR
AVERAGE
RETURN(Y)
YEAR-2010
(X)
XY TREND(Ye)
2008 6.12 -2 -12.24 4 3.94
2009 6.66 -1 -6.66 1 4.83
2010 8.58 0 0 0 5.72
2011 4.59 1 4.59 1 6.61
2012 2.67 2 5.38 4 7.5
∑Y=28.62 ∑ X =0 ∑ X Y =-8.93 =10
60. 60
SHORT-TERM
TABLE:3.25
ANALYSIS OF THE TREND IN THE FLOATING RATE
3.94
4.83
5.72
6.61
7.5
8.39
9.28
0
1
2
3
4
5
6
7
8
9
10
YEAR 2008 2009 2010 2011 2012 2013
EARNING
Year
TREND RETURN(Ye) AVERAGE RETURN(Y)
61. 61
LONG TERM
Source of the Data: Karvy Monthly News Letter feb 2013
n=5;
The above table shows trend projection of floating rate-long term MF scheme. The
table denotes the positive trend for the year 2008-12.
It is concluded that in the year 2014, the expected value of floating rate-long term MF
scheme is Rs.12.09 per unit.
TREND PROJECTION:
YEAR 2008 2009 2010 2011 2012 2013 2014
AVERAGE
RETURN(Y)
7.61 7.77 9.52 4.36 1.99 - -
TREND
RETURN(Ye)
3.33 4.79 6.25 7.71 9.17 10.63 12.09
CHART NO:3. 25
CHART SHOWING THE TREND PROJECTION OF FLOATING RATE
YEAR
AVERAGE
RETURN(Y)
YEAR-2010
(X)
XY TREND(Ye)
2008 7.61 -2 -15.22 4 3.33
2009 7.77 -1 -7.77 1 4.79
2010 9.52 0 0 0 6.25
2011 4.36 1 4.36 1 7.71
2012 1.99 2 3.98 4 9.17
∑Y=31.25 ∑ X =0
∑ X Y =-
14.65
=10
62. 62
LONG TERM
TABLE:3.26
ANALYSIS OF THE TREND IN THE FLOATING RATE
3.33
4.79
6.25
7.71
9.17
10.63
12.09
0
2
4
6
8
10
12
14
YEAR 2008 2009 2010 2011 2012 2013
EARNING
Year
TREND RETURN(Ye) AVERAGE RETURN(Y)
63. 63
SHORT TERM
Source of the Data: Karvy Monthly News Letter feb 2013
n=5;
The above table shows trend projection of floating rate-short term MF scheme. The
table denotes the positive trend for the year 2008-12.
It is concluded that in the year 2014, the expected value of floating rate-short term MF
scheme is Rs.12.23 per unit.
TREND PROJECTION:
YEAR 2008 2009 2010 2011 2012 2013 2014
AVERAGE
RETURN(Y)
7.75 8.09 9.44 4.47 2.22 - -
TREND
RETURN(Ye)
3.47 4.93 6.39 7.85 9.31 10.77 12.23
CHART NO: 3.26
CHART SHOWING THE TREND PROJECTION OF FLOATING RATE
YEAR
AVERAGE
RETURN(Y)
YEAR-2010
(X)
XY TREND(Ye)
2008 7.75 -2 -15.5 4 3.47
2009 8.09 -1 -8.09 1 4.93
2010 9.44 0 0 0 6.39
2011 4.47 1 4.47 1 7.85
2012 2.22 2 4.44 4 9.31
∑Y=31.97 ∑ X =0
∑ X Y =-
14.68
=10
64. 64
SHORT TERM
TABLE:3.27
ANALYSIS OF THE TREND IN THE LIQUID
3.47
4.93
6.39
7.85
9.31
10.77
12.23
0
2
4
6
8
10
12
14
YEAR 2008 2009 2010 2011 2012 2013
EARNING
Year
TREND RETURN(Ye) AVERAGE RETURN(Y)
65. 65
Source of the Data: Karvy Monthly News Letter feb 2013
n=5;
The above table shows trend projection of liquid MF scheme. The table denotes the
positive trend for the year 2008-12.
It is concluded that in the year 2014, the expected value of liquid scheme is Rs.11.24
per unit.
TREND PROJECTION:
YEAR 2008 2009 2010 2011 2012 2013 2014
AVERAGE
RETURN(Y)
6.98 7.5 8.89 4.07 1.99 - -
TREND
RETURN(Ye)
3.2 4.54 5.88 7.22 8.56 9.9 11.24
CHART NO:3.27
CHART SHOWING THE TREND PROJECTION OF LIQUID
YEAR
AVERAGE
RETURN(Y)
YEAR-2010
(X)
XY TREND(Ye)
2008 6.98 -2 -13.96 4 3.2
2009 7.5 -1 -7.5 1 4.54
2010 8.89 0 0 0 5.88
2011 4.07 1 4.07 1 7.22
2012 1.99 2 3.98 4 8.56
∑Y=29.43 ∑ X =0
∑ X Y =-
13.41
=10
67. 67
FINDINGS AND SUGESSTIONS
4.1 FINDINGS
1. The expected average value of large capital MF is Rs.16.72 per unit in the year 2014.
2. The expected average value of Mid-cap MF scheme is Rs.27.16 per unitin the year
2014.
3. The expected average value of multi- capital scheme is Rs.15.97 per unitin the year
2014.
4. The expected average value of small capital scheme is Rs.13.86 per unitin the year
2014.
5. The expected average value of banking and financial sector specific scheme is
Rs.21.93 in the year 2014.
6. The expected average value of sector fund-Energy and power scheme is Rs.10.94 per
unitin the year 2014.
7. The expected average value of sector funds-FMCG scheme is 4.55in the year 2014.
8. The expected average value of infrastructure sector MF scheme is Rs.12.93 per unitin
the year 2014.
9. The expected average value of specialty-contra MF scheme is Rs.16.63 per unitin the
year 2014.
10. The expected average value of specialty-globalMF scheme is Rs.5.47 per unitin the
year 2014.
11. The expected average value of specialty-Index Sensex MF scheme is 16.56in the year
2014.
12. The expected average value of Equity-ETFscheme is Rs.17.23 per unitin the year
2014.
13. The expected average value of arbitrage funds-Debt oriented MF scheme is Rs.11.22
per unitin the year 2014.
14. The expected average value of arbitrage funds-equity oriented MF scheme is Rs.8.23
per unitin the year 2014.
15. The expected average value of balanced funds-Debt orientedMF scheme is Rs.8.59
per unitin the year 2014.
16. The expected average value of balanced funds-equity oriented MF scheme is Rs.6.88
per unitin the year 2014.
17. The expected average value of fund of funds-Hybrid orientedMF scheme is Rs.10.26
per unitin the year 2014.
18. The expected average value of fund of funds-overseas scheme is Rs.8.57 per unitin
the year 2014.
68. 68
19. The expected average value of Income-long term MF scheme is Rs.11.26 per unitin
the year 2014.
20. The expected average value of Income medium term MF scheme is Rs.12.87 per
unitin the year 2014.
21. The expected average value of income-short term MF scheme is Rs.12.64 per unitin
the year 2014.
22. The expected average value of GILT long term MF scheme is Rs.20.54 per unitin the
year 2014.
23. The expected average value of GILT medium term MF scheme is Rs.12.87 per unitin
the year 2014.
24. The expected average value of GILT-short term MF scheme is Rs.9.28 per unitin the
year 2014.
25. The expected average value of floating rate-long term MF scheme is Rs.12.09 per
unitin the year 2014.
26. The expected average value of floating rate-short term MF scheme is Rs.12.23 per
unitin the year 2014.
27. The expected average value of liquid scheme is Rs.11.24 per unitin the year 2014.
4.2 SUGGESTION
From the findings, the facts realized are coming under below
1. Despite the sharp growth and fall in average return of Diversified-large cap scheme,
the trend return will gopositive after 2012.
2. There is tremendous growth in Diversified-Large cap scheme as between 2008-14.
But there is sharp fall in average return.
3. When fluctuation in average return exists, the trend return goes up in diversified
multi-cap scheme.
4. In the diversified small-cap scheme, the average return uprooted to positive. But the
trend return gradually improved. So the base of this scheme would be strong.
5. The banking sector does not render good return as it is pace lifted.
6. The energy and power shows the average return lower. The trend return is gradually
improved. This is riskier one.
7. Frequent changes in the FMCG sector show the risky trend. The trend return goes on
negative.
69. 69
8. The infrastructure goes from positive to negative. It is lucrative sector as government
gives more nods.
9. The certain ups and downs results in specialty contra. So there should be an eagle eye
on it.
10. In terms of global specialty schemes, the return does not change much. So it is
preferred for speculators.
11. As the Index-Sensex is sensitive for all the micro and macro-economic factors, the
trend goes on gradually.
12. The equity is well coped with above Index-Sensex scheme.
13. As average return headed towards the negative, investor need to take more steps on
this debt oriented scheme.
14. There is not much deviation in the trend return of arbitrage equity oriented.
15. The balanced debt oriented schemes are heading towards the negative.
16. The balanced funds equity oriented schemes are going towards the negative return and
also has minimum return. So it is not preferable.
17. The hybrid schemes seem to be risky. So there should be sharp out.
18. The overseas fund of funds is not lucrative as there is meager change.
19. There is good gradual return in the income long term scheme. So it is preferable for
risk free investment.
20. As the trend goes on good condition, average return is not looking profit.
21. The trend of the income short term is looking good as average return yields changes.
22. The GILT long term is not preferable as compared to other schemes.
23. There is spark return in the GILT medium term return.
24. As the average return does not go on the positive trend, the trend return goes.
25. There is sharp decline and gradual increase in the average return and trend return
respectively in the floating rate long term.
26. The gradual increase is projected in the trend return of floating rate short term.
27. The average return goes on to the negative. But there is an increase in the trend return.
So investor needs to take long term stand.
CHAPTER V
70. 70
5.1 CONCLUSION
A study on performance of sector wise mutual fund schemes in Indiais to assist the
investor to take decision on the investment of mutual fund.
The resultant data are arranged from the 2008-2012. But they are forecasting till 2014
on the category basis. As the industry is finance oriented, the reforms are needed. The
government needs to take relook on these reforms to revive the mutual fund.
Except FMCG sector, the entire sector shows the good trend projection in positive
trend. Compared to debt oriented scheme, the equity trend looks lucrative. But the sudden ups
and downs are there in the projection of equity related schemes.The government GILT funds
are profitable meagerly. The overseas funds are also same like this.
However the investor before taking on any investment should have very sharp
analysis in the micro and macro-economic factors. This is very true in the case of sectorial
mutual funds.