What is a Gantt Chart in Project Management? (Infographic)
•
22 gefällt mir•5,037 views

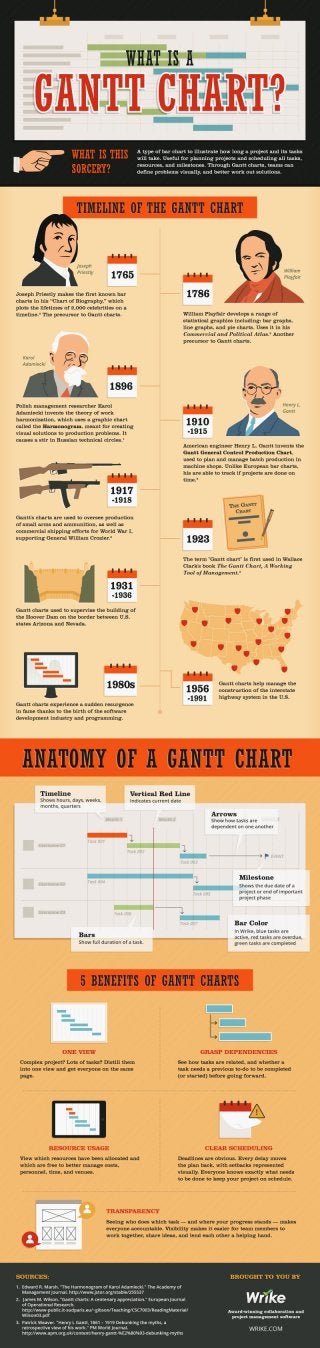
https://www.wrike.com/blog/what-is-a-gantt-chart-infographic/ - Gantt charts are a staple tool in project management software. They are able to visually convey what would take paragraphs of boring text. But who invented them? What makes them beneficial for project planning? And what are the useful parts of every Gantt chart? Here we’ve put together an infographic to explain what a Gantt chart for project management is, how it came to be, and why it’s an awesome management tool that isn’t going away anytime soon.