Willacy County Parks Survey Gauges Support for Outdoor Facility Improvements
1. Willacy County Parks and Recreation Community Survey
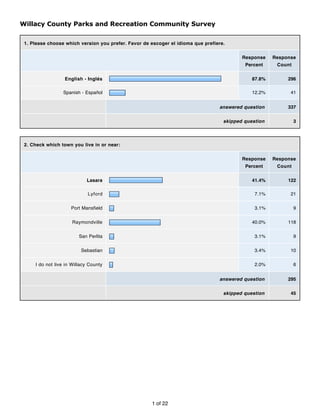
1. Please choose which version you prefer. Favor de escoger el idioma que prefiere.
Response Response
Percent Count
English - Inglés 87.8% 296
Spanish - Español 12.2% 41
answered question 337
skipped question 3
2. Check which town you live in or near:
Response Response
Percent Count
Lasara 41.4% 122
Lyford 7.1% 21
Port Mansfield 3.1% 9
Raymondville 40.0% 118
San Perlita 3.1% 9
Sebastian 3.4% 10
I do not live in Willacy County 2.0% 6
answered question 295
skipped question 45
1 of 22
2. 3. What age group are you in:
Response Response
Percent Count
Under 20 15.0% 42
21-35 33.6% 94
36-50 33.9% 95
51-65 12.5% 35
Over 65 5.0% 14
answered question 280
skipped question 60
4. What is your gender:
Response Response
Percent Count
Female 66.8% 189
Male 33.2% 94
answered question 283
skipped question 57
2 of 22
3. 5. How many children (19 and under) live in your home?
Response Response
Percent Count
0 19.5% 54
1 12.3% 34
2 21.3% 59
3 22.0% 61
4 15.5% 43
5 6.1% 17
6 1.8% 5
7 0.4% 1
8 1.1% 3
More than 8 0.0% 0
answered question 277
skipped question 63
6. Do you or does someone in your family participate in organized league sports (baseball, softball, volleyball,
etc.) outside of a school program?
Response Response
Percent Count
Yes 52.7% 149
No 47.3% 134
answered question 283
skipped question 57
3 of 22
4. 7. Should local governments develop or improve OUTDOOR Park and Recreaton Facilities in the County?
Response Response
Percent Count
Yes 98.3% 281
No 1.7% 5
answered question 286
skipped question 54
4 of 22
5. 8. Please check the top FIVE (5) OUTDOOR Park and Recreation Facilities from the list below that you would like
to see added in the County.
Response Response
Percent Count
Amphitheaters 5.4% 15
Baseball Fields 27.8% 77
Basketball Courts 20.2% 56
Bicycling Trails/Paths 26.4% 73
Birdwatching Areas 8.7% 24
BMX Bike Parks 6.5% 18
Camp Grounds 9.4% 26
Disc Golf (Frisbee) Courses 2.9% 8
Fishing Piers/Wading Areas 17.3% 48
Football Fields 10.8% 30
Golf Courses 4.7% 13
Horseback Riding Trails 7.9% 22
Kayaking/Canoe Launches 6.1% 17
Open Space/Nature Preserves 13.4% 37
Outdoor Pavilions 23.1% 64
Picnic Areas and Barbeque Pits 43.3% 120
Playgrounds 47.3% 131
Public Beaches 10.1% 28
Public Hunting Areas 6.5% 18
Rock Climbing Walls 13.7% 38
Rodeo/Roping Arenas 5.4% 15
Running Tracks 11.6% 32
RV Parks 0.4% 1
5 of 22
6. Skateboarding Parks 17.7% 49
Soccer Fields 10.5% 29
Softball Fields 15.5% 43
Swimming Pool/Spray Parks 39.0% 108
Tennis Courts 11.9% 33
Volleyball Courts 15.2% 42
Walking/Jogging/Hiking Trails 43.7% 121
Other (please specify) 1
answered question 277
skipped question 63
9. Do you think local governments should develop or improve INDOOR Park and Recreation Facilities in the
County?
Response Response
Percent Count
Yes 93.6% 265
No 6.4% 18
answered question 283
skipped question 57
6 of 22
7. 10. Please check your top FIVE (5) INDOOR Park and Recreation Facilities from the list below that you would like
to see added in the County.
Response Response
Percent Count
Arts & Crafts Rooms 22.5% 58
Audio Visual/TV Rooms 3.9% 10
Auditorium for Music, Plays,
24.0% 62
Performances
Basketball Courts 35.3% 91
Bowling 46.1% 119
Computer Rooms 33.7% 87
Fitness Rooms (yoga, aerobics,
52.7% 136
martial arts)
Game Rooms (foosball, pool, board
34.1% 88
games, ping pong)
Gymnasiums 26.7% 69
Meeting Rooms 13.2% 34
Nature Center 14.3% 37
Racquetball/Handball Courts 8.9% 23
Rock Climbing Walls 20.9% 54
Running Tracks 16.3% 42
Swimming Pool 46.1% 119
Video Game Rooms 21.3% 55
Volleyball Courts 20.2% 52
Weight Rooms 37.6% 97
answered question 258
skipped question 82
7 of 22
8. 11. The list below provides examples of recreational and social programs that some communities develop for their
residents. Would you participate in any of the following programs?
Response
Yes No
Count
Aquatic (swim lessons, water
78.6% (180) 21.4% (49) 229
fitness, etc.)
Arts & Crafts (writing, performing,
78.8% (178) 21.2% (48) 226
dance, music, visual, crafts, etc.)
Fitness Classes (yoga, aerobics,
martial arts, weight lifting, boxing, 86.0% (202) 14.0% (33) 235
etc.)
Youth Summer Camps 75.2% (121) 24.8% (40) 161
Social Activities (family nights,
support groups, social clubs, 72.6% (162) 27.4% (61) 223
volunteering)
Sports Leagues (youth/adult
basketball, soccer, baseball/T-ball, 77.2% (179) 22.8% (53) 232
volleyball, etc.)
Teen Programs (clubs,
adventure/environmental programs, 70.2% (153) 29.8% (65) 218
etc.)
Trip & Tours (youth/adult/senior
outdoor education, hiking, field 76.3% (174) 23.7% (54) 228
trips, etc.)
answered question 262
skipped question 78
12. What can local governments do to increase and/or improve the park and recreational opportunities available
to senior citizens?
Response
Count
99
answered question 99
skipped question 241
8 of 22
9. 13. Please check all the reasons why you and/or your family may not participate more frequently in community
recreational programs or use community park facilities.
Response Response
Percent Count
Not enough programs or park
70.2% 160
facilities
No interest in programs or
6.6% 15
recreational facilities offered
Unable to get to program or facility 13.6% 31
Fees are not affordable 13.6% 31
Lack of time 21.9% 50
Lack of childcare 13.6% 31
Lack of information on programs 37.3% 85
Times and facility locations not
25.0% 57
convenient
Inadequate amenities
29.8% 68
(bathroom/seating areas)
Do not feel safe 20.6% 47
Program or facility is too far away 23.2% 53
Other 2.6% 6
Other (please specify) 10
answered question 228
skipped question 112
9 of 22
10. 14. How often do you go to Port Mansfield?
Response Response
Percent Count
Often 11.4% 30
Sometimes 37.9% 100
Rarely 36.7% 97
Never 14.0% 37
answered question 264
skipped question 76
15. Would you go to Port Mansfield more often if there were a park with nature trails, improved fishing piers,
improved areas for wade fishing, kayaking/canoeing launches, bird viewing stations, nature center, new
playground, picnic pavilion, etc.?
Response Response
Percent Count
Yes 77.1% 205
No 6.0% 16
Maybe 16.9% 45
answered question 266
skipped question 74
16. What is the single most important issue or greatest need concerning parks and recreational programs and
facilities within Willacy County?
Response
Count
173
answered question 173
skipped question 167
10 of 22
11. 17. Please use this space for additional comments:
Response
Count
48
answered question 48
skipped question 292
18. We would like to know your opinion of this survey. How would you rate this survey experience?
Response Response
Percent Count
Excellent 18.1% 50
Very Good 63.0% 174
Good 16.3% 45
Fair 1.8% 5
Poor 0.4% 1
No Opinion 0.4% 1
answered question 276
skipped question 64
11 of 22
12. 19. Marque el pueblo donde vive o el más cercano:
Response Response
Percent Count
Lasara 92.5% 37
Lyford 2.5% 1
Port Mansfield 0.0% 0
Raymondville 0.0% 0
San Perlita 2.5% 1
Sebastian 0.0% 0
Yo no vivo en el Condado de
2.5% 1
Willacy
answered question 40
skipped question 300
20. ¿Cuáles su grupo de edad?
Response Response
Percent Count
Menos de 20 5.3% 2
21-35 50.0% 19
36-50 36.8% 14
51-65 5.3% 2
Más de 65 2.6% 1
answered question 38
skipped question 302
12 of 22
13. 21. ¿Cuál es su sexo?
Response Response
Percent Count
Mujer 84.6% 33
Hombre 15.4% 6
answered question 39
skipped question 301
22. ¿Cuántos niños (de 19 años y menor) viven en su casa?
Response Response
Percent Count
0 7.9% 3
1 7.9% 3
2 23.7% 9
3 26.3% 10
4 23.7% 9
5 5.3% 2
6 2.6% 1
7 2.6% 1
8 0.0% 0
más de 8 0.0% 0
answered question 38
skipped question 302
13 of 22
14. 23. ¿Usted o alguien en su familia participa en ligas organizadas de deporte (béisbol, softbol, voleibol, etc.) fuera
de un programa escolar?
Response Response
Percent Count
Sí 25.6% 10
No 74.4% 29
answered question 39
skipped question 301
24. ¿Cree que gobiernos locales deberían desarrollar o mejorar instalaciones AFUERA de los lugares recreativos
y de los parques en el Condado?
Response Response
Percent Count
Sí 97.4% 38
No 2.6% 1
answered question 39
skipped question 301
14 of 22
15. 25. Favor de indicar las CINCO (5) instalaciones AFUERA de los lugares recreativos y de los parques de la lista de
abajo de abajo que le gustaría ver ser agregado en el Condado.
Response Response
Percent Count
Pabellones al afuera 10.8% 4
Patios de recreo 32.4% 12
Pistas y caminos de bicicleta 29.7% 11
Canchas de béisbol 24.3% 9
Canchas de basquetbol 29.7% 11
Canchas de voleibol 35.1% 13
Canchas de fútbol 18.9% 7
Canchas de softbol 5.4% 2
Canchas de fútbol americano 8.1% 3
Canchas para jugar golfo de discos
0.0% 0
(Frisbee)
Áreas de picnic y con parrillas 70.3% 26
Pistas para caminar/hacer jogging 18.9% 7
Piscinas/parques de espray 21.6% 8
Lanchas de kayak/canoa 8.1% 3
Parques para bicicletas BMX 13.5% 5
Anfiteatros 2.7% 1
Áreas para observar aves 13.5% 5
Canchas de tenis 8.1% 3
Pistas para cabalgata de caballos 2.7% 1
Reservas a cielo abierto o áreas
8.1% 3
protegidas
Playas para ir en monopatín 8.1% 3
Áreas públicas de cacería 2.7% 1
15 of 22
16. Playas públicas 5.4% 2
Parques para tiendas de campo 13.5% 5
Pistas para caminar/hacer
35.1% 13
caminatas
Canchas de golf 2.7% 1
Parques de vehículos recreativos 0.0% 0
Plazas para rodeo/lazar 2.7% 1
Murallas de piedra para trepar 10.8% 4
Muelles para pescar/Área para
5.4% 2
caminar por el agua
answered question 37
skipped question 303
26. ¿Cree que gobiernos locales deberían desarrollar o mejorar instalaciones Interiores de los lugares
recreativos y de los parques cubiertos?
Response Response
Percent Count
Sí 84.2% 32
No 15.8% 6
answered question 38
skipped question 302
16 of 22
17. 27. Favor de indicar las CINCO (5) instalaciones interiores de los lugares recreativos y de los parques de la lista
de abajo que le gustaría ver ser agregado en el Condado.
Response Response
Percent Count
Canchas de basquetbol 31.3% 10
Boliche 28.1% 9
Reserva natural 12.5% 4
Gimnasios 43.8% 14
Salones para reuniones 3.1% 1
Canchas de voleibol 25.0% 8
Pistas interiores de carrera 9.4% 3
Auditorío para música, obras de
18.8% 6
teatro
Canchas de raquetbol/balonmano 9.4% 3
Salones de levantamiento de
50.0% 16
pesas
Piscina interior 34.4% 11
Salones audiovisuales/TV 3.1% 1
Salones para juegos de video 3.1% 1
Salones de computadoras 40.6% 13
Salones de arte y artesanías 37.5% 12
Murallas de piedra para trepar 37.5% 12
Salones de salud (yoga, aerobismo,
43.8% 14
artes marciales)
Salones de recreo (futbolito,
billares, juegos de mesa, ajedrez, 15.6% 5
tenis de mesa)
answered question 32
skipped question 308
17 of 22
18. 28. La lista de abajo da ejemplos de programas recreativos y sociales que algunas comunidades desarrollan para
sus residentes. ¿Participaría en cualquiera de los siguientes programas?
Response
Sí No
Count
Acuática (lecciones de natación,
50.0% (17) 50.0% (17) 34
salud acuática, etc.)
Clases de forma física (yoga,
aerobics, artes marciales,
67.6% (23) 32.4% (11) 34
levantamiento de pesas, boxeo,
etc.)
Actividades Sociales (noches con
familia, grupos de apoyo, clubes 58.8% (20) 41.2% (14) 34
sociales, actividades voluntarios)
Ligas deportivas (básquetbol para
jóvenes/adultos, fútbol, béisbol/T- 55.9% (19) 44.1% (15) 34
bol, voleibol, etc.)
Programas para adolescentes
(clubes, programas de 55.9% (19) 44.1% (15) 34
aventuras/medio ambiente, etc.)
Arte & Artesanías (escritura, teatro,
baile, música, visual, artesanías, 58.8% (20) 41.2% (14) 34
etc.)
Viajes & Turs (educación al aire
libre para jóvenes/adultos/personas
41.2% (14) 58.8% (20) 34
de tercera edad, hacer senderismo,
viajes de un día, etc.)
answered question 34
skipped question 306
18 of 22
19. 29. ¿Que pueden hacer los gobiernos locales para aumentar las oportunidades recreativas y de parques
disponibles para personas de tercera edad?
Response
Count
7
answered question 7
skipped question 333
19 of 22
20. 30. Favor de marcar todas las razones por la cual usted y/o su familia quizás no participarían con más frecuencia
en programas recreativos comunitarios o usar instalaciones de parques comunitarios:
Response Response
Percent Count
Insuficientes programas o
53.8% 14
instalaciones de parques
No puedo llegar al programa o la
19.2% 5
instalación
Las entradas son demasiadas cara 19.2% 5
Falta de tiempo 26.9% 7
Falta de cuidado infantil 26.9% 7
Ningún interés en los programas o
las instalaciones recreativos 3.8% 1
ofrecidos
Falta de información sobre
46.2% 12
programas
Horarios y lugares de instalaciones
30.8% 8
son inconvenientes
No hay baños 11.5% 3
No me siento seguro 11.5% 3
El programa o la instalación es
30.8% 8
demasiado retirado
Otra 0.0% 0
Otra (favor de especificar) 0
answered question 26
skipped question 314
20 of 22
21. 31. ¿Qué tan seguido visita a Port Mansfield?
Response Response
Percent Count
Frecuentemente 0.0% 0
A veces 27.0% 10
Casi nunca 24.3% 9
Nunca 48.6% 18
answered question 37
skipped question 303
32. ¿Iría más seguido a Port Mansfield si hubiera un parque con caminos de naturaleza, muelles de pesca, áreas
mejorados para caminar por el agua, lanzamientos de kayaks/canoas, sitios para observar aves, áreas naturales,
patio de recreo nuevo, pabellón para picnic, etc.?
Response Response
Percent Count
Sí 81.1% 30
No 5.4% 2
Quizás 13.5% 5
answered question 37
skipped question 303
33. ¿Cuál es el tema más importante o la necesidad más importante con respecto a parques y programas
recreativos en el Condado de Willacy?
Response
Count
14
answered question 14
skipped question 326
21 of 22
22. 34. Favor de usar estas líneas para comentarios adicionales.
Response
Count
6
answered question 6
skipped question 334
22 of 22