Board of Directors approves first-half results
•
0 gefällt mir•646 views

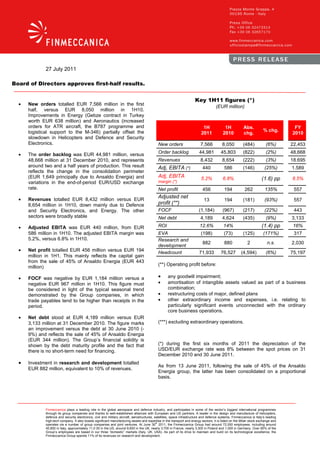
New orders totalled EUR 7,566 million in the first half, versus EUR 8,050 million in 1H10. Improvements in Energy (Gebze contract in Turkey worth EUR 638 million) and Aeronautics (increased orders for ATR aircraft, the B787 programme and logistical support to the M-346) partially offset the slowdown in Helicopters and Defence and Security Electronics.

Empfohlen
Weitere ähnliche Inhalte
Andere mochten auch
Andere mochten auch (16)
Ähnlich wie Board of Directors approves first-half results
Ähnlich wie Board of Directors approves first-half results (20)
Mehr von Leonardo
Mehr von Leonardo (20)
Kürzlich hochgeladen
Kürzlich hochgeladen (20)
Board of Directors approves first-half results
- 1. 27 July 2011 Board of Directors approves first-half results. Key 1H11 figures (*) • New orders totalled EUR 7,566 million in the first (EUR million) half, versus EUR 8,050 million in 1H10. Improvements in Energy (Gebze contract in Turkey worth EUR 638 million) and Aeronautics (increased orders for ATR aircraft, the B787 programme and 1H 1H Abs. FY logistical support to the M-346) partially offset the % chg. 2011 2010 chg. 2010 slowdown in Helicopters and Defence and Security Electronics. New orders 7,566 8,050 (484) (6%) 22,453 • The order backlog was EUR 44,981 million, versus Order backlog 44,981 45,803 (822) (2%) 48,668 48,668 million at 31 December 2010, and represents Revenues 8,432 8,654 (222) (3%) 18.695 around two and a half years of production. This result Adj, EBITA (*) 440 586 (146) (25%) 1.589 reflects the change in the consolidation perimeter (EUR 1,649 principally due to Ansaldo Energia) and Adj, EBITA 5.2% 6.8% (1.6) pp 8.5% variations in the end-of-period EUR/USD exchange margin (*) rate. Net profit 456 194 262 135% 557 • Revenues totalled EUR 8,432 million versus EUR Adjusted net 13 194 (181) (93%) 557 8,654 million in 1H10, down mainly due to Defence profit (**) and Security Electronics, and Energy. The other FOCF (1,184) (967) (217) (22%) 443 sectors were broadly stable Net debt 4,189 4,624 (435) (9%) 3,133 • Adjusted EBITA was EUR 440 million, from EUR ROI 12.6% 14% (1.4) pp 16% 586 million in 1H10. The adjusted EBITA margin was EVA (198) (73) (125) (171%) 317 5.2%, versus 6.8% in 1H10. Research and 882 880 2 n.s. 2,030 development • Net profit totalled EUR 456 million versus EUR 194 Headcount (6%) 71,933 76,527 (4,594) 75,197 million in 1H1. This mainly reflects the capital gain from the sale of 45% of Ansaldo Energia (EUR 443 (**) Operating profit before: million) • FOCF was negative by EUR 1,184 million versus a • any goodwill impairment; negative EUR 967 million in 1H10. This figure must • amortisation of intangible assets valued as part of a business be considered in light of the typical seasonal trend combination; demonstrated by the Group companies, in which • restructuring costs of major, defined plans trade payables tend to be higher than receipts in the • other extraordinary income and expenses, i.e. relating to period. particularly significant events unconnected with the ordinary core business operations. • Net debt stood at EUR 4,189 million versus EUR 3,133 million at 31 December 2010. The figure marks (***) excluding extraordinary operations. an improvement versus the debt at 30 June 2010 (- 9%) and reflects the sale of 45% of Ansaldo Energia (EUR 344 million). The Group’s financial solidity is shown by the debt maturity profile and the fact that (*) during the first six months of 2011 the depreciation of the there is no short-term need for financing. USD/EUR exchange rate was 8% between the spot prices on 31 December 2010 and 30 June 2011. • Investment in research and development totalled As from 13 June 2011, following the sale of 45% of the Ansaldo EUR 882 million, equivalent to 10% of revenues. Energia group, the latter has been consolidated on a proportional basis. Finmeccanica plays a leading role in the global aerospace and defence industry, and participates in some of the sector’s biggest international programmes through its group companies and thanks to well-established alliances with European and US partners. A leader in the design and manufacture of helicopters, defence and security electronics, civil and military aircraft, aerostructures, satellites, space infrastructure and defence systems, Finmeccanica is Italy’s leading high-tech company. It also boasts significant manufacturing assets and expertise in the transport and energy sectors; it is listed on the Milan stock exchange and th operates via a number of group companies and joint ventures. At June 30 2011, the Finmeccanica Group had around 72,000 employees, including around 40,800 in Italy, approximately 11,0 00 in the US, around 9,600 in the UK, nearly 3,700 in France, nearly 3,300 in Poland and 1,000 in Germany. Over 85% of the Group’s employees are based in our three “domestic” markets (Italy, UK, USA). As part of its drive to maintain and build on its technological excellence, the Finmeccanica Group spends 11% of its revenues on research and development.
- 2. CONSOLIDATED PROFIT AND LOSS ACCOUNT 1H 2011 1H 2010 Change % €mil. Revenues 8,432 8,654 -3% Costs for purchases and personnel (7,671) (7,744) Depreciation and amortisation (294) (275) Other net operating revenues (costs) (27) (49) EBITA Adj (*) 440 586 -25% EBITA Adj (*) margin 5.2% 6.8% Non-recurring revenues (costs) (51) - Restructuring costs (27) (16) PPA amortisation (41) (43) EBIT 321 527 -39% EBIT margin 3.8% 6.1% Net finance income (costs) 251 (187) Income taxes (116) (146) Net profit before discontinued 456 194 operations 135% Profit of discontinued operations - - Net profit 456 194 135% Group 433 170 Minorities 23 24 EPS (EUR) Basic 0.750 0.295 Diluted 0.749 0.294 EPS of continuing operations (EUR) Basic 0.750 0.295 Diluted 0.749 0.294 (*) Operating result before: -any impairment in goodwill; -amortisations of intangibles acquired under business combination; -reorganization costs that are a part of significant, defined plans; -other exceptional costs or income, i.e. connected to particularly significant events that are not related to the ordinary performance of the business. BREAKDOWN OF KEY FIGURES In 2010, certain restructuring programs were launched to improve company performance and Group profitability. At the same time, the strained economic outlook of Western economies led to strong pressure on markets and financial systems. Added to this were events and international crises that weighed on Group results as well as persistent structural issues related to the performance of certain businesses. It is therefore necessary to intensify the plans already introduced (as well as consider new measures) to permit improved profitability and adequate value creation. Revenues were EUR 8,432 million in 1H11, versus EUR 8,654 million in the same period of 2010, down EUR 222 million (-3%). The change was mainly due to reduced production volumes in Defence and Security Electronics (stemming from the expected decline in production volumes at DRS Technologies following completion of important programmes for the US armed forces) and in Energy (due to reduced production volumes in the plant and components segment). The other sectors were broadly stable compared with the first half of 2010. 2
- 3. Adjusted EBITA at 30 June 2011 was EUR 440 million versus EUR 586 million in the same period of 2010, down EUR 146 million (-25%). The decrease is attributable to the following sectors: Aeronautica (due to the varying stages of progress of the portfolio programmes and reduced production efficiency); Defence and Security Electronics (owing to the decline in DRS’ revenues, combined with a less profitable mix of activities than in the past); Energy (due to lower revenues and reduced profitability of certain orders in the plant segment owing to a different production mix from that of the same period of 2010); Transport (due to a negative adjusted EBITA in the vehicles and buses segment as a result of cost overruns incurred in certain orders). The adjusted EBITA of the Helicopters, Space and Defence Systems businesses improved. The adjusted EBITA margin was 5.2%, compared with 6.8% in 1H10. Net profit was EUR 456 million in 1H11, up EUR 262 million versus EUR 194 million in the same period of 2010. The main factors in this change were: a deterioration in EBIT (EUR 206 million), which was partially offset by lower taxes, higher net financial charges (EUR 20 million) and the capital gain from the partial sale of Ansaldo Energia (EUR 443 million). Excluding extraordinary operations, the adjusted net profit was EUR 13 million. BALANCE SHEET €mil. 30.06.2011 31.12.2010 Non-current assets 13,141 13,641 Non-current liabilities (2,459) (2,583) 10,682 11,058 Inventories 4,465 4,426 Trade receivables 9,304 9,242 Trade payables (12,078) (12,996) Working capital 1,691 672 Provisions for short-term risks and charges (647) (762) Other current net assets (liabilities) (429) (738) Net working capital 615 (828) Net invested capital 11,297 10,230 Capital and reserves attributable to equity holders 6,830 6,814 of the Company Minority interests 279 284 Shareholders’ equity 7,109 7,098 Net debt (cash) 4,189 3,133 Net liabilities (assets) held for sale (1) (1) Free operating cash flow (FOCF) was negative (cash burn) by EUR 1,184 million at 30 June 2011 versus a negative EUR 967 million at 30 June 2010, down EUR 217 million (-22%). In seasonal terms, first-half outgoings tend to be higher than receipts. During the first half of 2011, prudent management of working capital enabled the Group to improve Free Operating Cash Flow above expectations. Investment in product development, which were more limited than in the first half of 2010, was concentrated in Aeronautics (approximately 33%), Defence and Security Electronics (23%) and Helicopters (around 26%). 3
- 4. CASH FLOW 1H 2011 1H 2010 €mil. Cash and cash equivalents at 1 January 1,854 2,630 Gross cash flow from operating activities 802 1,008 Changes in other operating assets and liabilities(*) (619) (493) Funds From Operations (FFO) 183 515 Changes in working capital (996) (1,059) Cash flow generated from (used in) operating (813) (544) activities Cash flow from ordinary investing activities (371) (423) Free operating cash flow (FOCF) (1,184) (967) Strategic operations 473 (93) Change in other investing activities (**) 21 3 Cash flow generated (used) by investment activities 123 (513) Dividends paid (258) (257) Cash flow from financing activities (127) (438) Cash flow generated (used) by financing activities (385) (695) Exchange gains/losses (45) 41 Cash and cash equivalents at 30 June 734 919 (*) Includes the amounts of “Changes in other operating assets and liabilities and provisions for risks and charges”, “Finance costs paid” and “Income taxes paid”. (**) Includes “Other investing activities”, dividends received from subsidiaries and loss coverage for subsidiaries. Net debt was EUR 4,189 million at 30 June 2011, up EUR 1,056 million versus EUR 3,133 million at 31 December 2010. The figure includes negative FOCF (cash burn) of EUR 1,184 million and reflects the following transactions: payment of EUR 237 million relating to the ordinary dividend paid out by the Parent Company to its shareholders for 2010; payment of EUR 21 million relating to the minorities’ portion of the ordinary dividend paid out by other Group companies (of which EUR 20 million by Ansaldo STS) to their shareholders for 2010; the positive impact of around EUR 344 million from the sale of a 45% stake in Ansaldo Energia to US investment fund First Reserve Corporation and from the resulting proportional consolidation of the Energia group companies. The figure for the period also benefited from the depreciation of the US dollar against the euro at 30 June 2011, compared with end-2010, especially in relation to the conversion of dollar-denominated net debt into euro. Lastly, note that the debt figure at 30 June 2011 is an improvement over the first-half 2010 figure of EUR 4,624 million, down 9%. FINANCIAL POSITION 30.06.2011 31.12.2010 €mil. Short-term financial payables 368 456 Medium/long-term financial payable 4,520 4,437 Cash and cash equivalents (734) (1,854) BANK DEBT AND BONDS 4,154 3,039 Securities (37) (1) Financial receivables from Group companies (177) (34) Other financial receivables (825) (779) FINANCIAL RECEIVABLES AND SECURITIES (1,039) (814) Financial payables to related parties 890 714 Other short-term financial payables 93 88 Other medium/long-term financial payables 91 106 OTHER FINANCIAL PAYABLES 1,074 908 NET FINANCIAL DEBT (CASH) 4,189 3,133 New orders totalled EUR 7,566 million in the first half of 2011, compared with EUR 8,050 million in the first half of 2010, down EUR 484 million (-6.0%). The year-on-year decrease is attributable to the following sectors: Helicopters (due to the postponement until 2012 of some important government 4
- 5. contracts combined with the fact that in 2010 the sector benefited from the EUR 560 million sale of 12 AW101 helicopters to the Indian Air Force); and Defence and Security Electronics (which benefitted from important acquisitions in the first half of 2010 relating to the third tranche of the Eurofighter programme and large orders from the US Army). These factors were partially offset by growth in the following sectors: Energy (through the acquisition of the Gebze contract in Turkey worth around EUR 638 million) and Aeronautics (which posted an increase in orders in both the civil segment, thanks to ATR aircraft and the B787 programme, and the military segment, with logistical support to the M-346). The order backlog was EUR 44,981 million at 30 June 2011, versus EUR 48,668 million at 31 December 2010, down EUR 3,687 million. This net change mainly reflects the effect of the change of consolidation perimeter (EUR 1,649 million, mainly related to Ansaldo Energia) and the conversion of the order book into foreign currency due to the USD/EUR and USD/GBP spot exchange rates at 30 June 2011. The order backlog provides the Group with about 2.5 years of production coverage. Research and Development investments totalled EUR 882 million, broadly in line with the first half of 2010 (EUR 880 million). R&D was focused on the three strategic pillars of Helicopters (around 23% of the Group total), Defence and Security Electronics (approximately 38%) and Aeronautics (about 18%). Headcount at 30 June 2011 was 71,933, a net reduction of 3,264 versus 75,197 at 31 December 2010. This was due to the change in the method of consolidation of Ansaldo Energia (relating to 1,522 employees) and the industrial reorganisation of the Group, especially in the Defence and Security Electronics, and Aeronautics sectors. In geographical terms, around 57% of staff are located in Italy and around 43% are located abroad, mainly in the US (15%), the UK (13%) and France. FIRST-HALF 2011 HIGHLIGHTS AND SIGNIFICANT EVENTS SINCE THE END OF THE PERIOD On 28 March 2011, the Board of Directors of Finmeccanica approved the merger of Elsag Datamat and SELEX Communications. This was completed with effect from 1 June 2011 with the incorporation of Elsag Datamat into SELEX Communications and the concurrent change of name to SELEX Elsag. On the same date, the stakes in Seicos and SELEX Service Management (held by Finmeccanica) and in Digint (held by Finmeccanica Group Services) were transferred to SELEX Elsag. The aim of the operation was to create a centre of excellence at Group level in the sectors of Information and Communication Technology (ICT), Security and Automation, alongside Finmeccanica’s two other centres of competence in Defence Electronics and Security comprising SELEX Galileo (avionics and electro-optics) and SELEX Sistemi Integrati (large systems for defence and homeland security, and surface radar). On 9 March 2011, Finmeccanica signed an agreement with First Reserve Corporation, a US investment fund specialising in the energy sector, to sell a 45% shareholding in Ansaldo Energia. The operation was complete on 13 June 2011 and, together with the capital increase in 2008 and the financial debt restructuring in 2010, completes the initiatives launched by Finmeccanica following the acquisition of DRS Technologies. The transaction was financed with equity of EUR 500 million (of which EUR 275 million contributed by Finmeccanica and EUR 225 million by First Reserve Corporation) and with debt of EUR 573 million. The debt is divided between a medium-term bank loan of EUR 300 million and a short-term vendor loan of EUR 273 million, provided by Finmeccanica, that will be replaced in the medium-term by a revolving line of credit of up to EUR 350 million. Banca Imi SpA, BNP Paribas and Unicredit SpA have provided financial support for the transaction, underwriting financing (loans and revolving lines of credit) for a total of EUR 650 million over a five-year term. The transaction was then syndicated to a pool of leading Italian and international financial institutions. FINANCIAL TRANSACTIONS The Finmeccanica Group did not carry out any significant operations on the bond market in the first half of 2011. The only transaction during the period was the complete repayment (totalling USD 17 million) of the remainder of the bond loans that had been placed on the US market by the subsidiary DRS Technologies and largely repaid in January 2009. Note that a series of operations on rates are under way to convert part of the fixed rate exposure to variable rate, thereby minimising the overall cost of the debts in question. 5
- 6. Note also in this regard that in December 2010 Standard and Poor’s, although confirming their BBB rating on Finmeccanica’s medium-/long-term debt, placed it on negative outlook. In June 2011, Moody’s also decided to place the rating of the Republic of Italy under review for a possible downgrade, with repercussions on Finmeccanica's rating. As of the date that the half-year report was presented, therefore, Finmeccanica’s credit ratings were A3 under review for a possible downgrade (Moody’s), BBB+ outlook stable (Fitch) and BBB outlook negative (Standard and Poor’s). OUTLOOK The Group’s results to 30 June 2011 reveal a slowdown versus the same period in 2010, with the exception of net profit, which benefited from the partial sale of Ansaldo Energia. Performance below that achieved in 1H10 cannot be attributed solely to economic trends and other external factors that include specific market issues, political and social developments in North African countries (particularly in Libya), the economic difficulties and the financial crisis of some European countries, and the weakness of the industrial recovery in the US. Certain structural problems also seem to be emerging, stemming from factors within the Group connected to the industrial performance of specific business sectors namely Aeronautics and Transport (specifically Vehicles). For the latter, order acquisition is unsatisfactory and there are issues concerning the economic conditions of some contracts. Thorough reviews aimed at identifying these problems and implementing appropriate solutions are currently under way. Specific measures, together with a cost-benefit analysis, will be communicated over the next few months and will provide the basis for the 2012-2016 business planning cycle. This will guarantee the solidity of the Group’s balance sheet and a renewed ability to generate future profits, necessary to protect future results from potential internal and external events. In light of the above, we forecast full-year 2011 revenues of between EUR 17.5 billion and EUR 18.0 billion, net of about EUR 400 million as a result of the deconsolidation of 45% of Ansaldo Energia. We are not providing forecasts for operating profit in 2011. Only once we have completed the above-mentioned review and evaluated the impact of the external environment, will we be able to provide a clear forecast of our 2011 results. With regard to the Group’s financial performance, free operating cash flow for the current year is expected to be positive, net of investments in product development which, as in the previous year, will mainly be concentrated in Aeronautics, Helicopters and Defence and Security Electronics. Lastly, in terms of net debt, note that the cash proceeds from the partial sale of Ansaldo Energia reduce the need to refinance debt, with no need refinancing needs until 2013. SHARE DATA 1H Change 1H 2011 2010 % Average number of shares in period (thousands) 577,438 577,006 0.1% Net result (not including minority interests) (€mil.) 433 170 Result of continuing operations (not including minority 433 170 interests) (€mil.) BASIC EPS (EUR) 0.750 0.295 154% Basic EPS from continuing operations 0.750 0.295 154% Average number of shares for the period (in thousands) (*) 578,097 577,665 0.1% Result adjusted (not including minority interests) (€mil.) 433 170 Adjusted result of continuing operations (not including 433 170 minority interests) (€mil.) DILUTED EPS (EUR) 0.749 0.294 155% Diluted EPS from continuing operations 0.749 0.294 155% 6
- 7. PERFORMANCE BY SECTOR (1H11 – figures in EUR million) Helicopters Companies: AgustaWestland Revenues: EUR 1,831 million (+5%); adjusted EBITA: EUR 188 million (+4%) Revenues totalled EUR 1,831 million, up EUR 88 million (+5%) versus EUR 1,743 million in 1H10. The increase is due to the different revenue mix, with the helicopters component showing significant growth in some production lines (AW139; AW109 LUH). Good performance was also recorded in product support with a 14.6% increase in activity. Adjusted EBITA was EUR 188 million, up EUR 7 million (+4%) versus EUR 181 million in 1H10 The improvement is related to the above-mentioned different revenue mix. The adjusted EBITA margin was 10.3%, compared to 10.4% at 30 June 2010. New orders totalled EUR 1,247 million, down EUR 1,244 million (-50%) versus EUR 2,491 million in 1H10. Helicopters (new aircraft and upgrades) accounted for 63.3% of this total, with product support (spare parts and services), engineering and industrial production making up the remaining 36.7%. The decline is due to the postponement to 2012 of some important government contracts previously expected in the first half of 2011. Note also that the previous year had benefited from an important order (12 AW101 helicopters for the Indian Air Force totalling EUR 560 million). The order backlog was EUR 11,328, down EUR 834 million (-7%) versus EUR 12,162 million at 31 December 2010, and sufficient to guarantee around three years of production. The headcount was 13,419, down 154 from 13,573 at 31 December 2010, mainly due to the completion of the reorganisation plan for the Polish group PZL-SWIDNIK. Defence and Security Electronics Companies: DRS Technologies, SELEX Elsag, SELEX Galileo, SELEX Sistemi Integrati Revenues: EUR 2,923 million (-10% ); Adj. EBITA Adj: EUR 181 million (-37%) Revenues totalled EUR 2,923 million, down EUR 332 million from EUR 3,255 million for the first half of 2010 (-10%), due to the expected decline in DRS’s volumes following completion of significant programs for the US Army. Adjusted EBITA was EUR 181 million, down EUR 108 million from EUR 289 in the first half of 2010 (- 37%). This was in line with expectations, as a result of the above-mentioned decrease in revenues at DRS Technologies as well as the effect of a less profitable business mix than in the past. As a result, ROS was 6.2%, versus 8.9% at 30 June 2010. New orders totalled EUR 2,538 million, down EUR 507 million from EUR 3,045 million in the first half of 2010 (-17%), during which orders for the third lot of the EFA program were received, in addition to significant orders from the US Army for DRS. The order backlog was EUR 10,504 million, down EUR 1,243 million from EUR 11,747 million at 31 December 2010 (-11%), due largely to the depreciation of the US dollar and the British pound against the euro. One-third of the order backlog relates to the avionics and electro-optical systems segment, while about one-fifth each relate to major integrated systems, command and control systems and the activities in the United States. Headcount was 28,279, a net decrease of 1,561 from 29,840 at 31 December 2010, attributable to the transfer of business to the Space division and to the on-going reorganization process in some segments. 7
- 8. Aeronautics Companies: Alenia Aeronautica, Alenia Aermacchi, GIE-ATR (*), Alenia North America, SuperJet International (**) Revenues: EUR 1,297 million (+3%); Adj. EBITA: EUR 41 million (- 24%) (*) The figures of the GIE-ATR Joint Venture are consolidated on a 50% proportionate basis. (**)The figures of the SuperJet International Joint Venture are consolidated on a 51% proportionate basis. Revenues : this item amounted to EUR 1,297 million, up EUR 35 million, compared with EUR 1,262 million for the first half of 2010 (+3%), mainly as a result of increased activities in the M-346 and JSF programs, which offset the slowdown in the Eurofighter program. Adjusted EBITA came to EUR 41 million, a EUR 13 million decrease compared with the EUR 54 million reported at 30 June 2010 (-24%). This reduction is largely due to the different mix of progress made on the programs and the difficulties on certain industrial processes for which corrective actions have been taken. As a consequence, ROS stood at 3.2%, compared with 4.3% at 30 June 2010. New orders: this item came to EUR 1,588 million, up EUR 782 million from the EUR 807 million reported in the first half of 2010 (+97%), due to more orders in the civil (ATR aircraft and B787 program) and military (M-346 logistic support) segments. Order backlog: this item came to EUR 8,789 million, reflecting a EUR 151 million increase compared with the EUR 8,638 million at 31 December 2010 (+2%), and is expected to continue expanding over the medium/long term. The order backlog breaks down as follows: 39% Eurofighter, 18% B787, 17% ATR, 6% M-346 and 5% C-27J. The workforce numbered 12,604, a decrease of 341 from the 12,604 at 31 December 2010, essentially due to staff reduction and efficiency efforts undertaken as part of the on-going reorganization and restructuring process. Space Companies: Telespazio, Thales Alenia Space (*) Revenues: EUR 480 million (+17%); Adj. EBITA:EUR 10 million (+100%) (*) The figures relate to the two joint ventures – Telespazio and Thales Alenia Space – which are consolidated on a proportionate basis at 67% and 33%, respectively. Revenues: This item amounted to EUR 480 million, up EUR 68 million, compared with EUR 412 million in the first half of 2010 (+17%), due to an increase in production in both segments (manufacturing and satellite services). Adjusted EBITDA amounted to EUR 10 million, reflecting a EUR 5 million increase on the EUR 5 million for the first half of 2010 (+100%), due to greater production volumes and the greater profitability of the manufacturing segment. Consequently, ROS was 2.1%, compared with 1.2% at 30 June 2010. New orders amounted to EUR 371 million, compared with EUR 497 million for the same period of 2010 (-25%), for a decrease of EUR 126 million, mainly attributable to the manufacturing segment. The order backlog totalled EUR 2,505 million, a decrease of EUR 63 million from the amount at 31 December 2010 (EUR 2,568 million). The backlog at 30 June 2011 is composed of manufacturing activities (66%) and satellite services (34%). The workforce came to 4,095, for an increase of 444 employees from the 3,651 reported at 31 December 2010, mainly as a result of the change in the scope of the satellite services segment due to the transfer of business activity from the Defense and Security Electronics division. 8
- 9. Defense Systems Companies: Oto Melara, WASS, MBDA (*) Revenues: EUR 558 million (+ 4%); Adj. EBITA: EUR 49 million (+32%) (*) The figures related to the MBDA joint venture are consolidated on a 25% proportionate basis Revenues: This item amounted to EUR 558 million, up 21 million on the first half of 2010 (+4%), due mainly to the increases reported in the land, sea and air weapons systems segment. Adjusted EBITA totalled EUR 49 million, a EUR 12 million increase on the EUR 37 million for the first half of 2010, due to greater production volumes in land, sea and air weapon systems and a more profitable mix of activities in missile systems. Consequently, ROS was 8.8% vis-à-vis 6.9% at 30 June 2010. New orders came to EUR 318 million, with a decrease of EUR 96 million from EUR 414 million in the first half of 2010 (-23%), due mainly to missile systems, where significant new orders were reported during the same period of the previous year from the UK Ministry of Defense and for land, sea and air weapon systems from foreign customers. The order backlog came to EUR 3,532 million, down from EUR 3,797 million at 31 December 2010 (- 7%), of which about 60% related to missile systems. The workforce came to 4,087, down 25 from the amount reported at 31 December 2010 (4,112). Energy Companies: Ansaldo Energia (*) Revenues: EUR 562 million (-17%); Adj. EBITA: EUR 42 million (-37%) (*) On 13 June 2011 Fimeccanica sold a 45% equity interest in the Ansaldo Energia group to First Reserve Corporation, a US private equity fund. Following this deal, all the division’s operating data for the first half of 2011 were fully consolidated while the statement of financial position was prepared with the proportionate consolidation method. Revenues: this item amounted to EUR 562 million, a EUR 115 million decrease from the EUR 677 million reported for the first quarter of 2010 (-17%), attributable to lower production volumes in the plants and components segment. Adjusted EBITA came to EUR 42 million, down EUR 25 million from the EUR 67 million for the first half of 2010 (-37%). Consequently, ROS stood at 7.5%, compared with 9.9% at the end of the first half in 2010. New orders amounted to EUR 798 million, up EUR 424 million from EUR 374 million for the same period of 2010 (+113%), due to the new order from Turkey for an 800 MW combined-cycle plant and related scheduled maintenance under a Long Term Service Agreement (LTSA) to be performed in the Gebze plant (worth approximately EUR 638 million). The order backlog came to EUR 1,935 million, down EUR 1,370 million from EUR 3,305 million at 31 December 2010. Of this net decrease, the amount of EUR 1,587 million was attributable to the change in the consolidation method, from full to proportionate. The composition of the backlog is attributable for around 39.4% to plants and components, 55.5% to service activities (82% of which LTSA scheduled maintenance contracts), 2.4% to the nuclear segment, and the remaining 2.7% to renewable energy. The workforce stood at 1,860, down 1,588 from 3,418 at 31 December 2010. The decrease was mainly due to the change in consolidation method. 9
- 10. Transportation Companies: Ansaldo STS, AnsaldoBreda, BredaMenarinibus Revenues: EUR 953 million (-3%); Adj. EBITA: EUR 9 million (-74%) Revenues: This item was equal to EUR 953 million, up EUR 27 million over the EUR 926 million for the same period of 2010 (-3%). The improvement in the bus and vehicles segments – which were still below expectations – largely offset the slight decrease in volumes in the signalling and transportation solutions segment. Adjusted EBITA stood at EUR 9 million, down EUR 26 million from EUR 35 million for the first half of the previous year (-74%), mainly attributable to the Bus and Vehicles segments, both with a negative adjusted EBITA, due particularly to excess costs on certain orders and charges related to the settlement of disputes with a number of customers. ROS for the division stood at 0.9%, compared with 3.8% at 30 June 2010. New Orders: This item amounted to EUR 844 million, reflecting a EUR 111 million increase on the EUR 733 million for the first half of 2010 (+15%), due mainly to larger orders in the Vehicles segment, especially in service and mass transit. The order backlog amounts to EUR 7,168 million, down EUR 135 million from EUR 7,303 million at 31 December 2010 (EUR 7,303 million). The order backlog breaks down as follows: 63.7% for signalling and transportation solutions, 35.8% for vehicles and 0.5% for buses. The workforce stood at 7,045, a 48 employee decrease from 7,093 reported at 31 December 2010. ### The officer in charge of preparing the company’s financial reports, Alessandro Pansa hereby declares, in accordance with the provisions of Article 154-bis of the Consolidated Law on Finance, that the financial disclosure contained in this press release reflects that data contained in the accounting records, books and supporting documentation. 10
- 11. Other 1H 2011 Defence Defence Activities Helicopters Aeronautics Space Energy Transport Eliminations Total (Euro million) Electronics Systems and Corporate Revenues 1,831 2,923 1,297 480 558 562 953 131 (303) 8,432 EBITA Adj (*) 188 181 41 10 49 42 9 (80) 440 EBITA Adj (*) margin 10.3% 6.2% 3.2% 2.1% 8.8% 7.5% 0.9% n.a. 5.2% Depreciation and amortisation 72 116 64 16 16 13 11 27 335 Investment in non-current assets 90 90 112 14 15 13 9 6 349 Research and development costs 203 332 156 31 124 12 24 0 882 New orders 1,247 2,538 1,588 371 318 798 844 230 (368) 7,566 Order backlog 11,328 10,504 8,789 2,505 3,532 1,935 7,168 289 (1,069) 44,981 Headcount 13,419 28,279 12,263 4,095 4,087 1,860 7,045 885 71,933 Other 1H 2010 Defence Defence Activities Helicopters Aeronautics Space Energy Transport Eliminations Total (Euro million) Electronics Systems and Corporate Revenues 1,743 3,255 1,262 412 537 677 926 114 (272) 8,654 EBITA Adj (*) 181 289 54 5 37 67 35 (82) 586 EBITA Adj (*) margin 10.4% 8.9% 4.3% 1.2% 6.9% 9.9% 3.8% n.a. 6.8% Depreciation and amortisation 63 114 71 14 24 12 12 8 318 Investment in non-current assets 66 108 148 22 17 17 21 6 405 Research and development costs 174 341 161 26 125 16 36 1 880 New orders 2,491 3,045 806 497 414 374 733 38 (348) 8,050 Order backlog 31,12,2010 12,162 11,747 8,638 2,568 3,797 3,305 7,303 113 (965) 48,668 Headcount 31,12,2010 13,573 29,840 12,604 3,651 4,112 3,418 7,093 906 75,197 *Operating result before: - any goodwill impairment; - amortisations of intangibles acquired under business combination; - restructuring costs of major, defined plans; - other extraordinary income and expenses, i.e. relating to particularly significant events unconnected with the ordinary operations of the company's core businesses. Finmeccanica plays a leading role in the global aerospace and defence industry, and participates in some of the sector’s biggest international programmes through its group companies and thanks to well-established alliances with European and US partners. A leader in the design and manufacture of helicopters, defence and security electronics, civil and military aircraft, aerostructures, satellites, space infrastructure and defence systems, Finmeccanica is Italy’s leading high-tech company. It also boasts significant th manufacturing assets and expertise in the transport and energy sectors; it is listed on the Milan stock exchange and operates via a number of group companies and joint ventures. At June 30 2011, the Finmeccanica Group had around 72,000 employees, including around 40,800 in Italy, approximately 11,0 00 in the US, around 9,600 in the UK, nearly 3,700 in France, nearly 3,300 in Poland and 1,000 in Germany. Over 85% of the Group’s employees are based in our three “domestic” markets (Italy, UK, USA). As part of its drive to maintain and build on its technological excellence, the Finmeccanica Group spends 11% of its revenues on research and development.