SlideShare ist ein Scribd-Unternehmen logo
1 von 2
GRAPH FUNCTIONS

1.        For this question, use the graph paper provided.

         Table 1 shows the values of two variables, x and y, of a function.


          X            0        1         2        3           4            5             6             7

          Y            0        1         0        -3          -8           -15           -24       -35

                                            Table 1
The scale on the x-axis is 2 cm to 1 unit.
The scale on the y- axis is 2 cm to 5 units
By using the scale given, draw the graph of the function.


2.        For this question, use the graph paper provided.

          Table 2 shows the values of two variables, x and y of a function.

     X            -3        -2           -1        0           1            2             3         4

     Y            -3        10           19  24         25        22         15          4
                                           Table 2
By using the scale of 2 cm to 1 unit on the x-axis and 2 cm to 5 units on the y-axis, draw
the graph of the function.


3.        Use graph paper provided to answer this question.

          Table 3 shows the values of two variables, x and y of a function.

     X                 0            1         2            3            4             5             6

     Y                 0            10        16    18         16          10           0
                                           Table 3
Using a scale of 2 cm to 1 unit on the x-axis and 2 cm to 2 units on the y-axis, draw the
graph of function.


4.       Use the graph paper to answer this question. Table 4 shows the values of two variable,
         x and y of a function.

X             -1            0            1             2            3             4             5

y             0             14           22     24          20          10          -6
                                           Table 4
Draw the graph of function using a scale of 2 cm to 1 unit on the x-axis and 2 cm to 5 units
on the y-axis.


5.       Use the graph paper to answer this question.

         Table 5 shows the values of two variables, x and y of a function.

     X                 -3           -2        -1           0            1             2             3

     Y             -20              -6        -4    -8         -12          -10          4
                                           Table 5
By using a scale of 2 cm to 1 unit on the x-axis and 2 cm to 5 units to the y-axis, draw the
graph of function.
6.             For this question, use the graph paper provided
               Table 6 shows the values of two variables, x and y, of a function.

                                                                                                                  4
           X           -3               -2             -1                  0                  1    2   2.5   3

                                                                                                                  61
           Y         -44               -23             -14                -11                 -8   1   9.5   22
                                                                           Table 6
The scale on the x-xis is 2 cm to 1 unit.
The scale on the y-axis is 2 cm to 10 units.
By using the scale given, draw the graph of the function.


7. Table 1 shows the values of two variables, x and y of a function.

       x          -3          -2        -1       0           1             2          3
       y         -32         -11        -2       1           4            13         34
                                             Table 1

     Draw the graph of the function using a scale of 2 cm to 1 unit on the x–axis and 2 cm to
     10 units on the y–axis.

8. Table 2 shows the values of two variables, x and y, of a function.

       x        -2          -1         0           1      2           3             4          5
       y        11          1         -5          -7     -5           1            11         25
                                                   Table 2

Draw the graph of the function using a scale of 2 cm to 1 unit on the x–axis and 2 cm to 5
units on the y–axis.


9. Table 3 shows the values of two variables, x and y of a function.
       x         -2         -1          0          1       2           3             4         5
       y        -24         -5          0          -3     -8          -9             0        25
                                                    Table 3

Draw the graph of the function using a scale of 2 cm to 1 unit on the x–axis and 2 cm to 5
units on the y–axis.


10. Table 4 shows the values of two variables, x and y, of a function.
           x      -1              0          1        2           3            4         5
           y      -2             12         20       22          18            8         -8
                                                 Table 4


Draw the graph of the function using a scale of 2 cm to 1 unit on the x–axis and 2 cm to 5
units on the y–axis.


11. Table 5 shows the values of two variables, x and y, of a function.

        x        -1         0          1          2     3             4             5         6
        y        2.5        0         -1.5        -2 -1.5             0            2.5        6
                                                    Table 5

Draw the graph of the function using a scale of 2 cm to 1 unit on the x–axis and 2 cm to 1
unit on the y–axis.

Weitere ähnliche Inhalte

Was ist angesagt?

Graphs & linear equations assign
Graphs & linear equations assignGraphs & linear equations assign
Graphs & linear equations assignRobin7761
 
Add Math(F5) Graph Of Function Ii 2.1
Add Math(F5) Graph Of Function Ii 2.1Add Math(F5) Graph Of Function Ii 2.1
Add Math(F5) Graph Of Function Ii 2.1roszelan
 
Module 10 Graphs Of Functions
Module 10 Graphs Of FunctionsModule 10 Graphs Of Functions
Module 10 Graphs Of Functionsguestcc333c
 
Module 11 graph of functions PMR
Module 11 graph of functions PMRModule 11 graph of functions PMR
Module 11 graph of functions PMRroszelan
 
Transformationss
TransformationssTransformationss
Transformationssr0xee
 
Transformationss
TransformationssTransformationss
Transformationssr0xee
 
P2 Graphs Function
P2  Graphs FunctionP2  Graphs Function
P2 Graphs Functionguestcc333c
 
Function tables
Function tablesFunction tables
Function tablesdurandurank
 
Lp simplex method example in construction managment
Lp simplex method example in construction managmentLp simplex method example in construction managment
Lp simplex method example in construction managmentNaghamNagham
 

Was ist angesagt? (9)

Graphs & linear equations assign
Graphs & linear equations assignGraphs & linear equations assign
Graphs & linear equations assign
 
Add Math(F5) Graph Of Function Ii 2.1
Add Math(F5) Graph Of Function Ii 2.1Add Math(F5) Graph Of Function Ii 2.1
Add Math(F5) Graph Of Function Ii 2.1
 
Module 10 Graphs Of Functions
Module 10 Graphs Of FunctionsModule 10 Graphs Of Functions
Module 10 Graphs Of Functions
 
Module 11 graph of functions PMR
Module 11 graph of functions PMRModule 11 graph of functions PMR
Module 11 graph of functions PMR
 
Transformationss
TransformationssTransformationss
Transformationss
 
Transformationss
TransformationssTransformationss
Transformationss
 
P2 Graphs Function
P2  Graphs FunctionP2  Graphs Function
P2 Graphs Function
 
Function tables
Function tablesFunction tables
Function tables
 
Lp simplex method example in construction managment
Lp simplex method example in construction managmentLp simplex method example in construction managment
Lp simplex method example in construction managment
 

Andere mochten auch

Section 2.2 the graph of a function
Section 2.2 the graph of a function Section 2.2 the graph of a function
Section 2.2 the graph of a function Wong Hsiung
 
Kem akademik sept 16
Kem akademik  sept 16Kem akademik  sept 16
Kem akademik sept 16SMK Mukah
 
SPM Paper 2 Esei: FORCE AND PRESSURE
SPM Paper 2 Esei: FORCE AND PRESSURESPM Paper 2 Esei: FORCE AND PRESSURE
SPM Paper 2 Esei: FORCE AND PRESSURESuriyati Yusoff
 
Plans and elevations
Plans and elevationsPlans and elevations
Plans and elevationsSteve Bishop
 
Module 10 Graphs Of Functions
Module 10 Graphs Of FunctionsModule 10 Graphs Of Functions
Module 10 Graphs Of Functionsnorainisaser
 
Plan, section, elevation revised
Plan, section, elevation revisedPlan, section, elevation revised
Plan, section, elevation revisedLee W. Waldrep, Ph.D.
 
Module 15 Plan And Elevation
Module 15 Plan And ElevationModule 15 Plan And Elevation
Module 15 Plan And Elevationguestcc333c
 

Andere mochten auch (8)

5 and 11
5 and 115 and 11
5 and 11
 
Section 2.2 the graph of a function
Section 2.2 the graph of a function Section 2.2 the graph of a function
Section 2.2 the graph of a function
 
Kem akademik sept 16
Kem akademik  sept 16Kem akademik  sept 16
Kem akademik sept 16
 
SPM Paper 2 Esei: FORCE AND PRESSURE
SPM Paper 2 Esei: FORCE AND PRESSURESPM Paper 2 Esei: FORCE AND PRESSURE
SPM Paper 2 Esei: FORCE AND PRESSURE
 
Plans and elevations
Plans and elevationsPlans and elevations
Plans and elevations
 
Module 10 Graphs Of Functions
Module 10 Graphs Of FunctionsModule 10 Graphs Of Functions
Module 10 Graphs Of Functions
 
Plan, section, elevation revised
Plan, section, elevation revisedPlan, section, elevation revised
Plan, section, elevation revised
 
Module 15 Plan And Elevation
Module 15 Plan And ElevationModule 15 Plan And Elevation
Module 15 Plan And Elevation
 

Ă„hnlich wie Graph functions 1

Module 2 quadratic functions
Module 2   quadratic functionsModule 2   quadratic functions
Module 2 quadratic functionsdionesioable
 
Mathematics 9 Quadratic Functions (Module 2)
Mathematics 9 Quadratic Functions (Module 2)Mathematics 9 Quadratic Functions (Module 2)
Mathematics 9 Quadratic Functions (Module 2)Juan Miguel Palero
 
Graph of functions
Graph of functionsGraph of functions
Graph of functionsCikgu Ajis
 
10.1
10.110.1
10.1nglaze10
 
6.6 analyzing graphs of quadratic functions
6.6 analyzing graphs of quadratic functions6.6 analyzing graphs of quadratic functions
6.6 analyzing graphs of quadratic functionsJessica Garcia
 
How to graph Functions
How to graph FunctionsHow to graph Functions
How to graph Functionscoolhanddav
 
4 4 graphingfx
4 4 graphingfx4 4 graphingfx
4 4 graphingfxcoolhanddav
 
Module1 exponential functions
Module1  exponential functionsModule1  exponential functions
Module1 exponential functionsdionesioable
 
7-1 Graphing Exponential Functions - modified for online.pptx
7-1 Graphing Exponential Functions - modified for online.pptx7-1 Graphing Exponential Functions - modified for online.pptx
7-1 Graphing Exponential Functions - modified for online.pptxHunterSheffield3
 
Algebra 2. 9.15. Intro to quadratics
Algebra 2. 9.15. Intro to quadraticsAlgebra 2. 9.15. Intro to quadratics
Algebra 2. 9.15. Intro to quadraticsdmatkeson21
 
AA Section 6-3
AA Section 6-3AA Section 6-3
AA Section 6-3Jimbo Lamb
 
chapter1_part2.pdf
chapter1_part2.pdfchapter1_part2.pdf
chapter1_part2.pdfAliEb2
 
Notes - Graphs of Polynomials
Notes - Graphs of PolynomialsNotes - Graphs of Polynomials
Notes - Graphs of PolynomialsLori Rapp
 
Horizontal Shifts of Quadratic Functions
Horizontal Shifts of Quadratic Functions Horizontal Shifts of Quadratic Functions
Horizontal Shifts of Quadratic Functions MarkBredin
 
transformation of functions.ppt
transformation of functions.ppttransformation of functions.ppt
transformation of functions.pptAsad672922
 
Notes 3-5
Notes 3-5Notes 3-5
Notes 3-5Jimbo Lamb
 
Alg1 ch1101example123
Alg1 ch1101example123Alg1 ch1101example123
Alg1 ch1101example123amymallory
 

Ă„hnlich wie Graph functions 1 (20)

Module 2 quadratic functions
Module 2   quadratic functionsModule 2   quadratic functions
Module 2 quadratic functions
 
Mathematics 9 Quadratic Functions (Module 2)
Mathematics 9 Quadratic Functions (Module 2)Mathematics 9 Quadratic Functions (Module 2)
Mathematics 9 Quadratic Functions (Module 2)
 
Graph of functions
Graph of functionsGraph of functions
Graph of functions
 
10.1
10.110.1
10.1
 
6.6 analyzing graphs of quadratic functions
6.6 analyzing graphs of quadratic functions6.6 analyzing graphs of quadratic functions
6.6 analyzing graphs of quadratic functions
 
How to graph Functions
How to graph FunctionsHow to graph Functions
How to graph Functions
 
4 4 graphingfx
4 4 graphingfx4 4 graphingfx
4 4 graphingfx
 
Module1 exponential functions
Module1  exponential functionsModule1  exponential functions
Module1 exponential functions
 
Graph a function
Graph a functionGraph a function
Graph a function
 
Piecewise functions
Piecewise functions Piecewise functions
Piecewise functions
 
7-1 Graphing Exponential Functions - modified for online.pptx
7-1 Graphing Exponential Functions - modified for online.pptx7-1 Graphing Exponential Functions - modified for online.pptx
7-1 Graphing Exponential Functions - modified for online.pptx
 
Algebra 2. 9.15. Intro to quadratics
Algebra 2. 9.15. Intro to quadraticsAlgebra 2. 9.15. Intro to quadratics
Algebra 2. 9.15. Intro to quadratics
 
AA Section 6-3
AA Section 6-3AA Section 6-3
AA Section 6-3
 
Graph of trigo diploma
Graph of trigo diplomaGraph of trigo diploma
Graph of trigo diploma
 
chapter1_part2.pdf
chapter1_part2.pdfchapter1_part2.pdf
chapter1_part2.pdf
 
Notes - Graphs of Polynomials
Notes - Graphs of PolynomialsNotes - Graphs of Polynomials
Notes - Graphs of Polynomials
 
Horizontal Shifts of Quadratic Functions
Horizontal Shifts of Quadratic Functions Horizontal Shifts of Quadratic Functions
Horizontal Shifts of Quadratic Functions
 
transformation of functions.ppt
transformation of functions.ppttransformation of functions.ppt
transformation of functions.ppt
 
Notes 3-5
Notes 3-5Notes 3-5
Notes 3-5
 
Alg1 ch1101example123
Alg1 ch1101example123Alg1 ch1101example123
Alg1 ch1101example123
 

KĂĽrzlich hochgeladen

Presentation by Andreas Schleicher Tackling the School Absenteeism Crisis 30 ...
Presentation by Andreas Schleicher Tackling the School Absenteeism Crisis 30 ...Presentation by Andreas Schleicher Tackling the School Absenteeism Crisis 30 ...
Presentation by Andreas Schleicher Tackling the School Absenteeism Crisis 30 ...EduSkills OECD
 
Paris 2024 Olympic Geographies - an activity
Paris 2024 Olympic Geographies - an activityParis 2024 Olympic Geographies - an activity
Paris 2024 Olympic Geographies - an activityGeoBlogs
 
Grant Readiness 101 TechSoup and Remy Consulting
Grant Readiness 101 TechSoup and Remy ConsultingGrant Readiness 101 TechSoup and Remy Consulting
Grant Readiness 101 TechSoup and Remy ConsultingTechSoup
 
Interactive Powerpoint_How to Master effective communication
Interactive Powerpoint_How to Master effective communicationInteractive Powerpoint_How to Master effective communication
Interactive Powerpoint_How to Master effective communicationnomboosow
 
Organic Name Reactions for the students and aspirants of Chemistry12th.pptx
Organic Name Reactions  for the students and aspirants of Chemistry12th.pptxOrganic Name Reactions  for the students and aspirants of Chemistry12th.pptx
Organic Name Reactions for the students and aspirants of Chemistry12th.pptxVS Mahajan Coaching Centre
 
BAG TECHNIQUE Bag technique-a tool making use of public health bag through wh...
BAG TECHNIQUE Bag technique-a tool making use of public health bag through wh...BAG TECHNIQUE Bag technique-a tool making use of public health bag through wh...
BAG TECHNIQUE Bag technique-a tool making use of public health bag through wh...Sapna Thakur
 
Accessible design: Minimum effort, maximum impact
Accessible design: Minimum effort, maximum impactAccessible design: Minimum effort, maximum impact
Accessible design: Minimum effort, maximum impactdawncurless
 
9548086042 for call girls in Indira Nagar with room service
9548086042  for call girls in Indira Nagar  with room service9548086042  for call girls in Indira Nagar  with room service
9548086042 for call girls in Indira Nagar with room servicediscovermytutordmt
 
Separation of Lanthanides/ Lanthanides and Actinides
Separation of Lanthanides/ Lanthanides and ActinidesSeparation of Lanthanides/ Lanthanides and Actinides
Separation of Lanthanides/ Lanthanides and ActinidesFatimaKhan178732
 
The Most Excellent Way | 1 Corinthians 13
The Most Excellent Way | 1 Corinthians 13The Most Excellent Way | 1 Corinthians 13
The Most Excellent Way | 1 Corinthians 13Steve Thomason
 
Ecosystem Interactions Class Discussion Presentation in Blue Green Lined Styl...
Ecosystem Interactions Class Discussion Presentation in Blue Green Lined Styl...Ecosystem Interactions Class Discussion Presentation in Blue Green Lined Styl...
Ecosystem Interactions Class Discussion Presentation in Blue Green Lined Styl...fonyou31
 
social pharmacy d-pharm 1st year by Pragati K. Mahajan
social pharmacy d-pharm 1st year by Pragati K. Mahajansocial pharmacy d-pharm 1st year by Pragati K. Mahajan
social pharmacy d-pharm 1st year by Pragati K. Mahajanpragatimahajan3
 
SOCIAL AND HISTORICAL CONTEXT - LFTVD.pptx
SOCIAL AND HISTORICAL CONTEXT - LFTVD.pptxSOCIAL AND HISTORICAL CONTEXT - LFTVD.pptx
SOCIAL AND HISTORICAL CONTEXT - LFTVD.pptxiammrhaywood
 
Russian Call Girls in Andheri Airport Mumbai WhatsApp 9167673311 đź’ž Full Nigh...
Russian Call Girls in Andheri Airport Mumbai WhatsApp  9167673311 đź’ž Full Nigh...Russian Call Girls in Andheri Airport Mumbai WhatsApp  9167673311 đź’ž Full Nigh...
Russian Call Girls in Andheri Airport Mumbai WhatsApp 9167673311 đź’ž Full Nigh...Pooja Nehwal
 
Student login on Anyboli platform.helpin
Student login on Anyboli platform.helpinStudent login on Anyboli platform.helpin
Student login on Anyboli platform.helpinRaunakKeshri1
 
The basics of sentences session 2pptx copy.pptx
The basics of sentences session 2pptx copy.pptxThe basics of sentences session 2pptx copy.pptx
The basics of sentences session 2pptx copy.pptxheathfieldcps1
 
Mastering the Unannounced Regulatory Inspection
Mastering the Unannounced Regulatory InspectionMastering the Unannounced Regulatory Inspection
Mastering the Unannounced Regulatory InspectionSafetyChain Software
 
BASLIQ CURRENT LOOKBOOK LOOKBOOK(1) (1).pdf
BASLIQ CURRENT LOOKBOOK  LOOKBOOK(1) (1).pdfBASLIQ CURRENT LOOKBOOK  LOOKBOOK(1) (1).pdf
BASLIQ CURRENT LOOKBOOK LOOKBOOK(1) (1).pdfSoniaTolstoy
 
Web & Social Media Analytics Previous Year Question Paper.pdf
Web & Social Media Analytics Previous Year Question Paper.pdfWeb & Social Media Analytics Previous Year Question Paper.pdf
Web & Social Media Analytics Previous Year Question Paper.pdfJayanti Pande
 

KĂĽrzlich hochgeladen (20)

Presentation by Andreas Schleicher Tackling the School Absenteeism Crisis 30 ...
Presentation by Andreas Schleicher Tackling the School Absenteeism Crisis 30 ...Presentation by Andreas Schleicher Tackling the School Absenteeism Crisis 30 ...
Presentation by Andreas Schleicher Tackling the School Absenteeism Crisis 30 ...
 
Paris 2024 Olympic Geographies - an activity
Paris 2024 Olympic Geographies - an activityParis 2024 Olympic Geographies - an activity
Paris 2024 Olympic Geographies - an activity
 
Grant Readiness 101 TechSoup and Remy Consulting
Grant Readiness 101 TechSoup and Remy ConsultingGrant Readiness 101 TechSoup and Remy Consulting
Grant Readiness 101 TechSoup and Remy Consulting
 
Interactive Powerpoint_How to Master effective communication
Interactive Powerpoint_How to Master effective communicationInteractive Powerpoint_How to Master effective communication
Interactive Powerpoint_How to Master effective communication
 
Organic Name Reactions for the students and aspirants of Chemistry12th.pptx
Organic Name Reactions  for the students and aspirants of Chemistry12th.pptxOrganic Name Reactions  for the students and aspirants of Chemistry12th.pptx
Organic Name Reactions for the students and aspirants of Chemistry12th.pptx
 
BAG TECHNIQUE Bag technique-a tool making use of public health bag through wh...
BAG TECHNIQUE Bag technique-a tool making use of public health bag through wh...BAG TECHNIQUE Bag technique-a tool making use of public health bag through wh...
BAG TECHNIQUE Bag technique-a tool making use of public health bag through wh...
 
Accessible design: Minimum effort, maximum impact
Accessible design: Minimum effort, maximum impactAccessible design: Minimum effort, maximum impact
Accessible design: Minimum effort, maximum impact
 
9548086042 for call girls in Indira Nagar with room service
9548086042  for call girls in Indira Nagar  with room service9548086042  for call girls in Indira Nagar  with room service
9548086042 for call girls in Indira Nagar with room service
 
Separation of Lanthanides/ Lanthanides and Actinides
Separation of Lanthanides/ Lanthanides and ActinidesSeparation of Lanthanides/ Lanthanides and Actinides
Separation of Lanthanides/ Lanthanides and Actinides
 
The Most Excellent Way | 1 Corinthians 13
The Most Excellent Way | 1 Corinthians 13The Most Excellent Way | 1 Corinthians 13
The Most Excellent Way | 1 Corinthians 13
 
Ecosystem Interactions Class Discussion Presentation in Blue Green Lined Styl...
Ecosystem Interactions Class Discussion Presentation in Blue Green Lined Styl...Ecosystem Interactions Class Discussion Presentation in Blue Green Lined Styl...
Ecosystem Interactions Class Discussion Presentation in Blue Green Lined Styl...
 
social pharmacy d-pharm 1st year by Pragati K. Mahajan
social pharmacy d-pharm 1st year by Pragati K. Mahajansocial pharmacy d-pharm 1st year by Pragati K. Mahajan
social pharmacy d-pharm 1st year by Pragati K. Mahajan
 
SOCIAL AND HISTORICAL CONTEXT - LFTVD.pptx
SOCIAL AND HISTORICAL CONTEXT - LFTVD.pptxSOCIAL AND HISTORICAL CONTEXT - LFTVD.pptx
SOCIAL AND HISTORICAL CONTEXT - LFTVD.pptx
 
Russian Call Girls in Andheri Airport Mumbai WhatsApp 9167673311 đź’ž Full Nigh...
Russian Call Girls in Andheri Airport Mumbai WhatsApp  9167673311 đź’ž Full Nigh...Russian Call Girls in Andheri Airport Mumbai WhatsApp  9167673311 đź’ž Full Nigh...
Russian Call Girls in Andheri Airport Mumbai WhatsApp 9167673311 đź’ž Full Nigh...
 
Mattingly "AI & Prompt Design: Structured Data, Assistants, & RAG"
Mattingly "AI & Prompt Design: Structured Data, Assistants, & RAG"Mattingly "AI & Prompt Design: Structured Data, Assistants, & RAG"
Mattingly "AI & Prompt Design: Structured Data, Assistants, & RAG"
 
Student login on Anyboli platform.helpin
Student login on Anyboli platform.helpinStudent login on Anyboli platform.helpin
Student login on Anyboli platform.helpin
 
The basics of sentences session 2pptx copy.pptx
The basics of sentences session 2pptx copy.pptxThe basics of sentences session 2pptx copy.pptx
The basics of sentences session 2pptx copy.pptx
 
Mastering the Unannounced Regulatory Inspection
Mastering the Unannounced Regulatory InspectionMastering the Unannounced Regulatory Inspection
Mastering the Unannounced Regulatory Inspection
 
BASLIQ CURRENT LOOKBOOK LOOKBOOK(1) (1).pdf
BASLIQ CURRENT LOOKBOOK  LOOKBOOK(1) (1).pdfBASLIQ CURRENT LOOKBOOK  LOOKBOOK(1) (1).pdf
BASLIQ CURRENT LOOKBOOK LOOKBOOK(1) (1).pdf
 
Web & Social Media Analytics Previous Year Question Paper.pdf
Web & Social Media Analytics Previous Year Question Paper.pdfWeb & Social Media Analytics Previous Year Question Paper.pdf
Web & Social Media Analytics Previous Year Question Paper.pdf
 

Graph functions 1

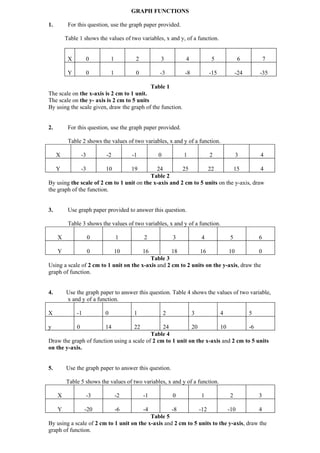
  • 1. GRAPH FUNCTIONS 1. For this question, use the graph paper provided. Table 1 shows the values of two variables, x and y, of a function. X 0 1 2 3 4 5 6 7 Y 0 1 0 -3 -8 -15 -24 -35 Table 1 The scale on the x-axis is 2 cm to 1 unit. The scale on the y- axis is 2 cm to 5 units By using the scale given, draw the graph of the function. 2. For this question, use the graph paper provided. Table 2 shows the values of two variables, x and y of a function. X -3 -2 -1 0 1 2 3 4 Y -3 10 19 24 25 22 15 4 Table 2 By using the scale of 2 cm to 1 unit on the x-axis and 2 cm to 5 units on the y-axis, draw the graph of the function. 3. Use graph paper provided to answer this question. Table 3 shows the values of two variables, x and y of a function. X 0 1 2 3 4 5 6 Y 0 10 16 18 16 10 0 Table 3 Using a scale of 2 cm to 1 unit on the x-axis and 2 cm to 2 units on the y-axis, draw the graph of function. 4. Use the graph paper to answer this question. Table 4 shows the values of two variable, x and y of a function. X -1 0 1 2 3 4 5 y 0 14 22 24 20 10 -6 Table 4 Draw the graph of function using a scale of 2 cm to 1 unit on the x-axis and 2 cm to 5 units on the y-axis. 5. Use the graph paper to answer this question. Table 5 shows the values of two variables, x and y of a function. X -3 -2 -1 0 1 2 3 Y -20 -6 -4 -8 -12 -10 4 Table 5 By using a scale of 2 cm to 1 unit on the x-axis and 2 cm to 5 units to the y-axis, draw the graph of function.
  • 2. 6. For this question, use the graph paper provided Table 6 shows the values of two variables, x and y, of a function. 4 X -3 -2 -1 0 1 2 2.5 3 61 Y -44 -23 -14 -11 -8 1 9.5 22 Table 6 The scale on the x-xis is 2 cm to 1 unit. The scale on the y-axis is 2 cm to 10 units. By using the scale given, draw the graph of the function. 7. Table 1 shows the values of two variables, x and y of a function. x -3 -2 -1 0 1 2 3 y -32 -11 -2 1 4 13 34 Table 1 Draw the graph of the function using a scale of 2 cm to 1 unit on the x–axis and 2 cm to 10 units on the y–axis. 8. Table 2 shows the values of two variables, x and y, of a function. x -2 -1 0 1 2 3 4 5 y 11 1 -5 -7 -5 1 11 25 Table 2 Draw the graph of the function using a scale of 2 cm to 1 unit on the x–axis and 2 cm to 5 units on the y–axis. 9. Table 3 shows the values of two variables, x and y of a function. x -2 -1 0 1 2 3 4 5 y -24 -5 0 -3 -8 -9 0 25 Table 3 Draw the graph of the function using a scale of 2 cm to 1 unit on the x–axis and 2 cm to 5 units on the y–axis. 10. Table 4 shows the values of two variables, x and y, of a function. x -1 0 1 2 3 4 5 y -2 12 20 22 18 8 -8 Table 4 Draw the graph of the function using a scale of 2 cm to 1 unit on the x–axis and 2 cm to 5 units on the y–axis. 11. Table 5 shows the values of two variables, x and y, of a function. x -1 0 1 2 3 4 5 6 y 2.5 0 -1.5 -2 -1.5 0 2.5 6 Table 5 Draw the graph of the function using a scale of 2 cm to 1 unit on the x–axis and 2 cm to 1 unit on the y–axis.