

Empfohlen
Weitere ähnliche Inhalte
Was ist angesagt?
Was ist angesagt? (20)
Andere mochten auch
Andere mochten auch (20)
Ähnlich wie Ecgs
Ähnlich wie Ecgs (20)
Kürzlich hochgeladen
Kürzlich hochgeladen (20)
Ecgs
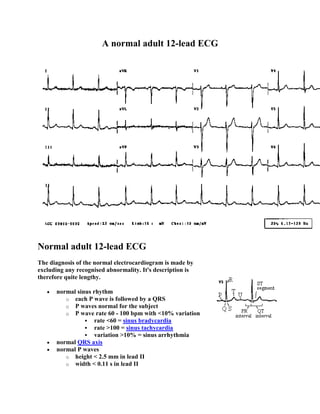
- 1. A normal adult 12-lead ECG Normal adult 12-lead ECG The diagnosis of the normal electrocardiogram is made by excluding any recognised abnormality. It's description is therefore quite lengthy. normal sinus rhythm o each P wave is followed by a QRS o P waves normal for the subject o P wave rate 60 - 100 bpm with <10% variation rate <60 = sinus bradycardia rate >100 = sinus tachycardia variation >10% = sinus arrhythmia normal QRS axis normal P waves o height < 2.5 mm in lead II o width < 0.11 s in lead II
- 2. for abnormal P waves see right atrial hypertrophy, left atrial hypertrophy, atrial premature beat, hyperkalaemia normal PR interval o 0.12 to 0.20 s (3 - 5 small squares) for short PR segment consider Wolff-Parkinson-White syndrome or Lown-Ganong-Levine syndrome (other causes - Duchenne muscular dystrophy, type II glycogen storage disease (Pompe's), HOCM) for long PR interval see first degree heart block and 'trifasicular' block normal QRS complex o < 0.12 s duration (3 small squares) for abnormally wide QRS consider right or left bundle branch block, ventricular rhythm, hyperkalaemia, etc. o no pathological Q waves o no evidence of left or right ventricular hypertrophy normal QT interval o Calculate the corrected QT interval (QTc) by dividing the QT interval by the square root of the preceeding R - R interval. Normal = 0.42 s. o Causes of long QT interval myocardial infarction, myocarditis, diffuse myocardial disease hypocalcaemia, hypothyrodism subarachnoid haemorrhage, intracerebral haemorrhage drugs (e.g. sotalol, amiodarone) hereditary Romano Ward syndrome (autosomal dominant) Jervill + Lange Nielson syndrome (autosomal recessive) associated with sensorineural deafness normal ST segment o no elevation or depression causes of elevation include acute MI (e.g. anterior, inferior), left bundle branch block, normal variants (e.g. athletic heart, Edeiken pattern, high-take off), acute pericarditis causes of depression include myocardial ischaemia, digoxin effect, ventricular hypertrophy, acute posterior MI, pulmonary embolus, left bundle branch block normal T wave causes of tall T waves include hyperkalaemia, hyperacute myocardial infarction and left bundle branch block causes of small, flattened or inverted T waves are numerous and include ischaemia, age, race, hyperventilation, anxiety, drinking iced water, LVH, drugs (e.g. digoxin), pericarditis, PE, intraventricular conduction delay (e.g. RBBB)and electrolyte disturbance. normal U wave
- 3. IShemic heart disease A 55 year old man with 4 hours of "crushing" chest pain. Acute inferior myocardial infarction ST elevation in the inferior leads II, III and aVF reciprocal ST depression in the anterior leads See also acute anterior MI. Right Bundle Branch Block and sinus bradycardia are also present.
- 4. A 63 year old woman with 10 hours of chest pain and sweating. Acute anterior myocardial infarction ST elevation in the anterior leads V1 - 6, I and aVL reciprocal ST depression in the inferior leads A 60 year old woman with 3 hours of chest pain.
- 5. Acute posterior myocardial infarction (hyperacute) the mirror image of acute injury in leads V1 - 3 (fully evolved) tall R wave, tall upright T wave in leads V1 -3 usually associated with inferior and/or lateral wall MI A 53 year old man with Ischaemic Heart Disease.
- 6. Old inferior myocardial infarction a Q wave in lead III wider than 1 mm (1 small square) and a Q wave in lead aVF wider than 0.5 mm and a Q wave of any size in lead II A 79 year old man with 5 hours of chest pain.
- 7. Acute myocardial infarction in the presence of left bundle branch block Features suggesting acute MI ST changes in the same direction as the QRS (as shown here) ST elevation more than you'd expect from LBBB alone (e.g. > 5 mm in leads V1 - 3) Q waves in two consecutive lateral leads (indicating anteroseptal MI) HYPERTROPHY PATTERNS An 83 year old man with aortic stenosis.
- 8. Left ventricular hypertrophy (LVH) There are many different criteria for LVH. Sokolow + Lyon (Am Heart J, 1949;37:161) o S V1+ R V5 or V6 > 35 mm Cornell criteria (Circulation, 1987;3: 565-72) o SV3 + R avl > 28 mm in men o SV3 + R avl > 20 mm in women Framingham criteria (Circulation,1990; 81:815-820) o R avl > 11mm, R V4-6 > 25mm o S V1-3 > 25 mm, S V1 or V2 + o R V5 or V6 > 35 mm, R I + S III > 25 mm Romhilt + Estes (Am Heart J, 1986:75:752-58) o Point score system
- 9. Left atrial abnormality (dilatation or hypertrophy) M shaped P wave in lead II prominent terminal negative component to P wave in lead V1 (shown here) See also - mitral stenosis. A 75 year old lady with loud first heart sound and mid- diastolic murmur. Mitral Stenosis There is atrial fibrillation. No P waves are visible. The rhythm is irregularly irregular (random). There is the suggestion of right ventricular hypertrophy. Right axis deviation and deep S waves in the lateral leads. Another important feature of right ventricular hypertrophy not shown here is a dominant R wave in lead V1. The combination of Atrial Fibrillation and Right Axis Deviation on the ECG suggests the possibility of mitral stenosis. A 59 year old lady with chronic bronchitis.
- 10. Right atrial hypertrophy A P wave in lead II taller then 2.5 mm (2.5 small squares). The P wave is usually pointed. An 84 year old lady with hypertension
- 11. There are a number of abnormalities here. left anterior hemiblock o QRS axis more left than -30 degrees o initial R wave in the inferior leads (II, III and aVF) o absence of any other cause of left axis deviation left ventricular hypertrophy o In the presence of left anterior hemiblock the diagnostic criteria of LVH are changed. Rosenbaum suggested that an S wave in lead III deeper than 15 mm as predictive of LVH. long PR interval (also called first degree heart block) o PR interval longer than 0.2 seconds left atrial hypertrophy o M shaped P wave in lead II o P wave duration > 0.11 seconds o terminal negative component to the P wave in lead V1