SlideShare ist ein Scribd-Unternehmen logo
1 von 4
Algebra 1
Chapter 5 Study Guide
What is slope-intercept form? _______________________________________________
What is point-slope form? __________________________________________________
What is standard form? ____________________________________________________
What is the equation for slope given 2 points? __________________________________
Write an equation of the line in slope-intercept form.
1. The slope is 1; the y-intercept is 2.
2. The slope is – ¼; the y-intercept is 1.
3. The slope is – 3; the y-intercept is – ½.
4. 5.
Using Point-Slope form: Write an equation given POINT and SLOPE.
Step 1)Plug in the slope and the point. Remember: points are written (x, y).
Step 2)Distribute the slope.
Step 3)Combine like terms.
6. m = – 2, (6, – 3)
7. m = 1/3, (– 3, 0)
8. m = – 3, (– 2, – 1) Extra practice p. 282 (12 – 29)
Parallel and Perpendicular
What does parallel mean? __________________________________________________
What does perpendicular mean? _____________________________________________
If you are given an equation, and told to find a DIFFERENT equation that is parallel, use
the slope from the original equation. If you are also given a POINT, use point-slope
form to find the new equation.
9. Find an equation parallel to y = 2/3 x – 2 that goes through (– 2, 1).
10. Find an equation parallel to y = – 3x – 2 that goes through (3, – 4).
11. Find an equation perpendicular to y = 2/3 x – 2 that goes through (– 2, 1).
12. Find an equation perpendicular to y = – 3x – 2 that goes through (3, – 4).
Extra practice p. 283 (32 – 40) and 289 (45 – 47)
Write an equation given 2 POINTS.
Step 1)Find slope using the slope equation.
Step 2)Use the slope and one of the points in the point-slope form equation, follow steps
above.
13. (1, 6) and (3, – 4)
14. (– 3, 1) and (5, 5)
15. (2, 4) and (1, – 2)
16. (– 8, – 4) and (4, 2)
17. (12, 2) and (7, 2)
Extra practice p. 288 (18 – 35)
Fitting a Line to Data
Step 1)Make a scatter plot from the data.
Step 2)Draw a straight line through the points.
Step 3)Choose 2 points on the line and make an equation.
18. A tadpole eventually turns into a frog. There is a relationship between the age of
a tadpole and the length of its tail (which eventually disappears). Make a scatter plot of
the data and write an equation of the line of best fit.
Age (days) Length of Tail
(mm)
5 14
2 15
9 3
7 8
12 1
10 3
3 12
6 9
19. Draw a scatter plot and find the equation of the line of best fit. What kind of
correlation does this data have?
x 2 9 1 8 5
y 11 27 9 23 17
Standard Form
--No fractions. Multiply all terms by denominator to get rid of fractions.
--x and y on the same side of the equal sign.
20. Write y = 2/5 x – 3 in standard form.
21. Write the equation of m = – 2, (– 4, 3) in standard form.
22. Write – 5x + 11 = ½ y in standard form.
Extra practice p. 311 (18 – 44)
Does this have a positive correlation?
negative correlation? no correlation?
Linear Models
Given a set of data, graph the line of best fit and find its equation.
What does interpolation mean? ______________________________________________
What does extrapolation mean? ______________________________________________
23. Graph both sets on different grids. Which is a linear model?
set 1
x 1 2 3 4
y 12 25 36 48set 2
24. Use the table to do the following: (amount spent on sports supplies each year)
Years since 1990 Billions of Dollars
0 31.6
1 32.8
2 ?
3 36.5
4 40.1
5 42.7
a) Write a linear equation to represent the amount spent on sports supplies.
b) Estimate the amount spent in 1992. Is this interpolation or extrapolation?
c) Estimate the amount spent in 2005. Is this interpolation or extrapolation?
Extra practice p. 319 (11 – 34)
25. What is the equation of the line that passes through (7, 4) and (– 5, – 2)?
[A] y = ½ x – ½ [B] y = – ½ x + ½
[C] y = – ½ x – ½ [D] y = ½ x + ½
26. Choose the lines that are perpendicular.
Line p that passes through (4, 0) and (6, 4).
Line q that passes through (0, 4) and (6, 4).
Line r that passes through (0, 4) and (0, 0).
[A] line p and line q. [B] line p and line r.
[C] line q and line r. [D] none of these.
All students in a class were surveyed about how long they studied at home. The table
shows hours studied and average test grades.
Hours spent studying 0 .
25
.5 .
75
1 1.
5
2 3 5 7
Average grade on test 2
9
32 3
5
38 4
0
47 5
4
6
6
7
9
89
27. Make a scatter plot of the data.
28. Make a line of best fit and give the equation for it.
29. If you study 4 hours, what is your expected test grade?
30. If you want to make a 93, how long should you study?
31. If you were a parent, what advice would you give your child about studying at
home for this test? Explain your reasoning.
x 1 2 3 4
y 10 5 2 1

Weitere ähnliche Inhalte

Was ist angesagt?

Chapter 6.3 6.4
Chapter 6.3 6.4Chapter 6.3 6.4
Chapter 6.3 6.4nglaze10
 
(8) Lesson 3.6
(8) Lesson 3.6(8) Lesson 3.6
(8) Lesson 3.6wzuri
 
3.5 write and graph equations of lines
3.5 write and graph equations of lines3.5 write and graph equations of lines
3.5 write and graph equations of linesmasljr
 
4.3 point slope form
4.3 point slope form4.3 point slope form
4.3 point slope formLyndeeGovert
 
Rational numbers on the number line
Rational numbers on the number lineRational numbers on the number line
Rational numbers on the number lineajay gupta
 
Lesson 2b - scalar multiplication
Lesson 2b - scalar multiplicationLesson 2b - scalar multiplication
Lesson 2b - scalar multiplicationJonathan Templin
 
Alg 1 day 58 6.1 6.3 review
Alg 1 day 58 6.1   6.3 reviewAlg 1 day 58 6.1   6.3 review
Alg 1 day 58 6.1 6.3 reviewKathy Favazza
 
Harkeerit&Kyra
Harkeerit&KyraHarkeerit&Kyra
Harkeerit&Kyrakpwise
 
4.3b standard form
4.3b standard form4.3b standard form
4.3b standard formLyndeeGovert
 
Solving linear equations
Solving linear equationsSolving linear equations
Solving linear equationsMoazam Hanif
 
January 27, 2014
January 27, 2014January 27, 2014
January 27, 2014khyps13
 
Mid Point Formula (Coordinate Geometry) Grade 9th
Mid Point Formula (Coordinate Geometry) Grade 9thMid Point Formula (Coordinate Geometry) Grade 9th
Mid Point Formula (Coordinate Geometry) Grade 9thIsmat Rashid
 
4.4 parallel & perpendicular lines
4.4 parallel & perpendicular lines4.4 parallel & perpendicular lines
4.4 parallel & perpendicular linesLyndeeGovert
 

Was ist angesagt? (20)

Ml lesson 4 2
Ml lesson 4 2Ml lesson 4 2
Ml lesson 4 2
 
Patterns in Series
Patterns in SeriesPatterns in Series
Patterns in Series
 
Chapter 6.3 6.4
Chapter 6.3 6.4Chapter 6.3 6.4
Chapter 6.3 6.4
 
(8) Lesson 3.6
(8) Lesson 3.6(8) Lesson 3.6
(8) Lesson 3.6
 
3.5 write and graph equations of lines
3.5 write and graph equations of lines3.5 write and graph equations of lines
3.5 write and graph equations of lines
 
Absolute Value
Absolute ValueAbsolute Value
Absolute Value
 
4.3 point slope form
4.3 point slope form4.3 point slope form
4.3 point slope form
 
Rational numbers on the number line
Rational numbers on the number lineRational numbers on the number line
Rational numbers on the number line
 
Lesson 2b - scalar multiplication
Lesson 2b - scalar multiplicationLesson 2b - scalar multiplication
Lesson 2b - scalar multiplication
 
Alg 1 day 58 6.1 6.3 review
Alg 1 day 58 6.1   6.3 reviewAlg 1 day 58 6.1   6.3 review
Alg 1 day 58 6.1 6.3 review
 
Harkeerit&Kyra
Harkeerit&KyraHarkeerit&Kyra
Harkeerit&Kyra
 
4.3b standard form
4.3b standard form4.3b standard form
4.3b standard form
 
Developing strategic intervention material
Developing strategic intervention materialDeveloping strategic intervention material
Developing strategic intervention material
 
Solving linear equations
Solving linear equationsSolving linear equations
Solving linear equations
 
January 27, 2014
January 27, 2014January 27, 2014
January 27, 2014
 
Dividing Polynomials
Dividing PolynomialsDividing Polynomials
Dividing Polynomials
 
Mid Point Formula (Coordinate Geometry) Grade 9th
Mid Point Formula (Coordinate Geometry) Grade 9thMid Point Formula (Coordinate Geometry) Grade 9th
Mid Point Formula (Coordinate Geometry) Grade 9th
 
4.4 parallel & perpendicular lines
4.4 parallel & perpendicular lines4.4 parallel & perpendicular lines
4.4 parallel & perpendicular lines
 
Arithmetic Sequence
Arithmetic SequenceArithmetic Sequence
Arithmetic Sequence
 
Portofolio mtk
Portofolio mtkPortofolio mtk
Portofolio mtk
 

Andere mochten auch

A16 2 multistep iniqualities
A16 2 multistep iniqualitiesA16 2 multistep iniqualities
A16 2 multistep iniqualitiesvhiggins1
 
A27 3 powerfxns
A27 3 powerfxnsA27 3 powerfxns
A27 3 powerfxnsvhiggins1
 
A28-2 exponential decay
A28-2 exponential decayA28-2 exponential decay
A28-2 exponential decayvhiggins1
 
A16-5 Graphing Inequalities
A16-5 Graphing InequalitiesA16-5 Graphing Inequalities
A16-5 Graphing Inequalitiesvhiggins1
 
A27 6 radical equations
A27 6 radical equationsA27 6 radical equations
A27 6 radical equationsvhiggins1
 
A15-5&5-6 Forms of Equations
A15-5&5-6 Forms of EquationsA15-5&5-6 Forms of Equations
A15-5&5-6 Forms of Equationsvhiggins1
 
A17-3 combination
A17-3 combinationA17-3 combination
A17-3 combinationvhiggins1
 
A16-3 Compound Inequalities
A16-3 Compound InequalitiesA16-3 Compound Inequalities
A16-3 Compound Inequalitiesvhiggins1
 
A19-3 graphing quadratics
A19-3 graphing quadraticsA19-3 graphing quadratics
A19-3 graphing quadraticsvhiggins1
 

Andere mochten auch (9)

A16 2 multistep iniqualities
A16 2 multistep iniqualitiesA16 2 multistep iniqualities
A16 2 multistep iniqualities
 
A27 3 powerfxns
A27 3 powerfxnsA27 3 powerfxns
A27 3 powerfxns
 
A28-2 exponential decay
A28-2 exponential decayA28-2 exponential decay
A28-2 exponential decay
 
A16-5 Graphing Inequalities
A16-5 Graphing InequalitiesA16-5 Graphing Inequalities
A16-5 Graphing Inequalities
 
A27 6 radical equations
A27 6 radical equationsA27 6 radical equations
A27 6 radical equations
 
A15-5&5-6 Forms of Equations
A15-5&5-6 Forms of EquationsA15-5&5-6 Forms of Equations
A15-5&5-6 Forms of Equations
 
A17-3 combination
A17-3 combinationA17-3 combination
A17-3 combination
 
A16-3 Compound Inequalities
A16-3 Compound InequalitiesA16-3 Compound Inequalities
A16-3 Compound Inequalities
 
A19-3 graphing quadratics
A19-3 graphing quadraticsA19-3 graphing quadratics
A19-3 graphing quadratics
 

Ähnlich wie A1 Chapter 5 Study Guide

January 21, 2015
January 21, 2015January 21, 2015
January 21, 2015khyps13
 
(8) Lesson 3.7
(8) Lesson 3.7(8) Lesson 3.7
(8) Lesson 3.7wzuri
 
January 20, 2015
January 20, 2015January 20, 2015
January 20, 2015khyps13
 
Algebra-H-Equation-of-a-Straight-Line-v3.pdf
Algebra-H-Equation-of-a-Straight-Line-v3.pdfAlgebra-H-Equation-of-a-Straight-Line-v3.pdf
Algebra-H-Equation-of-a-Straight-Line-v3.pdfPraba Karan
 
Gradient of a line
Gradient of a lineGradient of a line
Gradient of a lineJulia Smith
 
New approaches in linear inequalities
New approaches in linear inequalitiesNew approaches in linear inequalities
New approaches in linear inequalitiesTarun Gehlot
 
GCSE-StraightLines.pptx
GCSE-StraightLines.pptxGCSE-StraightLines.pptx
GCSE-StraightLines.pptxNourLahham2
 
chapter1_part2.pdf
chapter1_part2.pdfchapter1_part2.pdf
chapter1_part2.pdfAliEb2
 
Precalculus 1 chapter 1
Precalculus 1 chapter 1Precalculus 1 chapter 1
Precalculus 1 chapter 1oreves
 
Lesson 1 8 quiz review
Lesson 1 8 quiz reviewLesson 1 8 quiz review
Lesson 1 8 quiz reviewmlabuski
 
Lesson 1 see lesson plans
Lesson 1   see lesson plansLesson 1   see lesson plans
Lesson 1 see lesson plansAngela Phillips
 
Linear equations in two variables
Linear equations in two variablesLinear equations in two variables
Linear equations in two variablesarvin efriani
 
Linear equations
Linear equationsLinear equations
Linear equationsadi nurhadi
 
February 16 2016
February 16 2016February 16 2016
February 16 2016khyps13
 
0113 examia
0113 examia0113 examia
0113 examiapschlein
 
6.4_standard_form.ppt
6.4_standard_form.ppt6.4_standard_form.ppt
6.4_standard_form.pptmikeebio1
 

Ähnlich wie A1 Chapter 5 Study Guide (20)

January 21, 2015
January 21, 2015January 21, 2015
January 21, 2015
 
(8) Lesson 3.7
(8) Lesson 3.7(8) Lesson 3.7
(8) Lesson 3.7
 
Linear Equations in Two Variables.pptx
Linear Equations in Two Variables.pptxLinear Equations in Two Variables.pptx
Linear Equations in Two Variables.pptx
 
January 20, 2015
January 20, 2015January 20, 2015
January 20, 2015
 
Algebra-H-Equation-of-a-Straight-Line-v3.pdf
Algebra-H-Equation-of-a-Straight-Line-v3.pdfAlgebra-H-Equation-of-a-Straight-Line-v3.pdf
Algebra-H-Equation-of-a-Straight-Line-v3.pdf
 
Gradient of a line
Gradient of a lineGradient of a line
Gradient of a line
 
New approaches in linear inequalities
New approaches in linear inequalitiesNew approaches in linear inequalities
New approaches in linear inequalities
 
GCSE-StraightLines.pptx
GCSE-StraightLines.pptxGCSE-StraightLines.pptx
GCSE-StraightLines.pptx
 
chapter1_part2.pdf
chapter1_part2.pdfchapter1_part2.pdf
chapter1_part2.pdf
 
Precalculus 1 chapter 1
Precalculus 1 chapter 1Precalculus 1 chapter 1
Precalculus 1 chapter 1
 
Lesson 1 8 quiz review
Lesson 1 8 quiz reviewLesson 1 8 quiz review
Lesson 1 8 quiz review
 
Lesson 1 see lesson plans
Lesson 1   see lesson plansLesson 1   see lesson plans
Lesson 1 see lesson plans
 
Ch02 se
Ch02 seCh02 se
Ch02 se
 
Linear equations in two variables
Linear equations in two variablesLinear equations in two variables
Linear equations in two variables
 
Chapter 5 Point Slope Form
Chapter 5 Point Slope FormChapter 5 Point Slope Form
Chapter 5 Point Slope Form
 
Linear equations
Linear equationsLinear equations
Linear equations
 
February 16 2016
February 16 2016February 16 2016
February 16 2016
 
0113 examia
0113 examia0113 examia
0113 examia
 
Math 9 Quiz Bee.pptx
Math 9 Quiz Bee.pptxMath 9 Quiz Bee.pptx
Math 9 Quiz Bee.pptx
 
6.4_standard_form.ppt
6.4_standard_form.ppt6.4_standard_form.ppt
6.4_standard_form.ppt
 

Mehr von vhiggins1

A1 12 scatter plots
A1 12 scatter plotsA1 12 scatter plots
A1 12 scatter plotsvhiggins1
 
A1 11 functions
A1 11 functionsA1 11 functions
A1 11 functionsvhiggins1
 
A1 11 functions
A1 11 functionsA1 11 functions
A1 11 functionsvhiggins1
 
A2 Test 3 with answers 2011
A2 Test 3 with answers 2011A2 Test 3 with answers 2011
A2 Test 3 with answers 2011vhiggins1
 
A1 Test 3 study guide with answers
A1 Test 3 study guide with answersA1 Test 3 study guide with answers
A1 Test 3 study guide with answersvhiggins1
 
PC Test 2 study guide 2011
PC Test 2 study guide 2011PC Test 2 study guide 2011
PC Test 2 study guide 2011vhiggins1
 
A2 Test 2 study guide with answers (revised)
A2 Test 2 study guide with answers (revised)A2 Test 2 study guide with answers (revised)
A2 Test 2 study guide with answers (revised)vhiggins1
 
A2 Test 2 study guide with answers
A2 Test 2 study guide with answersA2 Test 2 study guide with answers
A2 Test 2 study guide with answersvhiggins1
 
A1 Test 2 study guide with answers 2011
A1 Test 2 study guide with answers 2011A1 Test 2 study guide with answers 2011
A1 Test 2 study guide with answers 2011vhiggins1
 
A1 Test 2 study guide
A1 Test 2 study guideA1 Test 2 study guide
A1 Test 2 study guidevhiggins1
 
PCExam 1 practice with answers
PCExam 1 practice with answersPCExam 1 practice with answers
PCExam 1 practice with answersvhiggins1
 
PCExam 1 study guide answers
PCExam 1 study guide answersPCExam 1 study guide answers
PCExam 1 study guide answersvhiggins1
 
PC Exam 1 study guide
PC Exam 1 study guidePC Exam 1 study guide
PC Exam 1 study guidevhiggins1
 
PC 1 continuity notes
PC 1 continuity notesPC 1 continuity notes
PC 1 continuity notesvhiggins1
 
PC 1 continuity
PC 1 continuityPC 1 continuity
PC 1 continuityvhiggins1
 
A1 3 linear fxns
A1 3 linear fxnsA1 3 linear fxns
A1 3 linear fxnsvhiggins1
 
A1 3 linear fxns notes
A1 3 linear fxns notesA1 3 linear fxns notes
A1 3 linear fxns notesvhiggins1
 
A1 2 linear fxns
A1 2 linear fxnsA1 2 linear fxns
A1 2 linear fxnsvhiggins1
 
A1 2 linear fxns notes
A1 2 linear fxns notesA1 2 linear fxns notes
A1 2 linear fxns notesvhiggins1
 
A2 2 linear fxns notes
A2 2 linear fxns notesA2 2 linear fxns notes
A2 2 linear fxns notesvhiggins1
 

Mehr von vhiggins1 (20)

A1 12 scatter plots
A1 12 scatter plotsA1 12 scatter plots
A1 12 scatter plots
 
A1 11 functions
A1 11 functionsA1 11 functions
A1 11 functions
 
A1 11 functions
A1 11 functionsA1 11 functions
A1 11 functions
 
A2 Test 3 with answers 2011
A2 Test 3 with answers 2011A2 Test 3 with answers 2011
A2 Test 3 with answers 2011
 
A1 Test 3 study guide with answers
A1 Test 3 study guide with answersA1 Test 3 study guide with answers
A1 Test 3 study guide with answers
 
PC Test 2 study guide 2011
PC Test 2 study guide 2011PC Test 2 study guide 2011
PC Test 2 study guide 2011
 
A2 Test 2 study guide with answers (revised)
A2 Test 2 study guide with answers (revised)A2 Test 2 study guide with answers (revised)
A2 Test 2 study guide with answers (revised)
 
A2 Test 2 study guide with answers
A2 Test 2 study guide with answersA2 Test 2 study guide with answers
A2 Test 2 study guide with answers
 
A1 Test 2 study guide with answers 2011
A1 Test 2 study guide with answers 2011A1 Test 2 study guide with answers 2011
A1 Test 2 study guide with answers 2011
 
A1 Test 2 study guide
A1 Test 2 study guideA1 Test 2 study guide
A1 Test 2 study guide
 
PCExam 1 practice with answers
PCExam 1 practice with answersPCExam 1 practice with answers
PCExam 1 practice with answers
 
PCExam 1 study guide answers
PCExam 1 study guide answersPCExam 1 study guide answers
PCExam 1 study guide answers
 
PC Exam 1 study guide
PC Exam 1 study guidePC Exam 1 study guide
PC Exam 1 study guide
 
PC 1 continuity notes
PC 1 continuity notesPC 1 continuity notes
PC 1 continuity notes
 
PC 1 continuity
PC 1 continuityPC 1 continuity
PC 1 continuity
 
A1 3 linear fxns
A1 3 linear fxnsA1 3 linear fxns
A1 3 linear fxns
 
A1 3 linear fxns notes
A1 3 linear fxns notesA1 3 linear fxns notes
A1 3 linear fxns notes
 
A1 2 linear fxns
A1 2 linear fxnsA1 2 linear fxns
A1 2 linear fxns
 
A1 2 linear fxns notes
A1 2 linear fxns notesA1 2 linear fxns notes
A1 2 linear fxns notes
 
A2 2 linear fxns notes
A2 2 linear fxns notesA2 2 linear fxns notes
A2 2 linear fxns notes
 

A1 Chapter 5 Study Guide

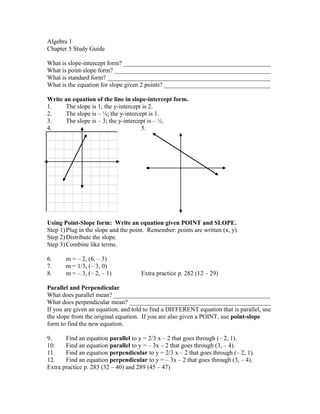
  • 1. Algebra 1 Chapter 5 Study Guide What is slope-intercept form? _______________________________________________ What is point-slope form? __________________________________________________ What is standard form? ____________________________________________________ What is the equation for slope given 2 points? __________________________________ Write an equation of the line in slope-intercept form. 1. The slope is 1; the y-intercept is 2. 2. The slope is – ¼; the y-intercept is 1. 3. The slope is – 3; the y-intercept is – ½. 4. 5. Using Point-Slope form: Write an equation given POINT and SLOPE. Step 1)Plug in the slope and the point. Remember: points are written (x, y). Step 2)Distribute the slope. Step 3)Combine like terms. 6. m = – 2, (6, – 3) 7. m = 1/3, (– 3, 0) 8. m = – 3, (– 2, – 1) Extra practice p. 282 (12 – 29) Parallel and Perpendicular What does parallel mean? __________________________________________________ What does perpendicular mean? _____________________________________________ If you are given an equation, and told to find a DIFFERENT equation that is parallel, use the slope from the original equation. If you are also given a POINT, use point-slope form to find the new equation. 9. Find an equation parallel to y = 2/3 x – 2 that goes through (– 2, 1). 10. Find an equation parallel to y = – 3x – 2 that goes through (3, – 4). 11. Find an equation perpendicular to y = 2/3 x – 2 that goes through (– 2, 1). 12. Find an equation perpendicular to y = – 3x – 2 that goes through (3, – 4). Extra practice p. 283 (32 – 40) and 289 (45 – 47)
  • 2. Write an equation given 2 POINTS. Step 1)Find slope using the slope equation. Step 2)Use the slope and one of the points in the point-slope form equation, follow steps above. 13. (1, 6) and (3, – 4) 14. (– 3, 1) and (5, 5) 15. (2, 4) and (1, – 2) 16. (– 8, – 4) and (4, 2) 17. (12, 2) and (7, 2) Extra practice p. 288 (18 – 35) Fitting a Line to Data Step 1)Make a scatter plot from the data. Step 2)Draw a straight line through the points. Step 3)Choose 2 points on the line and make an equation. 18. A tadpole eventually turns into a frog. There is a relationship between the age of a tadpole and the length of its tail (which eventually disappears). Make a scatter plot of the data and write an equation of the line of best fit. Age (days) Length of Tail (mm) 5 14 2 15 9 3 7 8 12 1 10 3 3 12 6 9 19. Draw a scatter plot and find the equation of the line of best fit. What kind of correlation does this data have? x 2 9 1 8 5 y 11 27 9 23 17 Standard Form --No fractions. Multiply all terms by denominator to get rid of fractions. --x and y on the same side of the equal sign. 20. Write y = 2/5 x – 3 in standard form. 21. Write the equation of m = – 2, (– 4, 3) in standard form. 22. Write – 5x + 11 = ½ y in standard form. Extra practice p. 311 (18 – 44) Does this have a positive correlation? negative correlation? no correlation?
  • 3. Linear Models Given a set of data, graph the line of best fit and find its equation. What does interpolation mean? ______________________________________________ What does extrapolation mean? ______________________________________________ 23. Graph both sets on different grids. Which is a linear model? set 1 x 1 2 3 4 y 12 25 36 48set 2
  • 4. 24. Use the table to do the following: (amount spent on sports supplies each year) Years since 1990 Billions of Dollars 0 31.6 1 32.8 2 ? 3 36.5 4 40.1 5 42.7 a) Write a linear equation to represent the amount spent on sports supplies. b) Estimate the amount spent in 1992. Is this interpolation or extrapolation? c) Estimate the amount spent in 2005. Is this interpolation or extrapolation? Extra practice p. 319 (11 – 34) 25. What is the equation of the line that passes through (7, 4) and (– 5, – 2)? [A] y = ½ x – ½ [B] y = – ½ x + ½ [C] y = – ½ x – ½ [D] y = ½ x + ½ 26. Choose the lines that are perpendicular. Line p that passes through (4, 0) and (6, 4). Line q that passes through (0, 4) and (6, 4). Line r that passes through (0, 4) and (0, 0). [A] line p and line q. [B] line p and line r. [C] line q and line r. [D] none of these. All students in a class were surveyed about how long they studied at home. The table shows hours studied and average test grades. Hours spent studying 0 . 25 .5 . 75 1 1. 5 2 3 5 7 Average grade on test 2 9 32 3 5 38 4 0 47 5 4 6 6 7 9 89 27. Make a scatter plot of the data. 28. Make a line of best fit and give the equation for it. 29. If you study 4 hours, what is your expected test grade? 30. If you want to make a 93, how long should you study? 31. If you were a parent, what advice would you give your child about studying at home for this test? Explain your reasoning. x 1 2 3 4 y 10 5 2 1