SlideShare ist ein Scribd-Unternehmen logo
1 von 13
Downloaden Sie, um offline zu lesen
Exit Capitalization Table (by Security) - Square, Inc. (Approx)
Exit Value                  Max. Variance               Exit Type                        Exit Date         Actuals as of Date                 Option Vesting Acceleration                     Vesting Acceleration %
$3,500,000,000              $1,000,000,000              Sale or Liquidation              12/31/2012        07/25/2012                         Full

Security                 Holder                 Issue              Amount     Quantity    Anti-Dilution    Quantity Quantity    Quantity      Quantity    Net Exercise      Cumlative      Shares Common Stock % of Total        % of
                                                Date              Invested     Issued     Adjustments     Redeemed   Expired    Unvested      Forfeited   Adjustment            Share     Deemed     Equivalents  Equity       Equity
                                                                                                                                                                            Dividends      Issued                               Class
Common Stock             Jack Dorsey          06/17/2009            $79,845 7,984,489                 -           -         -             -           -              -              -    7,984,489      7,984,489      29.8%   63.7%
                         Other Common Holders 11/14/2009            $45,458 4,545,751                 -           -         -             -           -              -              -    4,545,751      4,545,751      17.0%   36.3%
FF Preferred Stock       FF Preferred Holders   06/18/2009             $117    897,600                -           -         -             -           -              -              -     897,600         897,600      3.4%    100.0%
Employee Options         Option   Holders       11/03/2009          $6,327 1,214,850                  -           -         -   (582,115)             -              -              -     632,735         632,735      2.4%    57.2%
                         Option   Holders       03/17/2011        $406,832 1,033,224                  -           -         -   (839,494)             -              -              -     193,730         193,730      0.7%    17.5%
                         Option   Holders       05/10/2011        $126,368 1,768,416                  -           -         - (1,510,522)             -              -              -     257,894         257,894      1.0%    23.3%
                         Option   Holders       09/14/2011        $281,149   343,126                  -           -         -   (321,680)             -              -              -      21,446          21,446      0.1%     1.9%
Series A Preferred Stock Series A Preferred     11/13/2009     $10,099,963 4,670,071                  -           -         -             -           -              -              -    4,670,071      4,670,071      17.4%   100.0%
                         Holder
Series B-1 Preferred     Series B-1 Preferred   01/10/2011 $10,000,002 1,389,333                      -           -         -             -           -              -              -    1,389,333      1,389,333      5.2%    100.0%
Stock                    Holder
Series B-2 Preferred     Series B-2 Preferred   02/03/2011     $25,778,279 2,703,004                  -           -         -             -           -              -              -    2,703,004      2,703,004      10.1%   100.0%
Stock                    Holder
Series C Preferred Stock Series C Preferred     06/24/2011     $96,474,591 1,663,880                  -           -         -             -           -              -              -    1,663,880      1,663,880      6.2%    100.0%
                         Holder
Series D Preferred Stock Rizvi Traverse         07/24/2012 $199,999,922 1,815,870                     -           -         -             -           -              -              -    1,815,870      1,815,870      6.8%    100.0%
                         Management
                                                              $343,298,853 30,029,614                                           (3,253,811)                                             26,775,803     26,775,803      100%
Exit Capitalization Table (by Holder) - Square, Inc. (Approx)
Exit Value                    Max. Variance             Exit Type                        Exit Date         Actuals as of Date                Option Vesting Acceleration                   Vesting Acceleration %
$3,500,000,000                $1,000,000,000            Sale or Liquidation              12/31/2012        07/25/2012                        Full

Holder                           Security                Issue             Amount      Quantity   Anti-Dilution Quantity Quantity Quantity Quantity         Net Exercise   Cumlative      Shares Common Stock         % of     % of
                                                         Date             Invested      Issued    Adjustments Redeemed Expired Unvested Forfeited           Adjustment         Share     Deemed     Equivalents      Total   Equity
                                                                                                                                                                           Dividends      Issued                    Equity    Class
Jack Dorsey                      Common Stock            06/17/2009           $79,845 7,984,489             -          -        -             -         -              -           -    7,984,489     7,984,489     29.8%    63.7%
FF Preferred Holders             FF Preferred Stock      06/18/2009             $117    897,600             -          -        -             -         -              -           -     897,600        897,600      3.4%    100.0%
Option Holders                   Employee   Options      11/03/2009         $6,327 1,214,850                -          -        - (582,115)             -              -           -     632,735        632,735      2.4%    57.2%
                                 Employee   Options      03/17/2011       $406,832 1,033,224                -          -        - (839,494)             -              -           -     193,730        193,730      0.7%    17.5%
                                 Employee   Options      05/10/2011       $126,368 1,768,416                -          -        - (1,510,522)           -              -           -     257,894        257,894      1.0%    23.3%
                                 Employee   Options      09/14/2011       $281,149   343,126                -          -        - (321,680)             -              -           -      21,446         21,446      0.1%     1.9%
Series A Preferred Holder        Series A Preferred Stock 11/13/2009   $10,099,963 4,670,071                -          -        -             -         -              -           -    4,670,071     4,670,071     17.4%    100.0%
Other Common Holders             Common Stock            11/14/2009           $45,458 4,545,751             -          -        -             -         -              -           -    4,545,751     4,545,751     17.0%    36.3%
Series B-1 Preferred Holder      Series B-1 Preferred    01/10/2011 $10,000,002 1,389,333                   -          -        -             -         -              -           -    1,389,333     1,389,333      5.2%    100.0%
                                 Stock
Series B-2 Preferred Holder      Series B-2 Preferred    02/03/2011    $25,778,279 2,703,004                -          -        -             -         -              -           -    2,703,004     2,703,004     10.1%    100.0%
                                 Stock
Series C Preferred Holder        Series C Preferred Stock 06/24/2011   $96,474,591 1,663,880                -          -        -             -         -              -           -    1,663,880     1,663,880      6.2%    100.0%
Rizvi Traverse Management        Series D Preferred Stock 07/24/2012 $199,999,922 1,815,870                 -          -        -             -         -              -           -    1,815,870     1,815,870      6.8%    100.0%
                                                                     $343,298,853 30,029,614                                        (3,253,811)                                        26,775,803    26,775,803      100%
Fully Diluted Capitalization Table (by Security) - Square, Inc. (Approx)
Report as of Date                                                                                                 Actuals as of Date
07/25/2012                                                                                                        07/25/2012

Security                     Holder                                       Amount Invested                                       Shares Deemed Issued                                      Common Stock Equivalents
                                                           Before Report Date On Report Date         Total Before Report Date Anti-Dilution Adjmts On Report Date        Total Before Report Date  % As Of Report Date     %
Common Stock                 Jack Dorsey                              $79,845              -       $79,845          7,984,489                   -               -    7,984,489         7,984,489 26.6%       7,984,489 26.6%
                             Other Common Holders                     $45,458              -       $45,458          4,545,751                   -               -    4,545,751         4,545,751 15.1%       4,545,751 15.1%
FF Preferred Stock           FF Preferred Holders                       $117               -         $117            897,600                    -               -     897,600           897,600 3.0%           897,600   3.0%
Employee Options             Option   Holders                               -              -             -          1,214,850                   -               -    1,214,850         1,214,850   4.0%      1,214,850   4.0%
                             Option   Holders                               -              -             -          1,033,224                   -               -    1,033,224         1,033,224   3.4%      1,033,224   3.4%
                             Option   Holders                               -              -             -          1,768,416                   -               -    1,768,416         1,768,416   5.9%      1,768,416   5.9%
                             Option   Holders                               -              -             -            343,126                   -               -      343,126           343,126   1.1%        343,126   1.1%
Series A Preferred Stock     Series A Preferred Holder            $10,099,963              -   $10,099,963          4,670,071                   -               -    4,670,071         4,670,071 15.6%       4,670,071 15.6%
Series B-1 Preferred Stock   Series B-1 Preferred Holder          $10,000,002              -   $10,000,002          1,389,333                   -               -    1,389,333         1,389,333 4.6%        1,389,333   4.6%
Series B-2 Preferred Stock   Series B-2 Preferred Holder          $25,778,279              -   $25,778,279          2,703,004                   -               -    2,703,004         2,703,004 9.0%        2,703,004   9.0%
Series C Preferred Stock     Series C Preferred Holder            $96,474,591              -   $96,474,591          1,663,880                   -               -    1,663,880         1,663,880 5.5%        1,663,880   5.5%
Series D Preferred Stock     Rizvi Traverse Management           $199,999,922              - $199,999,922           1,815,870                   -               -    1,815,870         1,815,870 6.0%        1,815,870 6.0%
                                                                 $342,478,177             $ $342,478,177           30,029,614                                       30,029,614        30,029,614 100%       30,029,614 100%
Fully Diluted Capitalization Table (by Holder) - Square, Inc. (Approx)
Report as of Date                                                                                                 Actuals as of Date
07/25/2012                                                                                                        07/25/2012

Security                      Holder                                      Amount Invested                                       Shares Deemed Issued                                      Common Stock Equivalents
                                                           Before Report Date On Report Date         Total Before Report Date Anti-Dilution Adjmts On Report Date        Total Before Report Date  % As Of Report Date     %
Jack Dorsey                   Common Stock                            $79,845              -       $79,845          7,984,489                   -               -    7,984,489         7,984,489 26.6%       7,984,489 26.6%
FF Preferred Holders          FF Preferred Stock                        $117               -         $117            897,600                    -               -     897,600           897,600 3.0%           897,600   3.0%
Option Holders                Employee   Options                            -              -             -          1,214,850                   -               -    1,214,850         1,214,850   4.0%      1,214,850   4.0%
                              Employee   Options                            -              -             -          1,033,224                   -               -    1,033,224         1,033,224   3.4%      1,033,224   3.4%
                              Employee   Options                            -              -             -          1,768,416                   -               -    1,768,416         1,768,416   5.9%      1,768,416   5.9%
                              Employee   Options                            -              -             -            343,126                   -               -      343,126           343,126   1.1%        343,126   1.1%
Series A Preferred Holder     Series A Preferred Stock            $10,099,963              -   $10,099,963          4,670,071                   -               -    4,670,071         4,670,071 15.6%       4,670,071 15.6%
Other Common Holders          Common Stock                            $45,458              -       $45,458          4,545,751                   -               -    4,545,751         4,545,751 15.1%       4,545,751 15.1%
Series B-1 Preferred Holder   Series B-1 Preferred Stock          $10,000,002              -   $10,000,002          1,389,333                   -               -    1,389,333         1,389,333 4.6%        1,389,333   4.6%
Series B-2 Preferred Holder   Series B-2 Preferred Stock          $25,778,279              -   $25,778,279          2,703,004                   -               -    2,703,004         2,703,004 9.0%        2,703,004   9.0%
Series C Preferred Holder     Series C Preferred Stock            $96,474,591              -   $96,474,591          1,663,880                   -               -    1,663,880         1,663,880 5.5%        1,663,880   5.5%
Rizvi Traverse Management Series D Preferred Stock               $199,999,922              - $199,999,922           1,815,870                   -               -    1,815,870         1,815,870 6.0%        1,815,870 6.0%
                                                                 $342,478,177             $ $342,478,177           30,029,614                                       30,029,614        30,029,614 100%       30,029,614 100%
Exit Distribution Report (by Security) - Square, Inc. (Approx)
Exit Value                 Max. Variance                 Exit Type                      Exit Date        Actuals as of Date           Option Vesting Acceleration                           Vesting Acceleration %
$3,500,000,000             $1,000,000,000                Sale or Liquidation            12/31/2012       07/25/2012                   Full

Security                   Holder                        Seniority Exercise Yes/No Convert Yes/No Net Share Price                           Distributions                                 Amount Invested         Gain/Loss
                                                                                                  At Issue At Exit Liquidation Preference Pro-Rata Participation           Total     %                           Amount     Multiple
Common Stock               Jack Dorsey                              N/A           N/A                  $0.01 $130.72                    -         $1,043,692,819 $1,043,692,819 29.8%              $79,845 $1,043,612,975    13,071.5
                           Other Common Holders                     N/A           N/A                  $0.01 $130.72                    -           $594,198,035 $594,198,035 17.0%                $45,458 $594,152,578      13,071.5
FF Preferred Stock         FF Preferred Holders                     N/A           N/A                      - $130.72                    -          $117,329,822    $117,329,822 3.4%                 $117    $117,329,706 1,005,500.3
Employee Options           Option   Holders                         Yes           N/A                  $0.01   $130.72                  -            $82,707,901     $82,707,901   2.4%            $6,327     $82,701,573    13,071.5
                           Option   Holders                         Yes           N/A                  $2.10   $130.72                  -            $25,323,360     $25,323,360   0.7%          $406,832     $24,916,528        62.2
                           Option   Holders                         Yes           N/A                  $0.49   $130.72                  -            $33,710,625     $33,710,625   1.0%          $126,368     $33,584,257       266.8
                           Option   Holders                         Yes           N/A                 $13.11   $130.72                  -             $2,803,233      $2,803,233   0.1%          $281,149      $2,522,084        10.0
Series A Preferred Stock   Series A Preferred Holder              1 N/A           Yes                  $2.16 $130.72                    -           $610,448,530    $610,448,530 17.4%         $10,099,963   $600,348,567        60.4
Series B-1 Preferred Stock Series B-1 Preferred Holder            1 N/A           Yes                  $7.20 $130.72                    -          $181,606,722    $181,606,722 5.2%           $10,000,002   $171,606,720       18.2
Series B-2 Preferred Stock Series B-2 Preferred Holder            1 N/A           Yes                  $9.54 $130.72                    -           $353,323,283    $353,323,283 10.1%         $25,778,279   $327,545,004        13.7
Series C Preferred Stock   Series C Preferred Holder              1 N/A           Yes                 $57.98 $130.72                    -           $217,494,145    $217,494,145 6.2%          $96,474,591   $121,019,554         2.3
Series D Preferred Stock   Rizvi Traverse Management              1 N/A           Yes                $110.14 $130.72                    -           $237,361,524 $237,361,524 6.8%            $199,999,922    $37,361,603        1.2
                                                                                                        $203 $1,569                    $          $3,499,999,999 $3,499,999,999 100%          $343,298,853 $3,156,701,149
Exit Distribution Report (by Holder) - Square, Inc. (Approx)
Exit Value                  Max. Variance                Exit Type                      Exit Date        Actuals as of Date           Option Vesting Acceleration                           Vesting Acceleration %
$3,500,000,000              $1,000,000,000               Sale or Liquidation            12/31/2012       07/25/2012                   Full

Security                    Holder                       Seniority Exercise Yes/No Convert Yes/No Net Share Price                           Distributions                                 Amount Invested         Gain/Loss
                                                                                                  At Issue At Exit Liquidation Preference Pro-Rata Participation           Total     %                           Amount     Multiple
Jack Dorsey                 Common Stock                            N/A           N/A                  $0.01 $130.72                    -         $1,043,692,819 $1,043,692,819 29.8%              $79,845 $1,043,612,975    13,071.5
FF Preferred Holders        FF Preferred Stock                      N/A           N/A                      - $130.72                    -          $117,329,822    $117,329,822 3.4%                 $117    $117,329,706 1,005,500.3
Option Holders              Employee   Options                      Yes           N/A                  $0.01   $130.72                  -            $82,707,901     $82,707,901   2.4%            $6,327     $82,701,573    13,071.5
                            Employee   Options                      Yes           N/A                  $2.10   $130.72                  -            $25,323,360     $25,323,360   0.7%          $406,832     $24,916,528        62.2
                            Employee   Options                      Yes           N/A                  $0.49   $130.72                  -            $33,710,625     $33,710,625   1.0%          $126,368     $33,584,257       266.8
                            Employee   Options                      Yes           N/A                 $13.11   $130.72                  -             $2,803,233      $2,803,233   0.1%          $281,149      $2,522,084        10.0
Series A Preferred Holder   Series A Preferred Stock              1 N/A           Yes                  $2.16 $130.72                    -           $610,448,530    $610,448,530 17.4%         $10,099,963   $600,348,567        60.4
Other Common Holders        Common Stock                            N/A           N/A                  $0.01 $130.72                    -           $594,198,035    $594,198,035 17.0%             $45,458   $594,152,578    13,071.5
Series B-1 Preferred Holder Series B-1 Preferred Stock            1 N/A           Yes                  $7.20 $130.72                    -          $181,606,722    $181,606,722 5.2%           $10,000,002   $171,606,720       18.2
Series B-2 Preferred Holder Series B-2 Preferred Stock            1 N/A           Yes                  $9.54 $130.72                    -           $353,323,283    $353,323,283 10.1%         $25,778,279   $327,545,004        13.7
Series C Preferred Holder   Series C Preferred Stock              1 N/A           Yes                 $57.98 $130.72                    -           $217,494,145    $217,494,145 6.2%          $96,474,591   $121,019,554         2.3
Rizvi Traverse Management Series D Preferred Stock                1 N/A           Yes                $110.14 $130.72                    -           $237,361,524    $237,361,524 6.8%         $199,999,922    $37,361,603        1.2
Escrow Analysis Report - Square, Inc. (Approx)
Escrow Type                                             Apportionment Method                                                                                  Escrow Released
No Escrow

Security                 Holder                 Issue                                          Dollar Amounts                                                                     Per Share Amounts
                                                Date         Gross Exit Proceeds Escrow Withheld Cumulative         Net Escrow Net Proceeds       Gross Exit Proceeds Escrow Withheld Cumulative          Net Escrow Net Proceeds
                                                             before Escrow       at Exit Closing     Escrow         Balance    after Escrow       before Escrow       at Exit Closing    Escrow           Balance    after Escrow
                                                                                                     Released                                                                            Released
Common Stock             Jack Dorsey          06/17/2009          $1,043,692,819                 -              -            - $1,043,692,819                 $130.72                 -               -            -        $130.72
                         Other Common Holders 11/14/2009            $594,198,035                 -              -            -   $594,198,035                 $130.72                 -               -            -        $130.72
FF Preferred Stock       FF Preferred Holders   06/18/2009          $117,329,822                 -              -            -    $117,329,822                $130.72                 -               -            -        $130.72
Employee Options         Option   Holders       11/03/2009           $82,707,901                 -              -            -     $82,707,901                $130.71                 -               -            -        $130.71
                         Option   Holders       03/17/2011           $25,323,360                 -              -            -     $25,323,360                $130.71                 -               -            -        $130.71
                         Option   Holders       05/10/2011           $33,710,625                 -              -            -     $33,710,625                $130.72                 -               -            -        $130.72
                         Option   Holders       09/14/2011            $2,803,233                 -              -            -      $2,803,233                $130.71                 -               -            -        $130.71
Series A Preferred Stock Series A Preferred     11/13/2009          $610,448,530                 -              -            -    $610,448,530                $130.72                 -               -            -        $130.72
                         Holder
Series B-1 Preferred     Series B-1 Preferred   01/10/2011          $181,606,722                 -              -            -    $181,606,722                $130.72                 -               -            -        $130.72
Stock                    Holder
Series B-2 Preferred     Series B-2 Preferred   02/03/2011          $353,323,283                 -              -            -    $353,323,283                $130.72                 -               -            -        $130.72
Stock                    Holder
Series C Preferred Stock Series C Preferred     06/24/2011          $217,494,145                 -              -            -    $217,494,145                $130.72                 -               -            -        $130.72
                         Holder
Series D Preferred Stock Rizvi Traverse         07/24/2012          $237,361,524                 -              -            -    $237,361,524                $130.72                 -               -            -        $130.72
                         Management
                                                                  $3,499,999,999                $               $           $    $3,499,999,999                $1,569                 $               $           $          $1,569
Security Terms — Square, Inc. (Approx)

Common Stock
Security Name
Common Stock
FF Preferred Stock

Preferred Stock
Security Name                Convertible To   Conversion     Dividend                                                     Redeemable / Date     Seniority   Liquidation Multiple    Participating   Participation Cap     Anti-Dilution
Series A Preferred Stock     Common Stock     1.0000000000   Non-Cumulative   -   Paid   in   Cash   Annually   8.00000   No                    1                      1.0000000000 No                                  - Broad-Based
Series B-1 Preferred Stock   Common Stock     1.0000000000   Non-Cumulative   -   Paid   in   Cash   Annually   8.00000   No                    1                      1.0000000000 No                                  - Broad-Based
Series B-2 Preferred Stock   Common Stock     1.0000000000   Non-Cumulative   -   Paid   in   Cash   Annually   8.00000   No                    1                      1.0000000000 No                                  - Broad-Based
Series C Preferred Stock     Common Stock     1.0000000000   Non-Cumulative   -   Paid   in   Cash   Annually   8.00000   No                    1                      1.0000000000 No                                  - Broad-Based
Series D Preferred Stock     Common Stock     1.0000000000   Non-Cumulative   -   Paid   in   Cash   Annually   8.00000   No                    1                      1.0000000000 No                                  - Broad-Based

Warrant
Security Name                                                                                                             Convertible To
RSU                                                                                                                       Common Stock

Option
Security Name                                                                                                                  Convertible To
Employee Options                                                                                                               Common Stock
Security Holders — Square, Inc. (Approx)
Holder                           Firm   Holder Type   Contact Person   Contact Details   Email   Cost of Capital
FF Preferred Holders                    Founder                                                      10.00000%
Jack Dorsey                             Founder                                                      10.00000%
Option Holders                          Employee                                                     10.00000%
Other Common Holders                    Other                                                        10.00000%
Rizvi Traverse Management               PE Fund                                                      10.00000%
Series A Preferred Holder               VC Fund                                                      10.00000%
Series B-1 Preferred Holder             VC Fund                                                      10.00000%
Series B-2 Preferred Holder             VC Fund                                                      10.00000%
Series C Preferred Holder               VC Fund                                                      10.00000%
Security Issuances — Square, Inc. (Approx)

Common Stock
Security                                   Holder                                             Issue Date                                    Shares Issued                                          Share Price Before Discounts
Common Stock                               Jack Dorsey                                        06/17/2009                                        7,984,489                                                                  $0.01
FF Preferred Stock                         FF Preferred Holders                               06/18/2009                                          897,600                                                                      -
Common Stock                               Other Common Holders                               11/14/2009                                        4,545,751                                                                  $0.01

Preferred Stock
Security                                  Holder                                 Issue Date                    Shares Issued                   Share Price Before Discounts                       Purchase Discount Percentage
Series A Preferred Stock                  Series A Preferred Holder              11/13/2009                        4,670,071                                           $2.16                                                 -
Series B-1 Preferred Stock                Series B-1 Preferred Holder            01/10/2011                        1,389,333                                           $7.20                                                 -
Series B-2 Preferred Stock                Series B-2 Preferred Holder            02/03/2011                        2,703,004                                           $9.54                                                 -
Series C Preferred Stock                  Series C Preferred Holder              06/24/2011                        1,663,880                                          $57.98                                                 -
Series D Preferred Stock                  Rizvi Traverse Management              07/24/2012                        1,815,870                                         $110.14                                                 -

Warrant
Security               Holder            Issue Date                                Shares Issued                      Exercise Price Expiration Date                    Net (Cashless) Exercise

Option
Security                Holder            Issue Date          Shares Issued   Exercise Price Expiration Date      Vesting Start Date             Vesting Cliff Months       Fully Vested Months Net (Cashless) Exercise
Employee   Options      Option Holders    11/03/2009              1,214,850            $0.01 11/03/2020           11/03/2010                                       -                        48 No
Employee   Options      Option Holders    03/17/2011              1,033,224            $2.10 03/17/2021           03/17/2012                                       -                        48 No
Employee   Options      Option Holders    05/10/2011              1,768,416            $0.49 05/10/2021           05/10/2012                                       -                        48 No
Employee   Options      Option Holders    09/14/2011                343,126           $13.11 02/14/2021           09/14/2012                                       -                        48 No
VC Experts.com, Inc. Disclaimer

The information contained herein is from sources deemed reliable; it does not, however, purport to constitute
investment advice nor does VC Experts represent that it contains all information concerning the identified
Company deemed necessary or appropriate for investment decisions. VC Experts is neither a broker/dealer nor
investment adviser and has no financial interest in the Company analyzed nor in the sale or purchase of any of its
securities. The information and data are for reference purposes only and no implied or expressed warranties or
assurances as to its accuracy or completeness are furnished by VC Experts. Estimates of valuation are, as
indicated, estimates based on such information as we found available, the completeness of which is neither
represented or guaranteed; users for any purpose are cautioned and required to undertake and perform their own
investigations and due diligence. To the extent that the information incorporates content from specified sources
of financial information, VC Experts disclaims any responsibility for the accuracy or completeness of such content.

Weitere ähnliche Inhalte

Was ist angesagt?

chubb 8918 Supplementary Investor Information
chubb 8918 Supplementary Investor Informationchubb 8918 Supplementary Investor Information
chubb 8918 Supplementary Investor Information
finance18
 
Progressive 2006review
 Progressive 2006review Progressive 2006review
Progressive 2006review
finance18
 
regions SUPP 2Q 07.FINAL-rev
regions SUPP 2Q 07.FINAL-revregions SUPP 2Q 07.FINAL-rev
regions SUPP 2Q 07.FINAL-rev
finance25
 
conoco phillips 2005Third Quarter
conoco phillips 2005Third Quarterconoco phillips 2005Third Quarter
conoco phillips 2005Third Quarter
finance1
 
u.s.bancorp 2000 Audited Financial Statements - Firstar Corporation
u.s.bancorp 2000 Audited Financial Statements - Firstar Corporation u.s.bancorp 2000 Audited Financial Statements - Firstar Corporation
u.s.bancorp 2000 Audited Financial Statements - Firstar Corporation
finance13
 
Progressive_ 2004 review
Progressive_ 2004 reviewProgressive_ 2004 review
Progressive_ 2004 review
finance18
 
Blue Chip Stock Club
Blue Chip Stock ClubBlue Chip Stock Club
Blue Chip Stock Club
vmartinelli3
 

Was ist angesagt? (10)

Fluor 03 Annual Report
Fluor 03 Annual ReportFluor 03 Annual Report
Fluor 03 Annual Report
 
chubb 8918 Supplementary Investor Information
chubb 8918 Supplementary Investor Informationchubb 8918 Supplementary Investor Information
chubb 8918 Supplementary Investor Information
 
Progressive 2006review
 Progressive 2006review Progressive 2006review
Progressive 2006review
 
regions SUPP 2Q 07.FINAL-rev
regions SUPP 2Q 07.FINAL-revregions SUPP 2Q 07.FINAL-rev
regions SUPP 2Q 07.FINAL-rev
 
conoco phillips 2005Third Quarter
conoco phillips 2005Third Quarterconoco phillips 2005Third Quarter
conoco phillips 2005Third Quarter
 
credit-suisse supplements
credit-suisse supplementscredit-suisse supplements
credit-suisse supplements
 
u.s.bancorp 2000 Audited Financial Statements - Firstar Corporation
u.s.bancorp 2000 Audited Financial Statements - Firstar Corporation u.s.bancorp 2000 Audited Financial Statements - Firstar Corporation
u.s.bancorp 2000 Audited Financial Statements - Firstar Corporation
 
Blue Chips
Blue ChipsBlue Chips
Blue Chips
 
Progressive_ 2004 review
Progressive_ 2004 reviewProgressive_ 2004 review
Progressive_ 2004 review
 
Blue Chip Stock Club
Blue Chip Stock ClubBlue Chip Stock Club
Blue Chip Stock Club
 

Ähnlich wie UPDATED Square, Inc: Capital Structure, Valuation, & Exit Analysis

Blue Chip Stock Analysis
Blue Chip Stock AnalysisBlue Chip Stock Analysis
Blue Chip Stock Analysis
jjr748
 
coventry health care annual reports 2006
coventry health care annual reports 2006coventry health care annual reports 2006
coventry health care annual reports 2006
finance27
 
crown holdings ccsSS_prn
  crown holdings ccsSS_prn  crown holdings ccsSS_prn
crown holdings ccsSS_prn
finance30
 
crown holdings ccsSS_prn
  crown holdings ccsSS_prn  crown holdings ccsSS_prn
crown holdings ccsSS_prn
finance30
 
Blue Chip Stock Club
Blue Chip Stock ClubBlue Chip Stock Club
Blue Chip Stock Club
Scoop
 
Blue Chip Stock Club
Blue Chip Stock ClubBlue Chip Stock Club
Blue Chip Stock Club
cjp819
 
conoco phillips 2006Third Quarter
conoco phillips 2006Third Quarterconoco phillips 2006Third Quarter
conoco phillips 2006Third Quarter
finance1
 
Progressive loss report_0608_appendix
Progressive loss report_0608_appendixProgressive loss report_0608_appendix
Progressive loss report_0608_appendix
finance18
 
SLM CorpSupplemental3Qtr08BOW71210BOW004_BITS_N
SLM CorpSupplemental3Qtr08BOW71210BOW004_BITS_NSLM CorpSupplemental3Qtr08BOW71210BOW004_BITS_N
SLM CorpSupplemental3Qtr08BOW71210BOW004_BITS_N
finance42
 
chubb 8922 Supplementary Investor Information
chubb 8922 Supplementary Investor Informationchubb 8922 Supplementary Investor Information
chubb 8922 Supplementary Investor Information
finance18
 
2009 Q2 md&a & interim financial statements
2009 Q2 md&a & interim financial statements2009 Q2 md&a & interim financial statements
2009 Q2 md&a & interim financial statements
Prophecy Corp
 
gannett 08GCIAnnualReport
gannett 08GCIAnnualReportgannett 08GCIAnnualReport
gannett 08GCIAnnualReport
finance30
 
gannett 08GCIAnnualReport
gannett 08GCIAnnualReportgannett 08GCIAnnualReport
gannett 08GCIAnnualReport
finance30
 
tjx Annual Reports1999
tjx Annual Reports1999tjx Annual Reports1999
tjx Annual Reports1999
finance14
 

Ähnlich wie UPDATED Square, Inc: Capital Structure, Valuation, & Exit Analysis (20)

Q1 2009 Earning Report of Potlatch Corp
Q1 2009 Earning Report of Potlatch CorpQ1 2009 Earning Report of Potlatch Corp
Q1 2009 Earning Report of Potlatch Corp
 
Blue Chip Stock Analysis
Blue Chip Stock AnalysisBlue Chip Stock Analysis
Blue Chip Stock Analysis
 
coventry health care annual reports 2006
coventry health care annual reports 2006coventry health care annual reports 2006
coventry health care annual reports 2006
 
Washington Federal Investor Presentation
Washington Federal Investor PresentationWashington Federal Investor Presentation
Washington Federal Investor Presentation
 
ccsSS_prn
ccsSS_prnccsSS_prn
ccsSS_prn
 
crown holdings ccsSS_prn
  crown holdings ccsSS_prn  crown holdings ccsSS_prn
crown holdings ccsSS_prn
 
crown holdings ccsSS_prn
  crown holdings ccsSS_prn  crown holdings ccsSS_prn
crown holdings ccsSS_prn
 
ccsSS_prn
ccsSS_prnccsSS_prn
ccsSS_prn
 
Blue Chip Stock Club
Blue Chip Stock ClubBlue Chip Stock Club
Blue Chip Stock Club
 
Blue Chip Stock Club
Blue Chip Stock ClubBlue Chip Stock Club
Blue Chip Stock Club
 
Comair - Interim Report Dec 2009 Final
Comair - Interim Report Dec 2009 FinalComair - Interim Report Dec 2009 Final
Comair - Interim Report Dec 2009 Final
 
conoco phillips 2006Third Quarter
conoco phillips 2006Third Quarterconoco phillips 2006Third Quarter
conoco phillips 2006Third Quarter
 
Progressive loss report_0608_appendix
Progressive loss report_0608_appendixProgressive loss report_0608_appendix
Progressive loss report_0608_appendix
 
Silver river manufacturing company
Silver river manufacturing companySilver river manufacturing company
Silver river manufacturing company
 
SLM CorpSupplemental3Qtr08BOW71210BOW004_BITS_N
SLM CorpSupplemental3Qtr08BOW71210BOW004_BITS_NSLM CorpSupplemental3Qtr08BOW71210BOW004_BITS_N
SLM CorpSupplemental3Qtr08BOW71210BOW004_BITS_N
 
chubb 8922 Supplementary Investor Information
chubb 8922 Supplementary Investor Informationchubb 8922 Supplementary Investor Information
chubb 8922 Supplementary Investor Information
 
2009 Q2 md&a & interim financial statements
2009 Q2 md&a & interim financial statements2009 Q2 md&a & interim financial statements
2009 Q2 md&a & interim financial statements
 
gannett 08GCIAnnualReport
gannett 08GCIAnnualReportgannett 08GCIAnnualReport
gannett 08GCIAnnualReport
 
gannett 08GCIAnnualReport
gannett 08GCIAnnualReportgannett 08GCIAnnualReport
gannett 08GCIAnnualReport
 
tjx Annual Reports1999
tjx Annual Reports1999tjx Annual Reports1999
tjx Annual Reports1999
 

Mehr von VC Experts, Inc.

Mehr von VC Experts, Inc. (6)

Chapter 2.2: Angel Networks: Frequently Asked Questions?
Chapter 2.2: Angel Networks: Frequently Asked Questions? Chapter 2.2: Angel Networks: Frequently Asked Questions?
Chapter 2.2: Angel Networks: Frequently Asked Questions?
 
Chapter 1.3: How Venture Capitalists Talk. Learn VC lingo!
Chapter 1.3: How Venture Capitalists Talk. Learn VC lingo! Chapter 1.3: How Venture Capitalists Talk. Learn VC lingo!
Chapter 1.3: How Venture Capitalists Talk. Learn VC lingo!
 
Twitter’s Share Price Analysis
Twitter’s Share Price AnalysisTwitter’s Share Price Analysis
Twitter’s Share Price Analysis
 
TaskRabbit, Inc. - Venture Capital Financing Deal Terms & Valuations
TaskRabbit, Inc. - Venture Capital Financing Deal Terms & ValuationsTaskRabbit, Inc. - Venture Capital Financing Deal Terms & Valuations
TaskRabbit, Inc. - Venture Capital Financing Deal Terms & Valuations
 
Sebacia Inc.- Startup Company Venture Capital Financing Deal Terms & Valuations
Sebacia Inc.- Startup Company Venture Capital Financing Deal Terms & ValuationsSebacia Inc.- Startup Company Venture Capital Financing Deal Terms & Valuations
Sebacia Inc.- Startup Company Venture Capital Financing Deal Terms & Valuations
 
Marketo, Inc. - Venture Capital Financing Deal Terms & Valuations
Marketo, Inc. - Venture Capital Financing Deal Terms & ValuationsMarketo, Inc. - Venture Capital Financing Deal Terms & Valuations
Marketo, Inc. - Venture Capital Financing Deal Terms & Valuations
 

Kürzlich hochgeladen

( Jasmin ) Top VIP Escorts Service Dindigul 💧 7737669865 💧 by Dindigul Call G...
( Jasmin ) Top VIP Escorts Service Dindigul 💧 7737669865 💧 by Dindigul Call G...( Jasmin ) Top VIP Escorts Service Dindigul 💧 7737669865 💧 by Dindigul Call G...
( Jasmin ) Top VIP Escorts Service Dindigul 💧 7737669865 💧 by Dindigul Call G...
dipikadinghjn ( Why You Choose Us? ) Escorts
 
VIP Call Girl in Mira Road 💧 9920725232 ( Call Me ) Get A New Crush Everyday ...
VIP Call Girl in Mira Road 💧 9920725232 ( Call Me ) Get A New Crush Everyday ...VIP Call Girl in Mira Road 💧 9920725232 ( Call Me ) Get A New Crush Everyday ...
VIP Call Girl in Mira Road 💧 9920725232 ( Call Me ) Get A New Crush Everyday ...
dipikadinghjn ( Why You Choose Us? ) Escorts
 
VIP Independent Call Girls in Mumbai 🌹 9920725232 ( Call Me ) Mumbai Escorts ...
VIP Independent Call Girls in Mumbai 🌹 9920725232 ( Call Me ) Mumbai Escorts ...VIP Independent Call Girls in Mumbai 🌹 9920725232 ( Call Me ) Mumbai Escorts ...
VIP Independent Call Girls in Mumbai 🌹 9920725232 ( Call Me ) Mumbai Escorts ...
dipikadinghjn ( Why You Choose Us? ) Escorts
 
VIP Call Girl in Mumbai 💧 9920725232 ( Call Me ) Get A New Crush Everyday Wit...
VIP Call Girl in Mumbai 💧 9920725232 ( Call Me ) Get A New Crush Everyday Wit...VIP Call Girl in Mumbai 💧 9920725232 ( Call Me ) Get A New Crush Everyday Wit...
VIP Call Girl in Mumbai 💧 9920725232 ( Call Me ) Get A New Crush Everyday Wit...
dipikadinghjn ( Why You Choose Us? ) Escorts
 
VIP Call Girl Service Andheri West ⚡ 9920725232 What It Takes To Be The Best ...
VIP Call Girl Service Andheri West ⚡ 9920725232 What It Takes To Be The Best ...VIP Call Girl Service Andheri West ⚡ 9920725232 What It Takes To Be The Best ...
VIP Call Girl Service Andheri West ⚡ 9920725232 What It Takes To Be The Best ...
dipikadinghjn ( Why You Choose Us? ) Escorts
 

Kürzlich hochgeladen (20)

Solution Manual for Principles of Corporate Finance 14th Edition by Richard B...
Solution Manual for Principles of Corporate Finance 14th Edition by Richard B...Solution Manual for Principles of Corporate Finance 14th Edition by Richard B...
Solution Manual for Principles of Corporate Finance 14th Edition by Richard B...
 
Mira Road Awesome 100% Independent Call Girls NUmber-9833754194-Dahisar Inter...
Mira Road Awesome 100% Independent Call Girls NUmber-9833754194-Dahisar Inter...Mira Road Awesome 100% Independent Call Girls NUmber-9833754194-Dahisar Inter...
Mira Road Awesome 100% Independent Call Girls NUmber-9833754194-Dahisar Inter...
 
( Jasmin ) Top VIP Escorts Service Dindigul 💧 7737669865 💧 by Dindigul Call G...
( Jasmin ) Top VIP Escorts Service Dindigul 💧 7737669865 💧 by Dindigul Call G...( Jasmin ) Top VIP Escorts Service Dindigul 💧 7737669865 💧 by Dindigul Call G...
( Jasmin ) Top VIP Escorts Service Dindigul 💧 7737669865 💧 by Dindigul Call G...
 
The Economic History of the U.S. Lecture 30.pdf
The Economic History of the U.S. Lecture 30.pdfThe Economic History of the U.S. Lecture 30.pdf
The Economic History of the U.S. Lecture 30.pdf
 
Top Rated Pune Call Girls Dighi ⟟ 6297143586 ⟟ Call Me For Genuine Sex Servi...
Top Rated  Pune Call Girls Dighi ⟟ 6297143586 ⟟ Call Me For Genuine Sex Servi...Top Rated  Pune Call Girls Dighi ⟟ 6297143586 ⟟ Call Me For Genuine Sex Servi...
Top Rated Pune Call Girls Dighi ⟟ 6297143586 ⟟ Call Me For Genuine Sex Servi...
 
The Economic History of the U.S. Lecture 19.pdf
The Economic History of the U.S. Lecture 19.pdfThe Economic History of the U.S. Lecture 19.pdf
The Economic History of the U.S. Lecture 19.pdf
 
VIP Call Girl in Mira Road 💧 9920725232 ( Call Me ) Get A New Crush Everyday ...
VIP Call Girl in Mira Road 💧 9920725232 ( Call Me ) Get A New Crush Everyday ...VIP Call Girl in Mira Road 💧 9920725232 ( Call Me ) Get A New Crush Everyday ...
VIP Call Girl in Mira Road 💧 9920725232 ( Call Me ) Get A New Crush Everyday ...
 
Booking open Available Pune Call Girls Wadgaon Sheri 6297143586 Call Hot Ind...
Booking open Available Pune Call Girls Wadgaon Sheri  6297143586 Call Hot Ind...Booking open Available Pune Call Girls Wadgaon Sheri  6297143586 Call Hot Ind...
Booking open Available Pune Call Girls Wadgaon Sheri 6297143586 Call Hot Ind...
 
VIP Independent Call Girls in Mumbai 🌹 9920725232 ( Call Me ) Mumbai Escorts ...
VIP Independent Call Girls in Mumbai 🌹 9920725232 ( Call Me ) Mumbai Escorts ...VIP Independent Call Girls in Mumbai 🌹 9920725232 ( Call Me ) Mumbai Escorts ...
VIP Independent Call Girls in Mumbai 🌹 9920725232 ( Call Me ) Mumbai Escorts ...
 
The Economic History of the U.S. Lecture 18.pdf
The Economic History of the U.S. Lecture 18.pdfThe Economic History of the U.S. Lecture 18.pdf
The Economic History of the U.S. Lecture 18.pdf
 
The Economic History of the U.S. Lecture 23.pdf
The Economic History of the U.S. Lecture 23.pdfThe Economic History of the U.S. Lecture 23.pdf
The Economic History of the U.S. Lecture 23.pdf
 
VVIP Pune Call Girls Katraj (7001035870) Pune Escorts Nearby with Complete Sa...
VVIP Pune Call Girls Katraj (7001035870) Pune Escorts Nearby with Complete Sa...VVIP Pune Call Girls Katraj (7001035870) Pune Escorts Nearby with Complete Sa...
VVIP Pune Call Girls Katraj (7001035870) Pune Escorts Nearby with Complete Sa...
 
00_Main ppt_MeetupDORA&CyberSecurity.pptx
00_Main ppt_MeetupDORA&CyberSecurity.pptx00_Main ppt_MeetupDORA&CyberSecurity.pptx
00_Main ppt_MeetupDORA&CyberSecurity.pptx
 
The Economic History of the U.S. Lecture 20.pdf
The Economic History of the U.S. Lecture 20.pdfThe Economic History of the U.S. Lecture 20.pdf
The Economic History of the U.S. Lecture 20.pdf
 
VIP Call Girl in Mumbai 💧 9920725232 ( Call Me ) Get A New Crush Everyday Wit...
VIP Call Girl in Mumbai 💧 9920725232 ( Call Me ) Get A New Crush Everyday Wit...VIP Call Girl in Mumbai 💧 9920725232 ( Call Me ) Get A New Crush Everyday Wit...
VIP Call Girl in Mumbai 💧 9920725232 ( Call Me ) Get A New Crush Everyday Wit...
 
Solution Manual for Financial Accounting, 11th Edition by Robert Libby, Patri...
Solution Manual for Financial Accounting, 11th Edition by Robert Libby, Patri...Solution Manual for Financial Accounting, 11th Edition by Robert Libby, Patri...
Solution Manual for Financial Accounting, 11th Edition by Robert Libby, Patri...
 
Kharghar Blowjob Housewife Call Girls NUmber-9833754194-CBD Belapur Internati...
Kharghar Blowjob Housewife Call Girls NUmber-9833754194-CBD Belapur Internati...Kharghar Blowjob Housewife Call Girls NUmber-9833754194-CBD Belapur Internati...
Kharghar Blowjob Housewife Call Girls NUmber-9833754194-CBD Belapur Internati...
 
VIP Call Girl Service Andheri West ⚡ 9920725232 What It Takes To Be The Best ...
VIP Call Girl Service Andheri West ⚡ 9920725232 What It Takes To Be The Best ...VIP Call Girl Service Andheri West ⚡ 9920725232 What It Takes To Be The Best ...
VIP Call Girl Service Andheri West ⚡ 9920725232 What It Takes To Be The Best ...
 
06_Joeri Van Speybroek_Dell_MeetupDora&Cybersecurity.pdf
06_Joeri Van Speybroek_Dell_MeetupDora&Cybersecurity.pdf06_Joeri Van Speybroek_Dell_MeetupDora&Cybersecurity.pdf
06_Joeri Van Speybroek_Dell_MeetupDora&Cybersecurity.pdf
 
Booking open Available Pune Call Girls Talegaon Dabhade 6297143586 Call Hot ...
Booking open Available Pune Call Girls Talegaon Dabhade  6297143586 Call Hot ...Booking open Available Pune Call Girls Talegaon Dabhade  6297143586 Call Hot ...
Booking open Available Pune Call Girls Talegaon Dabhade 6297143586 Call Hot ...
 

UPDATED Square, Inc: Capital Structure, Valuation, & Exit Analysis

  • 1. Exit Capitalization Table (by Security) - Square, Inc. (Approx) Exit Value Max. Variance Exit Type Exit Date Actuals as of Date Option Vesting Acceleration Vesting Acceleration % $3,500,000,000 $1,000,000,000 Sale or Liquidation 12/31/2012 07/25/2012 Full Security Holder Issue Amount Quantity Anti-Dilution Quantity Quantity Quantity Quantity Net Exercise Cumlative Shares Common Stock % of Total % of Date Invested Issued Adjustments Redeemed Expired Unvested Forfeited Adjustment Share Deemed Equivalents Equity Equity Dividends Issued Class Common Stock Jack Dorsey 06/17/2009 $79,845 7,984,489 - - - - - - - 7,984,489 7,984,489 29.8% 63.7% Other Common Holders 11/14/2009 $45,458 4,545,751 - - - - - - - 4,545,751 4,545,751 17.0% 36.3% FF Preferred Stock FF Preferred Holders 06/18/2009 $117 897,600 - - - - - - - 897,600 897,600 3.4% 100.0% Employee Options Option Holders 11/03/2009 $6,327 1,214,850 - - - (582,115) - - - 632,735 632,735 2.4% 57.2% Option Holders 03/17/2011 $406,832 1,033,224 - - - (839,494) - - - 193,730 193,730 0.7% 17.5% Option Holders 05/10/2011 $126,368 1,768,416 - - - (1,510,522) - - - 257,894 257,894 1.0% 23.3% Option Holders 09/14/2011 $281,149 343,126 - - - (321,680) - - - 21,446 21,446 0.1% 1.9% Series A Preferred Stock Series A Preferred 11/13/2009 $10,099,963 4,670,071 - - - - - - - 4,670,071 4,670,071 17.4% 100.0% Holder Series B-1 Preferred Series B-1 Preferred 01/10/2011 $10,000,002 1,389,333 - - - - - - - 1,389,333 1,389,333 5.2% 100.0% Stock Holder Series B-2 Preferred Series B-2 Preferred 02/03/2011 $25,778,279 2,703,004 - - - - - - - 2,703,004 2,703,004 10.1% 100.0% Stock Holder Series C Preferred Stock Series C Preferred 06/24/2011 $96,474,591 1,663,880 - - - - - - - 1,663,880 1,663,880 6.2% 100.0% Holder Series D Preferred Stock Rizvi Traverse 07/24/2012 $199,999,922 1,815,870 - - - - - - - 1,815,870 1,815,870 6.8% 100.0% Management $343,298,853 30,029,614 (3,253,811) 26,775,803 26,775,803 100%
  • 2. Exit Capitalization Table (by Holder) - Square, Inc. (Approx) Exit Value Max. Variance Exit Type Exit Date Actuals as of Date Option Vesting Acceleration Vesting Acceleration % $3,500,000,000 $1,000,000,000 Sale or Liquidation 12/31/2012 07/25/2012 Full Holder Security Issue Amount Quantity Anti-Dilution Quantity Quantity Quantity Quantity Net Exercise Cumlative Shares Common Stock % of % of Date Invested Issued Adjustments Redeemed Expired Unvested Forfeited Adjustment Share Deemed Equivalents Total Equity Dividends Issued Equity Class Jack Dorsey Common Stock 06/17/2009 $79,845 7,984,489 - - - - - - - 7,984,489 7,984,489 29.8% 63.7% FF Preferred Holders FF Preferred Stock 06/18/2009 $117 897,600 - - - - - - - 897,600 897,600 3.4% 100.0% Option Holders Employee Options 11/03/2009 $6,327 1,214,850 - - - (582,115) - - - 632,735 632,735 2.4% 57.2% Employee Options 03/17/2011 $406,832 1,033,224 - - - (839,494) - - - 193,730 193,730 0.7% 17.5% Employee Options 05/10/2011 $126,368 1,768,416 - - - (1,510,522) - - - 257,894 257,894 1.0% 23.3% Employee Options 09/14/2011 $281,149 343,126 - - - (321,680) - - - 21,446 21,446 0.1% 1.9% Series A Preferred Holder Series A Preferred Stock 11/13/2009 $10,099,963 4,670,071 - - - - - - - 4,670,071 4,670,071 17.4% 100.0% Other Common Holders Common Stock 11/14/2009 $45,458 4,545,751 - - - - - - - 4,545,751 4,545,751 17.0% 36.3% Series B-1 Preferred Holder Series B-1 Preferred 01/10/2011 $10,000,002 1,389,333 - - - - - - - 1,389,333 1,389,333 5.2% 100.0% Stock Series B-2 Preferred Holder Series B-2 Preferred 02/03/2011 $25,778,279 2,703,004 - - - - - - - 2,703,004 2,703,004 10.1% 100.0% Stock Series C Preferred Holder Series C Preferred Stock 06/24/2011 $96,474,591 1,663,880 - - - - - - - 1,663,880 1,663,880 6.2% 100.0% Rizvi Traverse Management Series D Preferred Stock 07/24/2012 $199,999,922 1,815,870 - - - - - - - 1,815,870 1,815,870 6.8% 100.0% $343,298,853 30,029,614 (3,253,811) 26,775,803 26,775,803 100%
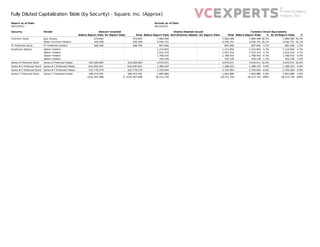
  • 3. Fully Diluted Capitalization Table (by Security) - Square, Inc. (Approx) Report as of Date Actuals as of Date 07/25/2012 07/25/2012 Security Holder Amount Invested Shares Deemed Issued Common Stock Equivalents Before Report Date On Report Date Total Before Report Date Anti-Dilution Adjmts On Report Date Total Before Report Date % As Of Report Date % Common Stock Jack Dorsey $79,845 - $79,845 7,984,489 - - 7,984,489 7,984,489 26.6% 7,984,489 26.6% Other Common Holders $45,458 - $45,458 4,545,751 - - 4,545,751 4,545,751 15.1% 4,545,751 15.1% FF Preferred Stock FF Preferred Holders $117 - $117 897,600 - - 897,600 897,600 3.0% 897,600 3.0% Employee Options Option Holders - - - 1,214,850 - - 1,214,850 1,214,850 4.0% 1,214,850 4.0% Option Holders - - - 1,033,224 - - 1,033,224 1,033,224 3.4% 1,033,224 3.4% Option Holders - - - 1,768,416 - - 1,768,416 1,768,416 5.9% 1,768,416 5.9% Option Holders - - - 343,126 - - 343,126 343,126 1.1% 343,126 1.1% Series A Preferred Stock Series A Preferred Holder $10,099,963 - $10,099,963 4,670,071 - - 4,670,071 4,670,071 15.6% 4,670,071 15.6% Series B-1 Preferred Stock Series B-1 Preferred Holder $10,000,002 - $10,000,002 1,389,333 - - 1,389,333 1,389,333 4.6% 1,389,333 4.6% Series B-2 Preferred Stock Series B-2 Preferred Holder $25,778,279 - $25,778,279 2,703,004 - - 2,703,004 2,703,004 9.0% 2,703,004 9.0% Series C Preferred Stock Series C Preferred Holder $96,474,591 - $96,474,591 1,663,880 - - 1,663,880 1,663,880 5.5% 1,663,880 5.5% Series D Preferred Stock Rizvi Traverse Management $199,999,922 - $199,999,922 1,815,870 - - 1,815,870 1,815,870 6.0% 1,815,870 6.0% $342,478,177 $ $342,478,177 30,029,614 30,029,614 30,029,614 100% 30,029,614 100%
  • 4. Fully Diluted Capitalization Table (by Holder) - Square, Inc. (Approx) Report as of Date Actuals as of Date 07/25/2012 07/25/2012 Security Holder Amount Invested Shares Deemed Issued Common Stock Equivalents Before Report Date On Report Date Total Before Report Date Anti-Dilution Adjmts On Report Date Total Before Report Date % As Of Report Date % Jack Dorsey Common Stock $79,845 - $79,845 7,984,489 - - 7,984,489 7,984,489 26.6% 7,984,489 26.6% FF Preferred Holders FF Preferred Stock $117 - $117 897,600 - - 897,600 897,600 3.0% 897,600 3.0% Option Holders Employee Options - - - 1,214,850 - - 1,214,850 1,214,850 4.0% 1,214,850 4.0% Employee Options - - - 1,033,224 - - 1,033,224 1,033,224 3.4% 1,033,224 3.4% Employee Options - - - 1,768,416 - - 1,768,416 1,768,416 5.9% 1,768,416 5.9% Employee Options - - - 343,126 - - 343,126 343,126 1.1% 343,126 1.1% Series A Preferred Holder Series A Preferred Stock $10,099,963 - $10,099,963 4,670,071 - - 4,670,071 4,670,071 15.6% 4,670,071 15.6% Other Common Holders Common Stock $45,458 - $45,458 4,545,751 - - 4,545,751 4,545,751 15.1% 4,545,751 15.1% Series B-1 Preferred Holder Series B-1 Preferred Stock $10,000,002 - $10,000,002 1,389,333 - - 1,389,333 1,389,333 4.6% 1,389,333 4.6% Series B-2 Preferred Holder Series B-2 Preferred Stock $25,778,279 - $25,778,279 2,703,004 - - 2,703,004 2,703,004 9.0% 2,703,004 9.0% Series C Preferred Holder Series C Preferred Stock $96,474,591 - $96,474,591 1,663,880 - - 1,663,880 1,663,880 5.5% 1,663,880 5.5% Rizvi Traverse Management Series D Preferred Stock $199,999,922 - $199,999,922 1,815,870 - - 1,815,870 1,815,870 6.0% 1,815,870 6.0% $342,478,177 $ $342,478,177 30,029,614 30,029,614 30,029,614 100% 30,029,614 100%
  • 5. Exit Distribution Report (by Security) - Square, Inc. (Approx) Exit Value Max. Variance Exit Type Exit Date Actuals as of Date Option Vesting Acceleration Vesting Acceleration % $3,500,000,000 $1,000,000,000 Sale or Liquidation 12/31/2012 07/25/2012 Full Security Holder Seniority Exercise Yes/No Convert Yes/No Net Share Price Distributions Amount Invested Gain/Loss At Issue At Exit Liquidation Preference Pro-Rata Participation Total % Amount Multiple Common Stock Jack Dorsey N/A N/A $0.01 $130.72 - $1,043,692,819 $1,043,692,819 29.8% $79,845 $1,043,612,975 13,071.5 Other Common Holders N/A N/A $0.01 $130.72 - $594,198,035 $594,198,035 17.0% $45,458 $594,152,578 13,071.5 FF Preferred Stock FF Preferred Holders N/A N/A - $130.72 - $117,329,822 $117,329,822 3.4% $117 $117,329,706 1,005,500.3 Employee Options Option Holders Yes N/A $0.01 $130.72 - $82,707,901 $82,707,901 2.4% $6,327 $82,701,573 13,071.5 Option Holders Yes N/A $2.10 $130.72 - $25,323,360 $25,323,360 0.7% $406,832 $24,916,528 62.2 Option Holders Yes N/A $0.49 $130.72 - $33,710,625 $33,710,625 1.0% $126,368 $33,584,257 266.8 Option Holders Yes N/A $13.11 $130.72 - $2,803,233 $2,803,233 0.1% $281,149 $2,522,084 10.0 Series A Preferred Stock Series A Preferred Holder 1 N/A Yes $2.16 $130.72 - $610,448,530 $610,448,530 17.4% $10,099,963 $600,348,567 60.4 Series B-1 Preferred Stock Series B-1 Preferred Holder 1 N/A Yes $7.20 $130.72 - $181,606,722 $181,606,722 5.2% $10,000,002 $171,606,720 18.2 Series B-2 Preferred Stock Series B-2 Preferred Holder 1 N/A Yes $9.54 $130.72 - $353,323,283 $353,323,283 10.1% $25,778,279 $327,545,004 13.7 Series C Preferred Stock Series C Preferred Holder 1 N/A Yes $57.98 $130.72 - $217,494,145 $217,494,145 6.2% $96,474,591 $121,019,554 2.3 Series D Preferred Stock Rizvi Traverse Management 1 N/A Yes $110.14 $130.72 - $237,361,524 $237,361,524 6.8% $199,999,922 $37,361,603 1.2 $203 $1,569 $ $3,499,999,999 $3,499,999,999 100% $343,298,853 $3,156,701,149
  • 6.
  • 7. Exit Distribution Report (by Holder) - Square, Inc. (Approx) Exit Value Max. Variance Exit Type Exit Date Actuals as of Date Option Vesting Acceleration Vesting Acceleration % $3,500,000,000 $1,000,000,000 Sale or Liquidation 12/31/2012 07/25/2012 Full Security Holder Seniority Exercise Yes/No Convert Yes/No Net Share Price Distributions Amount Invested Gain/Loss At Issue At Exit Liquidation Preference Pro-Rata Participation Total % Amount Multiple Jack Dorsey Common Stock N/A N/A $0.01 $130.72 - $1,043,692,819 $1,043,692,819 29.8% $79,845 $1,043,612,975 13,071.5 FF Preferred Holders FF Preferred Stock N/A N/A - $130.72 - $117,329,822 $117,329,822 3.4% $117 $117,329,706 1,005,500.3 Option Holders Employee Options Yes N/A $0.01 $130.72 - $82,707,901 $82,707,901 2.4% $6,327 $82,701,573 13,071.5 Employee Options Yes N/A $2.10 $130.72 - $25,323,360 $25,323,360 0.7% $406,832 $24,916,528 62.2 Employee Options Yes N/A $0.49 $130.72 - $33,710,625 $33,710,625 1.0% $126,368 $33,584,257 266.8 Employee Options Yes N/A $13.11 $130.72 - $2,803,233 $2,803,233 0.1% $281,149 $2,522,084 10.0 Series A Preferred Holder Series A Preferred Stock 1 N/A Yes $2.16 $130.72 - $610,448,530 $610,448,530 17.4% $10,099,963 $600,348,567 60.4 Other Common Holders Common Stock N/A N/A $0.01 $130.72 - $594,198,035 $594,198,035 17.0% $45,458 $594,152,578 13,071.5 Series B-1 Preferred Holder Series B-1 Preferred Stock 1 N/A Yes $7.20 $130.72 - $181,606,722 $181,606,722 5.2% $10,000,002 $171,606,720 18.2 Series B-2 Preferred Holder Series B-2 Preferred Stock 1 N/A Yes $9.54 $130.72 - $353,323,283 $353,323,283 10.1% $25,778,279 $327,545,004 13.7 Series C Preferred Holder Series C Preferred Stock 1 N/A Yes $57.98 $130.72 - $217,494,145 $217,494,145 6.2% $96,474,591 $121,019,554 2.3 Rizvi Traverse Management Series D Preferred Stock 1 N/A Yes $110.14 $130.72 - $237,361,524 $237,361,524 6.8% $199,999,922 $37,361,603 1.2
  • 8.
  • 9. Escrow Analysis Report - Square, Inc. (Approx) Escrow Type Apportionment Method Escrow Released No Escrow Security Holder Issue Dollar Amounts Per Share Amounts Date Gross Exit Proceeds Escrow Withheld Cumulative Net Escrow Net Proceeds Gross Exit Proceeds Escrow Withheld Cumulative Net Escrow Net Proceeds before Escrow at Exit Closing Escrow Balance after Escrow before Escrow at Exit Closing Escrow Balance after Escrow Released Released Common Stock Jack Dorsey 06/17/2009 $1,043,692,819 - - - $1,043,692,819 $130.72 - - - $130.72 Other Common Holders 11/14/2009 $594,198,035 - - - $594,198,035 $130.72 - - - $130.72 FF Preferred Stock FF Preferred Holders 06/18/2009 $117,329,822 - - - $117,329,822 $130.72 - - - $130.72 Employee Options Option Holders 11/03/2009 $82,707,901 - - - $82,707,901 $130.71 - - - $130.71 Option Holders 03/17/2011 $25,323,360 - - - $25,323,360 $130.71 - - - $130.71 Option Holders 05/10/2011 $33,710,625 - - - $33,710,625 $130.72 - - - $130.72 Option Holders 09/14/2011 $2,803,233 - - - $2,803,233 $130.71 - - - $130.71 Series A Preferred Stock Series A Preferred 11/13/2009 $610,448,530 - - - $610,448,530 $130.72 - - - $130.72 Holder Series B-1 Preferred Series B-1 Preferred 01/10/2011 $181,606,722 - - - $181,606,722 $130.72 - - - $130.72 Stock Holder Series B-2 Preferred Series B-2 Preferred 02/03/2011 $353,323,283 - - - $353,323,283 $130.72 - - - $130.72 Stock Holder Series C Preferred Stock Series C Preferred 06/24/2011 $217,494,145 - - - $217,494,145 $130.72 - - - $130.72 Holder Series D Preferred Stock Rizvi Traverse 07/24/2012 $237,361,524 - - - $237,361,524 $130.72 - - - $130.72 Management $3,499,999,999 $ $ $ $3,499,999,999 $1,569 $ $ $ $1,569
  • 10. Security Terms — Square, Inc. (Approx) Common Stock Security Name Common Stock FF Preferred Stock Preferred Stock Security Name Convertible To Conversion Dividend Redeemable / Date Seniority Liquidation Multiple Participating Participation Cap Anti-Dilution Series A Preferred Stock Common Stock 1.0000000000 Non-Cumulative - Paid in Cash Annually 8.00000 No 1 1.0000000000 No - Broad-Based Series B-1 Preferred Stock Common Stock 1.0000000000 Non-Cumulative - Paid in Cash Annually 8.00000 No 1 1.0000000000 No - Broad-Based Series B-2 Preferred Stock Common Stock 1.0000000000 Non-Cumulative - Paid in Cash Annually 8.00000 No 1 1.0000000000 No - Broad-Based Series C Preferred Stock Common Stock 1.0000000000 Non-Cumulative - Paid in Cash Annually 8.00000 No 1 1.0000000000 No - Broad-Based Series D Preferred Stock Common Stock 1.0000000000 Non-Cumulative - Paid in Cash Annually 8.00000 No 1 1.0000000000 No - Broad-Based Warrant Security Name Convertible To RSU Common Stock Option Security Name Convertible To Employee Options Common Stock
  • 11. Security Holders — Square, Inc. (Approx) Holder Firm Holder Type Contact Person Contact Details Email Cost of Capital FF Preferred Holders Founder 10.00000% Jack Dorsey Founder 10.00000% Option Holders Employee 10.00000% Other Common Holders Other 10.00000% Rizvi Traverse Management PE Fund 10.00000% Series A Preferred Holder VC Fund 10.00000% Series B-1 Preferred Holder VC Fund 10.00000% Series B-2 Preferred Holder VC Fund 10.00000% Series C Preferred Holder VC Fund 10.00000%
  • 12. Security Issuances — Square, Inc. (Approx) Common Stock Security Holder Issue Date Shares Issued Share Price Before Discounts Common Stock Jack Dorsey 06/17/2009 7,984,489 $0.01 FF Preferred Stock FF Preferred Holders 06/18/2009 897,600 - Common Stock Other Common Holders 11/14/2009 4,545,751 $0.01 Preferred Stock Security Holder Issue Date Shares Issued Share Price Before Discounts Purchase Discount Percentage Series A Preferred Stock Series A Preferred Holder 11/13/2009 4,670,071 $2.16 - Series B-1 Preferred Stock Series B-1 Preferred Holder 01/10/2011 1,389,333 $7.20 - Series B-2 Preferred Stock Series B-2 Preferred Holder 02/03/2011 2,703,004 $9.54 - Series C Preferred Stock Series C Preferred Holder 06/24/2011 1,663,880 $57.98 - Series D Preferred Stock Rizvi Traverse Management 07/24/2012 1,815,870 $110.14 - Warrant Security Holder Issue Date Shares Issued Exercise Price Expiration Date Net (Cashless) Exercise Option Security Holder Issue Date Shares Issued Exercise Price Expiration Date Vesting Start Date Vesting Cliff Months Fully Vested Months Net (Cashless) Exercise Employee Options Option Holders 11/03/2009 1,214,850 $0.01 11/03/2020 11/03/2010 - 48 No Employee Options Option Holders 03/17/2011 1,033,224 $2.10 03/17/2021 03/17/2012 - 48 No Employee Options Option Holders 05/10/2011 1,768,416 $0.49 05/10/2021 05/10/2012 - 48 No Employee Options Option Holders 09/14/2011 343,126 $13.11 02/14/2021 09/14/2012 - 48 No
  • 13. VC Experts.com, Inc. Disclaimer The information contained herein is from sources deemed reliable; it does not, however, purport to constitute investment advice nor does VC Experts represent that it contains all information concerning the identified Company deemed necessary or appropriate for investment decisions. VC Experts is neither a broker/dealer nor investment adviser and has no financial interest in the Company analyzed nor in the sale or purchase of any of its securities. The information and data are for reference purposes only and no implied or expressed warranties or assurances as to its accuracy or completeness are furnished by VC Experts. Estimates of valuation are, as indicated, estimates based on such information as we found available, the completeness of which is neither represented or guaranteed; users for any purpose are cautioned and required to undertake and perform their own investigations and due diligence. To the extent that the information incorporates content from specified sources of financial information, VC Experts disclaims any responsibility for the accuracy or completeness of such content.