SlideShare ist ein Scribd-Unternehmen logo
1 von 2
Downloaden Sie, um offline zu lesen
United Nations • Department of Economic and Social Affairs • Population Division


                                                                          International Migration 2009                                                                                                                                                                                                                                                                                                                                                                                                         www.unmigration.org
                                                                                                                                                                                                                                                                                                                                                                                                                                                                                                              www.unpopulation.org


                                                                                                                                                                                                                            states partIes to unIted natIons                                                                                                                                                                                                                                                                         states partIes to unIted natIons
                                                                InternatIonal mIgrant stock                                        refugees               net mIgratIon                           remIttances                                                                                                                                                   InternatIonal mIgrant stock                                           refugees                        net mIgratIon                      remIttances
                                                                                                                                                                                                                                      Instruments                                                                                                                                                                                                                                                                                              Instruments
                                                                               average   net migration             average average annual                                                      total           per-                                                                                                                                                       average   net migration             average average annual                                                                   total           per-
                                     type             percentage percentage                                                                                                                                                                                                                                                     type             percentage percentage
                                             total                           annual rate  among the     total     annual net net migration                                                   (millions       centage        1951     1967       1990        2000         2000                                                           total                           annual rate  among the     total     annual net net migration                                                                (millions       centage         1951       1967    1990       2000     2000
     country or area                  of                of total   female                                                                                                                                                                                                                      country or area                   of                of total   female
                                          (thousands)                         of change foreign-born (thousands) migration rate (per 1,000                                                     of US         of total        rc       rp        mWc         Htp          msp                                                         (thousands)                         of change foreign-born (thousands) migration rate (per 1,000                                                                  of US         of total         rc         rp     mWc        Htp      msp
                                     data             population migrants                                                                                                                                                                                                                                                       data             population migrants
                                                                            (percentage) (thousands)             (thousands)  population)                                                     dollars)         gdp                                                                                                                                                     (percentage) (thousands)             (thousands)  population)                                                                  dollars)         gdp
                                                                 2010                                   2005-2010                   end-2008                  2005-2010                                2007                              (as of 1 July 2009)                                                                                                    2010                                      2005-2010                    end-2008                          2005-2010                             2007                                (as of 1 July 2009)
                                                        (1)             (2)            (3)               (4)                (5)              (6)              (7)                    (8)              (9)           (10)     (11)     (12)         (13)        (14)         (15)                                                                       (1)             (2)            (3)                 (4)                  (5)               (6)                     (7)                 (8)             (9)            (10)         (11)    (12)      (13)      (14)     (15)
World                                               213 944           3.1            49.0               1.8          24 359.8         15 150.4                —                       —          380 050            0.7      144      144           41         131         115            Eastern Europe (continued)
More developed regions                              127 711          10.3            51.5               1.7          14 715.3          2 081.0          2 700.5                     2.2          134 457            0.4        46       46            2          41          40             Romania                               B                  133             0.6            51.3              -0.1                    5.3               1.6                    -40.0                -1.9          8 539             5.1      1991       1991        …      2002      2002
Less developed regions                               86 232           1.5            45.3               2.0           9 644.5         13 069.4        - 2 700.5                     -0.5         245 593            1.9        98       98          39           90          75             Russian Federation                    B            12 270                8.7            57.8                  0.3             853.9                 3.5                    50.0                 0.4           4 713             0.4      1993       1993        …      2004      2004
  Least developed countries                          11 531           1.3            47.4               1.1           1 089.9          1 880.8         - 314.6                      -0.4          17 334            5.4        39       38          10           27          23             Slovakia                             BR                  131             2.4            56.0                  1.0               10.8                0.3                      4.0                0.7           1 483             2.0      1993       1993        …      2004      2004
  Sub-Saharan Africa                                 18 007           2.1            47.2               1.7           2 245.2          2 133.4         - 360.5                      -0.4          18 615            2.5        44       44          12           32          28             Ukraine                               B                 5 258           11.6            57.2              -0.5                181.7                 7.2                    -16.0                -0.3          4 503             3.2      2002       2002        …      2004      2004
Africa                                               19 263           1.9            46.8               1.7           2 326.8          2 332.9         - 532.0                      -0.5          36 853            3.1        48       48          16           36          32           Northern Europe                                      10 657               10.8            53.0                  2.5           1 588.8              445.8                    285.8                 2.9         14 453              0.3           10      10        —          8         8
Eastern Africa                                       5 034            1.5            49.6              -0.4              151.7         1 074.6            -323.9                    -1.1           2 901            2.5        14       13            3          10          10             Channel Islands6                      B                    75           49.8            53.0                  1.8                 8.8                     ..                 0.3                2.0                ..              ..           -       -         -         -        -
 Burundi                             BR                 61            0.7            54.6              -5.9              -16.6             21.1             64.6                    8.1                0            0.0     1963     1971           …            …           …              Denmark                               B                  484             8.8            51.0                  2.8               78.9              23.4                       6.0                1.1           1 028             0.3      1952       1968        …      2003      2006
 Comoros                              B                 14            2.0            53.3              -0.2                 0.2              —              -2.0                    -3.1             12             2.7        …        …           …            …           …              Estonia                               B                  182            13.6            59.6              -2.0                   -9.7               0.0                      —                    —             426             2.0      1997       1997        …      2004      2004
 Djibouti                            BR                114           13.0            45.9               0.7                 8.3             9.2               —                       —              29             3.4     1977     1977           …        2005         2005              Faeroe Islands                        B                     3            6.5            43.8                  1.5                 0.3                     ..                 —                    —                ..              ..           -       -         -         -        -
 Eritrea                              I                 16            0.3            45.9               2.4                 2.3             4.9             11.0                    2.3                ..              ..      …        …           …            …           …              Finland7                              B                  226             4.2            50.5                  5.5               60.2                6.6                    11.0                 2.1             772             0.3      1968       1968        …      2006      2006
 Ethiopia                            BR                548            0.6            47.1              -0.2               18.4             83.6            -60.0                    -0.8            358             1.8     1969     1969           …            …           …              Iceland                               B                    37           11.3            49.4             10.0                   15.2                0.0                      4.0               12.8              41             0.2      1955       1968        …         …         …
 Kenya                               BR                818            2.0            50.8               0.7               61.8           320.6             -37.9                    -1.0           1 588            6.6     1966     1981           …        2005         2005              Ireland                               B                  899            19.6            49.6                  7.5             295.8                 9.7                    40.0                 9.1             580             0.2      1956       1968        …         …         …
 Madagascar                           C                 38            0.2            46.1              -1.0                -0.6              —              -1.0                    -0.1             11             0.1     1967        …           …        2005         2005              Isle of Man                           B                    44           54.6            50.6                  1.1                 4.0                     ..                 —                    —                ..              ..           -       -         -         -        -
 Malawi                              BR                276            1.8            51.6              -0.2                 9.8             4.2             -4.0                    -0.3               1            0.0     1987     1987           …        2005         2005              Latvia                                B                  335            15.0            59.3              -2.5                 -25.4                0.0                     -2.0                -0.9            552             2.0      1997       1997        …      2004      2003
 Mauritius1                           B                 43            3.3            63.3               1.0                 3.1              —                —                       —             215             3.2        …        …           …        2003         2003              Lithuania                             B                  129             4.0            56.6              -5.0                 -28.6                0.8                    -20.0                -6.0          1 433             3.7      1997       1997        …      2003      2003
 Mayotte                              B                 72           36.0            49.9               4.6               15.4                 ..            0.7                    3.9                ..              ..        -        -            -           -           -            Norway8                               B                  485            10.0            51.2                  5.4             126.8               36.1                     27.0                 5.7             613             0.2      1953       1967        …      2003      2003
 Mozambique                          BR                450            1.9            52.1               2.1               67.8              3.2             -4.0                    -0.2             99             1.3     1983     1989           …        2006         2006              Sweden                                B                 1 306           14.1            52.2                  3.2             234.4               77.0                     30.0                 3.3             775             0.2      1954       1967        …      2004      2006
 Réunion                              B                175           20.9            50.2               4.0               34.6                 ..             —                       —                ..              ..        -        -            -           -           -            United Kingdom                        B                 6 452           10.4            53.5                  2.0             828.2              292.1                    189.5                 3.1           8 234             0.3      1954       1968        …      2006      2006
 Rwanda                              BR                465            4.5            53.9               1.3               53.1             55.1              3.0                    0.3              51             1.5     1980     1980        2008        2003         2006            Southern Europe                                      14 664                9.5            50.1                  5.2           3 771.4              191.0                    738.7                 4.9         32 141              0.8           13      13         2        11       11
 Seychelles                           B                 11           12.8            42.5               5.0                 2.6                ..           -0.4                    -4.8             11             1.5     1980     1980        1994        2004         2004              Albania                               C                    89            2.8            53.1                  1.5                 8.3               0.1                    -15.0                -4.8          1 468            13.6      1992       1992     2007      2002      2002
 Somalia                             IR                 23            0.2            45.9               1.4                 2.8             1.8            -50.0                    -5.6               ..              ..   1978     1978           …            …           …              Andorra                               C                    56           64.4            47.3                  2.1                 6.8                     ..                 1.1               13.3                ..              ..         …       …         …         …         …
 Uganda                              BR                647            1.9            49.9              -0.2               25.0           162.1             -27.0                    -0.9            452             3.8     1976     1976        1995            …           …              Bosnia and Herzegovina               IR                    28            0.7            50.3              -4.7                   -6.1               7.3                     -2.0                -0.5          2 700            17.8      1993       1993     1996      2002      2002
 United Republic of Tanzania         BR                659            1.5            50.4              -3.8             -104.7           321.9             -60.0                    -1.4             14             0.1     1964     1968           …        2006         2006              Croatia                              BR                  700            15.9            53.0                  1.1               66.6                1.6                      2.0                0.5           1 394             2.7      1992       1992        …      2003      2003
 Zambia                              BR                233            1.8            49.6              -4.2              -35.8             83.5            -17.0                    -1.4             59             0.5     1969     1969           …        2005         2005              Gibraltar                             B                     9           29.8            51.5                  0.1                 0.4                     ..                 —                    —                ..              ..           -       -         -         -        -
 Zimbabwe                            BR                372            2.9            37.8              -1.0                 4.0             3.5           -140.0                   -11.1               ..              ..   1981     1981           …            …           …              Greece                                C                 1 133           10.1            44.6                  3.0             194.6                 2.2                    30.0                 2.7           2 484             0.8      1960       1968        …         …         …
Middle Africa                                        1 615            1.3            48.5               0.6              135.7           620.6             -30.2                    -0.2            195             0.5         9        9          —             5            4            Holy See9                             I                     1          100.0            52.5                  0.1                 0.1                     ..                 0.0               14.3                ..              ..    1956       1967        …         …         …
 Angola                              BR                 65            0.3            53.0               3.1               12.8             12.7             16.0                    0.9                ..              ..   1981     1981           …            …           …              Italy                                 B                 4 463            7.4            53.1                  7.5           1 508.1               47.1                    330.0                 5.6           3 165             0.2      1954       1972        …      2006      2006
 Cameroon                             B                197            1.0            45.7              -1.5                -4.2            81.0             -3.8                    -0.2            167             0.8     1961     1967           …        2006         2006              Malta                                 C                    15            3.8            51.6                  5.6                 4.1               4.3                      1.0                2.5              43             0.6      1971       1971        …      2003      2003
 Central African Republic             C                 80            1.8            46.6               1.2                 9.6             7.4              1.0                    0.2                ..              ..   1962     1967           …        2006         2006              Montenegro                            B                    43            6.8            61.5              -5.0                 -10.0              24.7                      -1.0                -1.6               ..              ..    2006       2006        …      2006      2006
 Chad                                BR                388            3.4            48.0               1.6               51.9           330.5             -15.0                    -1.4               ..              ..   1981     1981           …            …           …              Portugal                              B                  919             8.6            50.3                  3.7             183.5                 0.4                    40.0                 3.8           3 941             1.8      1960       1976        …      2004      2004
 Congo                                B                143            3.8            49.4               2.1               20.5             24.8            -10.0                    -2.8             15             0.2     1962     1970           …            …           …              San Marino                            B                    12           37.0            53.5                  0.5                 0.6                     ..                 0.2                6.5                ..              ..         …       …         …         …         …
 Dem. Republic of the Congo          BR                445            0.7            53.1              -1.5                -5.4          155.2             -20.0                    -0.3               ..              ..   1965     1975           …        2005         2005              Serbia                                B                  525             5.3            56.7              -5.0                -120.5              96.7                       —                    —           5 577            13.9      2001       2001        …      2001      2001
 Equatorial Guinea                    C                  7            1.1            47.0               5.0                 2.0              —               2.0                    3.1                ..              ..   1986     1986           …        2003            …              Slovenia                              B                  164             8.1            46.6              -0.4                    2.4               0.3                      4.4                2.2             284             0.6      1992       1992        …      2004      2004
 Gabon                                C                284           18.9            43.0               3.0               48.5              9.0              1.0                    0.7              11             0.1     1964     1973           …            …           …              Spain                                 B                 6 378           14.1            47.9                  6.5           1 918.9                 4.7                   350.0                 7.9         10 739              0.7      1978       1978        …      2002      2002
 Sao Tome and Principe                C                  5            3.2            48.0              -0.5                 0.0              —              -1.4                    -8.8               2            1.4     1978     1978           …        2006         2006              TFYR Macedonia10                     BR                  130             6.3            58.3                  1.5               13.4                1.7                     -2.0                -1.0            345             4.5      1994       1994        …      2005      2005
Northern Africa                                      2 010            0.9            43.4               1.8              219.8           381.1            -144.5                    -0.7          20 007            4.2         5        5            4           4            4          Western Europe                                       23 453               12.4            49.0                  0.7           1 543.7              924.3                    326.3                 1.7         41 254              0.5            9       8        —          9         8
 Algeria                             CR                242            0.7            45.2               0.0                 4.3            94.1            -28.0                    -0.8           2 120            1.6     1963     1967        2005        2004         2004              Austria                               B                 1 310           15.6            50.5                  2.5             193.5               37.6                     32.0                 3.9           2 965             0.8      1954       1973        …      2005      2007
 Egypt                               BR                245            0.3            46.6              -0.2                 3.4            97.9            -68.0                    -0.8           7 656            5.9     1981     1981        1993        2004         2005              Belgium                               C                  975             9.1            49.4                  2.0             124.5               17.0                     40.0                 3.8           8 557             1.9      1953       1969        …      2004      2004
 Libyan Arab Jamahiriya               C                682           10.4            35.5               2.0               74.7              6.7              4.0                    0.6              16             0.0        …        …        2004        2004         2004              France                                B                 6 685           10.7            51.3                  0.6             412.0              160.0                    100.0                 1.6         13 745              0.5      1954       1971        …      2002      2002
 Morocco                              C                 49            0.2            49.7              -0.8                -0.8             0.8            -85.0                    -2.7           6 730            9.0     1956     1971        1993            …           …              Germany                               B            10 758               13.1            46.7                  0.3             563.7              582.7                    110.0                 1.3           9 839             0.3      1953       1969        …      2006      2006
 Sudan                               BR                753            1.7            48.2               3.3              138.2           181.6              27.0                    0.7            1 769            3.8     1974     1974           …            …           …              Liechtenstein                         C                    13           34.6            48.3                  1.1                 1.0               0.1                      0.2                5.6                ..              ..    1957       1968        …      2008      2008
 Tunisia                              C                 34            0.3            49.3              -0.8                -0.5             0.1             -4.0                    -0.4           1 716            4.9     1957     1968           …        2003         2003              Luxembourg                            B                  173            35.2            50.2                  2.1               21.8                3.1                      4.0                8.4           1 565             3.2      1953       1971        …      2009         …
 Western Sahara                       I                  4            0.8            43.1               2.1                 0.5                ..            9.5                   19.6                ..              ..        -        -            -           -           -            Monaco                                B                    24           71.6            50.6                  0.8                 1.9                     ..                 0.1                2.1                ..              ..    1954         …         …      2001      2001
Southern Africa                                      2 163            3.7            43.3               7.3              738.1             54.1           134.4                     2.4            1 535            0.5         5        5            1           4            4            Netherlands                           B                 1 753           10.5            52.1                  0.2               71.3              77.6                     20.0                 1.2           2 548             0.3      1956       1968        …      2005      2005
 Botswana                             C                115            5.8            46.3               7.2               38.1              3.0              3.0                    1.6             141             1.1     1969     1969           …        2002         2002              Switzerland                           B                 1 763           23.2            49.7                  1.2             153.9               46.1                     20.0                 2.7           2 035             0.5      1955       1968        …      2006      2006
 Lesotho                             CR                  6            0.3            45.5               0.3                 0.5              —              -7.2                    -3.5            443            27.7     1981     1981        2005        2003         2004            Latin America and
                                                                                                                                                                                                                                                                                                                                                    7 480            1.3            50.1                  1.7             769.1              350.3               - 1 049.1                  -1.8        63 435              1.8           27      27        15        26       23
 Namibia                              B                139            6.3            47.6               1.1               11.4              6.8             -0.2                    -0.1             16             0.2     1995     1995           …        2002         2002            the Caribbean
 South Africa                        BR              1 863            3.7            42.7               8.0              684.0             43.5           140.0                     2.8             834             0.3     1996     1996           …        2004         2004            Caribbean                                                 1 379            3.3            48.7                  0.9               94.9                0.6                   -124.6                -3.0          7 278             8.0            9       8         1         6         6
 Swaziland                           BR                 40            3.4            47.7               0.9                 4.0             0.8             -1.2                    -1.0            100             3.5     2000     1969           …            …           …              Anguilla                              B                     6           39.2            55.0                  3.5                 1.1                     ..                 0.2               13.7                ..              ..           -       -         -         -        -
Western Africa                                       8 440            2.8            46.5               1.8           1 081.6            202.4            -167.9                    -0.6          12 216            4.9        15       16            8          13          10             Antigua and Barbuda                   B                    21           23.6            56.2                  2.8                 3.2                     ..                 —                    —              24             2.0      1995       1995        …         …         …
 Benin                              CBR                232            2.5            45.5               4.3               50.9              6.9             10.0                    1.2             224             4.1     1962     1970           …        2004         2004              Aruba                                 B                    34           31.9            55.4                  0.5                 1.7                     ..                 0.8                7.7              13             0.3             -       -         -         -        -
 Burkina Faso                        BR              1 043            6.4            50.8               6.0              307.5              0.6            -13.0                    -0.9             50             0.7     1980     1980        2003        2002         2002              Bahamas                               B                    33            9.7            48.5                  1.1                 2.5                     ..                 0.4                1.2                ..              ..    1993       1993        …      2008      2008
 Cape Verde                           B                 12            2.4            50.4               1.5                 1.1                ..           -2.5                    -5.1            139             9.7        …     1987        1997        2004         2004              Barbados                              B                    28           10.9            60.7                  1.4                 2.6                     ..                -0.3                -1.0            140             4.1           …       …         …         …         …
 Côte d’Ivoire                       CB              2 407           11.2            45.1               0.3              131.4             24.8            -29.0                    -1.4            179             0.9     1961     1970           …            …           …              British Virgin Islands                B                     9           36.6            48.6                  0.1                 0.2                     ..                 —                    —                ..              ..           -       -         -         -        -
 Gambia                               B                290           16.6            50.5               4.5               68.1             14.8              3.0                    1.8              47             7.4     1966     1967           …        2003         2003              Cayman Islands                        B                    36           63.0            48.4                  1.0                 2.3                     ..                 0.4                7.3                ..              ..           -       -         -         -        -
 Ghana                                B              1 852            7.6            41.8               2.1              251.5             18.2            -10.3                    -0.4            117             0.8     1963     1968        2000            …           …              Cuba                                  B                    15            0.1            28.9              -0.1                    0.3               0.5                    -38.8                -3.5               ..              ..         …       …         …         …         …
 Guinea                              CR                395            3.8            53.1              -0.3                 9.8            21.5            -60.0                    -6.1            151             3.3     1965     1968        2000        2004         2005              Dominica                              B                     6            8.3            45.6                  3.9                 1.1                     ..                -0.6                -9.0             26             7.9      1994       1994        …         …         …
 Guinea-Bissau                       BR                 19            1.2            50.0               0.0                 1.2             7.9             -2.5                    -1.6             29             8.1     1976     1976           …        2007            …              Dominican Republic                    B                  434             4.2            41.0                  2.0               50.2                      ..               -28.0                -2.8          3 414             9.3      1978       1978        …      2008      2007
 Liberia                              B                 96            2.3            45.1              -0.1                 3.3            10.2             49.6                   13.3              65             8.8     1964     1980           …        2004         2004              Grenada                               B                    13           12.1            54.2                  3.0                 2.0                     ..                -1.0                -9.7             55             9.2           …       …         …      2004      2004
 Mali                                BR                163            1.2            47.6              -0.3                 6.9             9.6            -40.3                    -3.2            344             5.0     1973     1973        2003        2002         2002              Guadeloupe                            B                  105            22.5            52.7                  2.3               14.2                      ..                -0.7                -1.5               ..              ..           -       -         -         -        -
 Mauritania                          CR                 99            2.9            42.2               8.1               35.7             27.0              2.0                    0.6                2            0.1     1987     1987        2007        2005         2005              Haiti                                 B                    35            0.3            43.2                  3.0                 5.9               0.0                    -28.0                -2.9          1 222            18.2      1984       1984        …         …         …
 Niger                               BR                202            1.3            53.9               2.0               29.4              0.3             -5.7                    -0.4             78             1.9     1961     1970        2009        2004            …              Jamaica                               B                    30            1.1            49.4                  2.0                 3.5                     ..               -20.0                -7.4          2 144            18.8      1964       1980     2008      2003      2003
 Nigeria                             CR              1 128            0.7            47.4               3.0              214.2             10.1            -60.0                    -0.4           9 221            5.6     1967     1968           …        2001         2001              Martinique                            B                    71           17.6            54.4                  2.0                 8.7                     ..                -0.4                -1.0               ..              ..           -       -         -         -        -
 Saint Helena2                        B                  0            9.7            49.4               0.5                 0.0                ..           -0.1                   -21.9               ..              ..        -        -            -           -           -            Montserrat                            B                     0            1.8            46.3              -0.4                    0.0                     ..                 —                    —                ..              ..           -       -         -         -        -
 Senegal                             BR                210            1.6            51.2              -0.9                -1.3            33.2            -20.0                    -1.7           1 192           10.7     1963     1967        1999        2003         2003              Netherlands Antilles                  B                    53           26.4            56.8                  2.6                 7.7                     ..                 1.7                8.7              32             1.2             -       -         -         -        -
 Sierra Leone                        BR                107            1.8            45.7              -7.1              -36.4              7.8             12.0                    2.2             148             8.9     1981     1981           …            …           …              Puerto Rico                           B                  324             8.1            52.7              -1.7                 -18.3                      ..                -4.3                -1.1               ..              ..           -       -         -         -        -
 Togo                                BR                185            2.7            50.2               0.3                 8.1             9.4             -1.1                    -0.2            229             9.2     1962     1969           …        2009            …              Saint Kitts and Nevis                 B                     5            9.6            46.3                  2.2                 0.6                     ..                 —                    —              37             7.1      2002         …         …      2004      2004
Asia                                                61 324            1.5            44.6               2.1           6 768.6         10 378.2        - 1 075.7                     -0.3         145 200            1.1        19       19            8          27          19             Saint Lucia                           B                    10            5.9            51.3                  3.2                 1.7                 —                     -0.2                -1.2             31             3.2           …       …         …         …         …
Central Asia                                         4 970            8.1            55.2              -0.4               84.5              7.4           -160.0                    -2.7           2 629            2.3         4        4            2           5            4            Saint Vincent and the
                                                                                                                                                                                                                                                                                                                                  B                     9            7.9            51.9                  3.0                 1.4                     ..                -1.0                -9.2             31             5.5      1993       2003        …         …         …
                                                                                                                                                                                                                                                                                            Grenadines
 Kazakhstan                           B              3 079           19.5            54.0               0.7              228.4              4.4            -20.0                    -1.3            223             0.2     1999     1999           …        2008         2008
                                                                                                                                                                                                                                                                                            Trinidad and Tobago                   B                    34            2.6            54.0              -1.9                   -2.4               0.0                     -4.0                -3.0            109             0.5      2000       2000        …      2007      2007
 Kyrgyzstan                           B                223            4.0            58.2              -5.1              -57.6              0.4            -15.0                    -2.8            715            19.1     1996     1996        2003        2003         2003
                                                                                                                                                                                                                                                                                            Turks and Caicos Islands              B                     6           19.0            48.6                  1.0                 0.4                     ..                 —                    —                ..              ..           -       -         -         -        -
 Tajikistan                           B                284            4.0            57.1              -1.5              -14.9              1.8            -40.0                    -5.9           1 691           45.5     1993     1993        2002        2002         2002
                                                                                                                                                                                                                                                                                            United States Virgin Islands          B                    62           56.5            53.3                  0.9                 4.1                     ..                -0.8                -7.3               ..              ..           -       -         -         -        -
 Turkmenistan                         B                208            4.0            57.1              -1.5                -9.8             0.1             -5.0                    -1.0               ..              ..   1998     1998           …        2005         2005
                                                                                                                                                                                                                                                                                          Central America                                           1 547            1.0            50.0                  2.9             229.2               36.7                    -634.0                -4.3        39 356              3.4            8       8         6         8         7
 Uzbekistan                           B              1 176            4.2            57.1              -1.5              -61.7              0.8            -80.0                    -3.0               ..              ..      …        …           …        2008            …
                                                                                                                                                                                                                                                                                            Belize                               BR                    47           15.0            52.1                  2.8                 6.7               0.3                     -0.2                -0.7             75             5.9      1990       1990     2001      2003      2006
Eastern Asia                                         6 485            0.4            55.0               0.9              460.5           303.3            -291.5                    -0.2          36 448            0.4         3        3          —             1            1
         3                                                                                                                                                                                                                                                                                  Costa Rica                           BR                  489            10.5            50.0                  2.0               53.3              18.1                       6.0                1.3             635             2.4      1978       1978        …      2003      2003
 China                                I                686            0.1            50.0               3.0              110.8           301.0            -346.2                    -0.3          32 833            1.0     1982     1982           …            …           …
                                                                                                                                                                                                                                                                                            El Salvador                          BR                    40            0.7            52.5                  2.3                 5.4               0.0                    -55.9                -9.1          3 711            18.2      1983       1983     2003      2004      2004
 China, Hong Kong SAR4                B              2 742           38.8            57.0               0.2               81.1              0.1             22.7                    3.3             317             0.2          -        -            -           -           -
                                                                                                                                                                                                                                                                                            Guatemala                            BR                    59            0.4            54.4                  2.1                 7.1               0.1                    -40.0                -3.0          4 254            12.6      1983       1983     2003      2004      2004
 China, Macao SAR5                    B                300           54.7            51.7               1.5               26.2                 ..           10.0                   19.3             399             2.1          -        -            -           -           -
                                                                                                                                                                                                                                                                                            Honduras                             BR                    24            0.3            48.4              -1.6                   -1.5               0.0                    -20.0                -2.8          2 625            21.5      1992       1992     2005      2008         …
 Dem. People’s Rep. of Korea          I                 37            0.2            53.1               0.2                 1.7                ..             —                       —                ..              ..      …        …           …            …           …
                                                                                                                                                                                                                                                                                            Mexico                               BR                  726             0.7            49.4                  3.6             131.7                 1.1                   -486.0                -4.5        27 136              2.7      2000       2000     1999      2003      2003
 Japan                                C              2 176            1.7            55.0               1.7              244.6              2.0             30.0                    0.2            1 577            0.0     1981     1982           …            …           …
                                                                                                                                                                                                                                                                                            Nicaragua                            BR                    40            0.7            48.3                  2.8                 5.8               0.1                    -40.0                -7.1            740            12.9      1980       1980     2005      2004      2006
 Mongolia                             C                 10            0.4            54.0               2.0                 1.2             0.0             -2.0                    -0.8            194             4.9        …        …           …        2008         2008
                                                                                                                                                                                                                                                                                            Panama                                B                  121             3.4            51.3                  3.4               20.7              16.9                       2.2                0.7             180             0.9      1978       1978        …      2004      2004
 Republic of Korea                    B                535            1.1            52.7              -0.6                -5.2             0.2             -6.0                    -0.1           1 128            0.1     1992     1992           …            …           …
                                                                                                                                                                                                                                                                                          South America                                             4 554            1.2            50.5                  1.6             445.0              313.0                    -290.6                -0.8        16 800              0.7           10      11         8        12       10
South-Eastern Asia                                   6 715            1.1            49.6               3.5           1 212.2            152.6            -293.3                    -0.5          31 893            2.9         3        3            2           5            4
                                                                                                                                                                                                                                                                                            Argentina                             B                 1 449            3.6            53.4              -0.6                   -1.9               2.8                      6.0                0.2             607             0.2      1961       1967     2007      2002      2002
 Brunei Darussalam                    B                148           36.4            45.5               3.5               25.3                 ..            0.7                    1.8                ..              ..      …        …           …            …           …
                                                                                                                                                                                                                                                                                            Bolivia (Plurinational State of)      B                  146             1.5            47.7                  4.9               35.1                0.7                    -20.0                -2.1            927             7.1      1982       1982     2000      2006         …
 Cambodia                             C                336            2.2            51.7               2.0               41.4              0.2             -1.0                    -0.1            353             4.2     1992     1992           …        2007         2005
                                                                                                                                                                                                                                                                                            Brazil                                B                  688             0.4            46.3                  0.0               18.2                3.9                    -45.8                -0.2          4 382             0.3      1960       1972        …      2004      2004
 Indonesia                           CR                123            0.1            44.5              -2.0                -9.5             0.4           -146.0                    -0.6           6 174            1.4        …        …           …            …           …
                                                                                                                                                                                                                                                                                            Chile                                 B                  320             1.9            53.5                  6.5               93.5                1.6                      6.0                0.4                3            0.0      1972       1972     2005      2004      2004
 Lao People’s Dem. Republic          CR                 19            0.3            48.0              -1.4                -0.8              —             -15.0                    -2.4               1            0.0        …        …           …        2003         2003
                                                                                                                                                                                                                                                                                            Colombia                              B                  110             0.2            47.9                  0.1                 2.6               0.2                    -24.0                -0.5          4 523             2.2      1961       1980     1995      2004         …
 Malaysia                            BR              2 358            8.4            45.2               3.0              362.6             36.7             26.0                    1.0            1 803            1.0        …        …           …        2009            …
                                                                                                                                                                                                                                                                                            Ecuador                              BR                  394             2.9            48.4             23.2                 272.4              101.4                     -70.0                -5.2          3 094             7.0      1955       1969     2002      2002      2002
 Myanmar                              C                 89            0.2            48.7              -1.0                -1.1              —            -100.0                    -2.0            125             0.6        …        …           …        2004         2004
                                                                                                                                                                                                                                                                                            Falkland Islands (Malvinas)           B                     2           57.0            40.4                  1.0                 0.1                     ..                 —                    —                ..              ..           -       -         -         -        -
 Philippines                         CR                435            0.5            51.1               3.0               67.4              0.1           -180.0                    -2.0          16 302           11.3     1981     1981        1995        2002         2002
                                                                                                                                                                                                                                                                                            French Guiana                         B                  108            46.5            50.0                  1.5                 9.3                     ..                 1.2                5.5                ..              ..           -       -         -         -        -
 Singapore                            B              1 967           40.7            56.0               5.5              501.0              0.0           100.0                    22.0                ..              ..      …        …           …            …           …
                                                                                                                                                                                                                                                                                            Guyana                                B                    12            1.5            46.5                  3.0                 1.9                     ..                -8.0              -10.5             278            25.8           …       …         …      2004      2008
 Thailand                            BR              1 157            1.7            48.4               3.3              207.9           112.9              60.0                    0.9            1 635            0.7        …        …           …            …           …
                                                                                                                                                                                                                                                                                            Paraguay                              B                  161             2.5            48.3              -0.8                   -3.4               0.1                     -8.0                -1.3            484             4.0      1970       1970     2008      2004      2008
 Timor-Leste                          B                 14            1.2            52.6               3.0                 2.3             0.0              2.0                    1.8                ..              ..   2003     2003        2004            …           …
                                                                                                                                                                                                                                                                                            Peru                                  B                    38            0.1            52.4              -2.0                   -3.1               1.1                   -125.0                -4.4          2 131             2.0      1964       1983     2005      2002      2002
 Viet Nam                            CR                 69            0.1            36.6               4.8               15.9              2.4            -40.0                    -0.5           5 500            8.0        …        …           …            …           …
                                                                                                                                                                                                                                                                                            Suriname                              C                    39            7.5            45.4                  3.0                 6.5               0.0                     -1.0                -2.0            140             6.2      1978       1978        …      2007      2007
Southern Asia                                       14 304            0.8            44.6               0.6              841.2         3 099.1            -575.1                    -0.3          56 605            3.3         2        2            1          —           —
                                                                                                                                                                                                                                                                                            Uruguay                               B                    80            2.4            54.0              -1.0                   -1.3               0.1                    -10.0                -3.0             96             0.4      1970       1970     2001      2005      2005
 Afghanistan                          B                 91            0.3            43.6               1.0               10.6              0.0           200.0                     7.5                ..              ..   2005     2005           …            …           …
                                                                                                                                                                                                                                                                                            Venezuela (Bolivarian Rep. of)        B                 1 007            3.5            50.1              -0.1                  15.2             201.2                       8.0                0.3             136             0.1           …     1986        …      2002      2005
 Bangladesh                          BR              1 085            0.7            13.9               1.0               79.8             28.4           -114.0                    -0.7           6 562            9.6        …        …           …            …           …
                                                                                                                                                                                                                                                                                          Northern America                                     50 042               14.2            50.1                  1.9           5 760.4              453.2                   1 219.9                3.6           2 972             0.0            1       2        —          2         2
 Bhutan                               B                 40            5.7            18.5               1.5                 3.9                ..            2.0                    2.9                ..              ..      …        …           …            …           …
                                                                                                                                                                                                                                                                                            Bermuda                               B                    20           30.7            51.7                  1.2                 1.8                     ..                 —                    —                ..              ..           -       -         -         -        -
 India                               BR              5 436            0.4            48.7              -1.6             -265.8           184.5            -200.0                    -0.2          38 666            3.3        …        …           …            …           …
                                                                                                                                                                                                                                                                                            Canada                                B                 7 202           21.3            52.2                  2.7           1 071.3              173.7                    210.0                 6.3                ..              ..    1969       1969        …      2002      2002
 Iran (Islamic Republic of)          BR              2 129            2.8            38.8               0.6              111.4           980.1            -100.0                    -1.4           1 115            0.4     1976     1976           …            …           …
                                                                                                                                                                                                                                                                                            Greenland                             B                     6           10.2            32.9              -2.8                   -0.7                     ..                -0.4                -7.0               ..              ..           -       -         -         -        -
 Maldives                             I                  3            1.0            44.7               0.8                 0.2                ..             —                       —                3            0.3        …        …           …            …           …
                                                                                                                                                                                                                                                                                            Saint Pierre and Miquelon             B                     1           16.9            47.2              -2.0                   -0.1                     ..                -0.1              -15.6                ..              ..           -       -         -         -        -
 Nepal                               BR                946            3.2            68.2               2.9              146.8           124.8             -20.0                    -0.7           1 734           16.8        …        …           …            …           …
                                                                                                                                                                                                                                                                                            United States of America              B            42 813               13.5            49.8                  1.7           4 688.0              279.5                   1 010.4                3.3           2 972             0.0           …     1968        …      2005      2005
 Pakistan                            BR              4 234            2.3            44.7               3.5              771.9         1 780.9            -283.1                    -1.6           5 998            4.2        …        …           …            …           …
                                                                                                                                                                                                                                                                                          Oceania                                                   6 015           16.8            51.2                  1.7             637.3               33.6                     96.4                 2.8           6 161             0.6            7       7        —          3         3
 Sri Lanka                            C                340            1.7            49.8              -1.5              -17.6              0.3            -60.0                    -3.0           2 527            7.8        …        …        1996            …           …
                                                                                                                                                                                                                                                                                          Australia and New Zealand                                 5 674           22.0            51.6                  1.8              612.7              23.6                    110.0                 4.4           4 478             0.5            2       2        —          2         2
Western Asia                                        28 850           12.4            39.3               3.3           4 170.2          6 815.8            244.3                     1.1           17 626            1.6         7        7            3          16          10
                                                                                                                                                                                                                                                                                            Australia11                           B                 4 711           21.9            51.4                  1.7             485.8               20.9                    100.0                 4.8           3 828             0.5      1954       1973        …      2005      2004
 Armenia                             BR                324           10.5            58.9              -8.4             -152.7              4.0            -15.0                    -4.9            846             9.2     1993     1993           …        2003         2003
                                                                                                                                                                                                                                                                                            New Zealand                           B                  962            22.4            52.4                  2.3             126.9                 2.7                    10.0                 2.4             650             0.5      1960       1973        …      2002      2002
 Azerbaijan                          BR                264            3.0            57.1               0.7               15.8              2.1            -10.0                    -1.2           1 287            4.1     1993     1993        1999        2003         2003
                                                                                                                                                                                                                                                                                          Melanesia                                                  111             1.3            44.6                  1.1                 8.5             10.0                      -5.9                -0.7            791             5.7            3       3        —         —         —
 Bahrain                              C                315           39.1            32.9               2.5               40.0              0.0              4.0                    5.2                ..              ..      …        …           …        2004         2004
                                                                                                                                                                                                                                                                                            Fiji                                  B                    19            2.2            47.8                  1.5                 1.8                 —                     -7.0                -8.3            165             4.8      1972       1972        …         …         …
 Cyprus                               B                154           17.5            57.2               5.7               41.1              1.5              5.0                    5.8             172             0.8     1963     1968           …        2003         2003
                                                                                                                                                                                                                                                                                            New Caledonia                         B                    60           23.6            46.6                  1.9                 6.4                     ..                 1.1                4.5             586            17.8             -       -         -         -        -
 Georgia                              B                167            4.0            57.1              -2.7              -15.6              1.0            -50.0                   -11.5            695             6.8     1999     1999           …        2006         2006
                                                                                                                                                                                                                                                                                            Papua New Guinea                     CR                    25            0.4            37.4              -0.8                   -0.2             10.0                       —                    —              13             0.2      1986       1986        …         …         …
 Iraq                                CR                 83            0.3            31.1              -8.6              -41.7             39.5           -115.4                    -3.9            389             0.6        …        …           …        2009            …
                                                                                                                                                                                                                                                                                            Solomon Islands                       B                     7            1.3            43.9                  1.5                 0.7                     ..                 —                    —              20             5.3      1995       1995        …         …         …
 Israel                              BR              2 940           40.4            55.9               2.0              333.3              9.1             17.0                    2.4            1 042            0.6     1954     1968           …        2008            …
                                                                                                                                                                                                                                                                                            Vanuatu                               B                     1            0.3            46.8              -4.9                   -0.2               0.0                      —                    —                6            1.2           …       …         …         …         …
 Jordan                              CR              2 973           45.9            49.2               4.7              405.2         2 452.0              50.0                    8.3            3 434           21.7        …        …           …        2009            …
                                                                                                                                                                                                                                                                                          Micronesia                                                 151            26.4            45.0                  0.9                 8.7               0.0                     -2.1                -3.8               7            9.0           —       —         —          1         1
 Kuwait                              CR              2 098           68.8            30.0               2.3              245.7             38.2             24.0                    8.3                ..              ..      …        …           …        2006         2006
                                                                                                                                                                                                                                                                                            Guam                                  B                    79           43.9            43.6                  0.6                 4.0                     ..                 —                    —                ..              ..           -       -         -         -        -
 Lebanon                             BR                758           17.8            49.2               1.0               19.1           472.6              -2.5                    -0.6           5 769           23.7        …        …           …        2005         2005
                                                                                                                                                                                                                                                                                            Kiribati                              B                     2            2.0            48.8              -0.2                    0.0                     ..                -0.2                -2.1               7            9.0           …       …         …      2005      2005
 Occupied Palestinian Territory       B              1 924           43.6            49.2               2.9                  —         1 836.1              -2.0                    -0.5            598            14.9          -        -            -           -           -
                                                                                                                                                                                                                                                                                            Marshall Islands                      B                     2            2.7            41.0                  0.5                 0.1                     ..                -0.5                -8.3               ..              ..         …       …         …         …         …
 Oman                                 C                826           28.4            20.8               4.3              166.8              0.0              4.0                    1.4              39             0.1        …        …           …        2005         2005
                                                                                                                                                                                                                                                                                            Micronesia (Fed. States of)           B                     3            2.4            46.4              -1.5                   -0.1               0.0                     -1.8              -16.3                ..              ..         …       …         …         …         …
 Qatar                                C              1 305           86.5            25.8              12.1              598.0              0.0           112.4                    93.9                ..              ..      …        …           …        2009            …
                                                                                                                                                                                                                                                                                            Nauru                                 C                     5           51.8            45.0                  1.5                 0.5                     ..                -0.1                -9.0               ..              ..         …       …         …         …         …
 Saudi Arabia                        CR              7 289           27.8            30.1               2.8           1 042.0            240.6              30.0                    1.2                ..              ..      …        …           …        2007         2007
                                                                                                                                                                                                                                                                                            Northern Mariana Islands              B                    55           62.0            47.4                  1.5                 4.4                     ..                 0.6                7.1                ..              ..           -       -         -         -        -
 Syrian Arab Republic                CR              2 206            9.8            49.0              10.2              839.7         1 567.6            160.0                     7.7             824             2.2        …        …        2005        2009            …
                                                                                                                                                                                                                                                                                            Palau                                 B                     6           28.1            40.2              -0.9                   -0.1                     ..                -0.1                -4.9               ..              ..         …       …         …         …         …
 Turkey                              BR              1 411            1.9            52.0               1.1              106.4             11.1             -8.9                    -0.1           1 209            0.2     1962     1968        2004        2003         2003
                                                                                                                                                                                                                                                                                          Polynesia                                                    79           11.8            46.8                  1.6                 7.4                     ..                -5.6                -8.5            885            19.3            2       2        —         —         —
 United Arab Emirates                CR              3 293           70.0            27.4               2.8              451.8              0.2             68.6                   15.6                ..              ..      …        …           …        2009            …
                                                                                                                                                                                                                                                                                            American Samoa                        B                    28           41.4            49.0                  1.3                 2.2                     ..                -0.2                -3.0               ..              ..           -       -         -         -        -
 Yemen                               BR                518            2.1            38.3               2.6               75.3           140.2             -27.0                    -1.2           1 322            5.9     1980     1980           …            …           …
                                                                                                                                                                                                                                                                                            Cook Islands                          B                     3           14.1            44.3                  0.1                 0.1                     ..                -0.1                -3.2               ..              ..           -       -         -         -        -
Europe                                              69 819            9.5            52.3               1.6           8 097.5          1 602.2          1 340.6                     1.8          125 429            0.7        42       41            2          37          36
                                                                                                                                                                                                                                                                                            French Polynesia                      B                    35           12.8            45.4                  1.4                 2.9                     ..                 —                    —             666            17.5             -       -         -         -        -
Eastern Europe                                      21 046            7.2            57.3               0.1           1 193.6              41.1            -10.2                    0.0           37 582            1.5        10       10          —             9            9
                                                                                                                                                                                                                                                                                            Niue                                  B                     0           25.6            45.9              -1.1                    0.0                     ..                -0.1              -32.4                ..              ..           -       -         -         -        -
 Belarus                              B              1 090           11.4            54.2              -0.3               43.0              0.6               —                       —             354             0.8     2001     2001           …        2003         2003
                                                                                                                                                                                                                                                                                            Pitcairn                              I                     0           12.0            33.3                  0.0                 0.0                     ..                 —                    —                ..              ..           -       -         -         -        -
 Bulgaria                             B                107            1.4            57.9               0.6                 8.7             5.1            -10.0                    -1.3           2 132            5.4     1993     1993           …        2001         2001
                                                                                                                                                                                                                                                                                            Samoa                                 B                     9            5.0            44.7                  4.5                 2.0                     ..                -3.3              -18.4             120            22.8      1988       1994        …         …         …
 Czech Republic                       B                453            4.4            53.2               0.0               17.7              2.1             45.1                    4.4            1 332            0.8     1993     1993           …            …           …
                                                                                                                                                                                                                                                                                            Tokelau                               B                     0           21.5            52.9                  0.1                 0.0                     ..                 0.0              -16.5                ..              ..           -       -         -         -        -
 Hungary                             BR                368            3.7            56.4               2.0               51.4              7.8             15.0                    1.5            2 530            1.8     1989     1989           …        2006         2006              Tonga                                 B                     1            0.8            48.7              -6.3                   -0.3                     ..                -1.8              -17.5             100            39.4           …       …         …         …         …
 Poland                               B                827            2.2            59.0               0.0               32.1             12.8            -24.0                    -0.6          10 496            2.5     1991     1991           …        2003         2003              Tuvalu                                C                     0            1.5            45.7              -3.8                    0.0                     ..                -0.1              -10.1                ..              ..    1986       1986        …         …         …
 Republic of Moldova                  B                408           11.4            56.0              -1.5              -10.9              0.1            -34.3                    -9.4           1 498           34.1     2002     2002           …        2005         2005              Wallis and Futuna Islands             B                     3           18.1            49.5                  3.3                 0.5                     ..                -0.1                -5.3               ..              ..           -       -         -         -        -


             Countries with the largest number of international migrants, 2010 (millions)                                                           Countries with the highest percentage of international migrants, 2010*                                                                                                              International migrant stock by major area                                                                                     Percentage female among the migrant stock by major area
                                                                                                                                                                                                                                                                                                            250    Oceania
             United States of America         42.8                                                                                                                        Qatar            87%                                                                                                                     Latin America and the Caribbean
                                                                                                                                                                                                                                                                                                                   Africa
                  Russian Federation          12.3                                                                                                   United Arab Emirates                                                                                                                                                                                                                                                                                     56.0
                                                                                                                                                                                           70%                                                                                                              200    Northern America
                                                                                                                                                                                                                                                                                                                                                                                                                                                                          1990             1995               2000                 2005             2010
                                                                                                                                                                                                                                                                                                                   Asia                                                                                                                                       54.0
                              Germany         10.8                                                                                                                      Kuwait             69%                                                                                                                     Europe
International Migration 2009 Wall Chart

Weitere ähnliche Inhalte

Kürzlich hochgeladen

Accessible design: Minimum effort, maximum impact
Accessible design: Minimum effort, maximum impactAccessible design: Minimum effort, maximum impact
Accessible design: Minimum effort, maximum impactdawncurless
 
Interactive Powerpoint_How to Master effective communication
Interactive Powerpoint_How to Master effective communicationInteractive Powerpoint_How to Master effective communication
Interactive Powerpoint_How to Master effective communicationnomboosow
 
Russian Escort Service in Delhi 11k Hotel Foreigner Russian Call Girls in Delhi
Russian Escort Service in Delhi 11k Hotel Foreigner Russian Call Girls in DelhiRussian Escort Service in Delhi 11k Hotel Foreigner Russian Call Girls in Delhi
Russian Escort Service in Delhi 11k Hotel Foreigner Russian Call Girls in Delhikauryashika82
 
Student login on Anyboli platform.helpin
Student login on Anyboli platform.helpinStudent login on Anyboli platform.helpin
Student login on Anyboli platform.helpinRaunakKeshri1
 
Presentation by Andreas Schleicher Tackling the School Absenteeism Crisis 30 ...
Presentation by Andreas Schleicher Tackling the School Absenteeism Crisis 30 ...Presentation by Andreas Schleicher Tackling the School Absenteeism Crisis 30 ...
Presentation by Andreas Schleicher Tackling the School Absenteeism Crisis 30 ...EduSkills OECD
 
APM Welcome, APM North West Network Conference, Synergies Across Sectors
APM Welcome, APM North West Network Conference, Synergies Across SectorsAPM Welcome, APM North West Network Conference, Synergies Across Sectors
APM Welcome, APM North West Network Conference, Synergies Across SectorsAssociation for Project Management
 
Call Girls in Dwarka Mor Delhi Contact Us 9654467111
Call Girls in Dwarka Mor Delhi Contact Us 9654467111Call Girls in Dwarka Mor Delhi Contact Us 9654467111
Call Girls in Dwarka Mor Delhi Contact Us 9654467111Sapana Sha
 
Grant Readiness 101 TechSoup and Remy Consulting
Grant Readiness 101 TechSoup and Remy ConsultingGrant Readiness 101 TechSoup and Remy Consulting
Grant Readiness 101 TechSoup and Remy ConsultingTechSoup
 
The basics of sentences session 2pptx copy.pptx
The basics of sentences session 2pptx copy.pptxThe basics of sentences session 2pptx copy.pptx
The basics of sentences session 2pptx copy.pptxheathfieldcps1
 
Measures of Dispersion and Variability: Range, QD, AD and SD
Measures of Dispersion and Variability: Range, QD, AD and SDMeasures of Dispersion and Variability: Range, QD, AD and SD
Measures of Dispersion and Variability: Range, QD, AD and SDThiyagu K
 
Z Score,T Score, Percential Rank and Box Plot Graph
Z Score,T Score, Percential Rank and Box Plot GraphZ Score,T Score, Percential Rank and Box Plot Graph
Z Score,T Score, Percential Rank and Box Plot GraphThiyagu K
 
Measures of Central Tendency: Mean, Median and Mode
Measures of Central Tendency: Mean, Median and ModeMeasures of Central Tendency: Mean, Median and Mode
Measures of Central Tendency: Mean, Median and ModeThiyagu K
 
Unit-IV- Pharma. Marketing Channels.pptx
Unit-IV- Pharma. Marketing Channels.pptxUnit-IV- Pharma. Marketing Channels.pptx
Unit-IV- Pharma. Marketing Channels.pptxVishalSingh1417
 
Nutritional Needs Presentation - HLTH 104
Nutritional Needs Presentation - HLTH 104Nutritional Needs Presentation - HLTH 104
Nutritional Needs Presentation - HLTH 104misteraugie
 
Activity 01 - Artificial Culture (1).pdf
Activity 01 - Artificial Culture (1).pdfActivity 01 - Artificial Culture (1).pdf
Activity 01 - Artificial Culture (1).pdfciinovamais
 
SOCIAL AND HISTORICAL CONTEXT - LFTVD.pptx
SOCIAL AND HISTORICAL CONTEXT - LFTVD.pptxSOCIAL AND HISTORICAL CONTEXT - LFTVD.pptx
SOCIAL AND HISTORICAL CONTEXT - LFTVD.pptxiammrhaywood
 
Sports & Fitness Value Added Course FY..
Sports & Fitness Value Added Course FY..Sports & Fitness Value Added Course FY..
Sports & Fitness Value Added Course FY..Disha Kariya
 
Arihant handbook biology for class 11 .pdf
Arihant handbook biology for class 11 .pdfArihant handbook biology for class 11 .pdf
Arihant handbook biology for class 11 .pdfchloefrazer622
 
social pharmacy d-pharm 1st year by Pragati K. Mahajan
social pharmacy d-pharm 1st year by Pragati K. Mahajansocial pharmacy d-pharm 1st year by Pragati K. Mahajan
social pharmacy d-pharm 1st year by Pragati K. Mahajanpragatimahajan3
 

Kürzlich hochgeladen (20)

Accessible design: Minimum effort, maximum impact
Accessible design: Minimum effort, maximum impactAccessible design: Minimum effort, maximum impact
Accessible design: Minimum effort, maximum impact
 
Interactive Powerpoint_How to Master effective communication
Interactive Powerpoint_How to Master effective communicationInteractive Powerpoint_How to Master effective communication
Interactive Powerpoint_How to Master effective communication
 
Russian Escort Service in Delhi 11k Hotel Foreigner Russian Call Girls in Delhi
Russian Escort Service in Delhi 11k Hotel Foreigner Russian Call Girls in DelhiRussian Escort Service in Delhi 11k Hotel Foreigner Russian Call Girls in Delhi
Russian Escort Service in Delhi 11k Hotel Foreigner Russian Call Girls in Delhi
 
Student login on Anyboli platform.helpin
Student login on Anyboli platform.helpinStudent login on Anyboli platform.helpin
Student login on Anyboli platform.helpin
 
Presentation by Andreas Schleicher Tackling the School Absenteeism Crisis 30 ...
Presentation by Andreas Schleicher Tackling the School Absenteeism Crisis 30 ...Presentation by Andreas Schleicher Tackling the School Absenteeism Crisis 30 ...
Presentation by Andreas Schleicher Tackling the School Absenteeism Crisis 30 ...
 
APM Welcome, APM North West Network Conference, Synergies Across Sectors
APM Welcome, APM North West Network Conference, Synergies Across SectorsAPM Welcome, APM North West Network Conference, Synergies Across Sectors
APM Welcome, APM North West Network Conference, Synergies Across Sectors
 
Call Girls in Dwarka Mor Delhi Contact Us 9654467111
Call Girls in Dwarka Mor Delhi Contact Us 9654467111Call Girls in Dwarka Mor Delhi Contact Us 9654467111
Call Girls in Dwarka Mor Delhi Contact Us 9654467111
 
Grant Readiness 101 TechSoup and Remy Consulting
Grant Readiness 101 TechSoup and Remy ConsultingGrant Readiness 101 TechSoup and Remy Consulting
Grant Readiness 101 TechSoup and Remy Consulting
 
The basics of sentences session 2pptx copy.pptx
The basics of sentences session 2pptx copy.pptxThe basics of sentences session 2pptx copy.pptx
The basics of sentences session 2pptx copy.pptx
 
Measures of Dispersion and Variability: Range, QD, AD and SD
Measures of Dispersion and Variability: Range, QD, AD and SDMeasures of Dispersion and Variability: Range, QD, AD and SD
Measures of Dispersion and Variability: Range, QD, AD and SD
 
Z Score,T Score, Percential Rank and Box Plot Graph
Z Score,T Score, Percential Rank and Box Plot GraphZ Score,T Score, Percential Rank and Box Plot Graph
Z Score,T Score, Percential Rank and Box Plot Graph
 
Advance Mobile Application Development class 07
Advance Mobile Application Development class 07Advance Mobile Application Development class 07
Advance Mobile Application Development class 07
 
Measures of Central Tendency: Mean, Median and Mode
Measures of Central Tendency: Mean, Median and ModeMeasures of Central Tendency: Mean, Median and Mode
Measures of Central Tendency: Mean, Median and Mode
 
Unit-IV- Pharma. Marketing Channels.pptx
Unit-IV- Pharma. Marketing Channels.pptxUnit-IV- Pharma. Marketing Channels.pptx
Unit-IV- Pharma. Marketing Channels.pptx
 
Nutritional Needs Presentation - HLTH 104
Nutritional Needs Presentation - HLTH 104Nutritional Needs Presentation - HLTH 104
Nutritional Needs Presentation - HLTH 104
 
Activity 01 - Artificial Culture (1).pdf
Activity 01 - Artificial Culture (1).pdfActivity 01 - Artificial Culture (1).pdf
Activity 01 - Artificial Culture (1).pdf
 
SOCIAL AND HISTORICAL CONTEXT - LFTVD.pptx
SOCIAL AND HISTORICAL CONTEXT - LFTVD.pptxSOCIAL AND HISTORICAL CONTEXT - LFTVD.pptx
SOCIAL AND HISTORICAL CONTEXT - LFTVD.pptx
 
Sports & Fitness Value Added Course FY..
Sports & Fitness Value Added Course FY..Sports & Fitness Value Added Course FY..
Sports & Fitness Value Added Course FY..
 
Arihant handbook biology for class 11 .pdf
Arihant handbook biology for class 11 .pdfArihant handbook biology for class 11 .pdf
Arihant handbook biology for class 11 .pdf
 
social pharmacy d-pharm 1st year by Pragati K. Mahajan
social pharmacy d-pharm 1st year by Pragati K. Mahajansocial pharmacy d-pharm 1st year by Pragati K. Mahajan
social pharmacy d-pharm 1st year by Pragati K. Mahajan
 

Empfohlen

2024 State of Marketing Report – by Hubspot
2024 State of Marketing Report – by Hubspot2024 State of Marketing Report – by Hubspot
2024 State of Marketing Report – by HubspotMarius Sescu
 
Everything You Need To Know About ChatGPT
Everything You Need To Know About ChatGPTEverything You Need To Know About ChatGPT
Everything You Need To Know About ChatGPTExpeed Software
 
Product Design Trends in 2024 | Teenage Engineerings
Product Design Trends in 2024 | Teenage EngineeringsProduct Design Trends in 2024 | Teenage Engineerings
Product Design Trends in 2024 | Teenage EngineeringsPixeldarts
 
How Race, Age and Gender Shape Attitudes Towards Mental Health
How Race, Age and Gender Shape Attitudes Towards Mental HealthHow Race, Age and Gender Shape Attitudes Towards Mental Health
How Race, Age and Gender Shape Attitudes Towards Mental HealthThinkNow
 
AI Trends in Creative Operations 2024 by Artwork Flow.pdf
AI Trends in Creative Operations 2024 by Artwork Flow.pdfAI Trends in Creative Operations 2024 by Artwork Flow.pdf
AI Trends in Creative Operations 2024 by Artwork Flow.pdfmarketingartwork
 
PEPSICO Presentation to CAGNY Conference Feb 2024
PEPSICO Presentation to CAGNY Conference Feb 2024PEPSICO Presentation to CAGNY Conference Feb 2024
PEPSICO Presentation to CAGNY Conference Feb 2024Neil Kimberley
 
Content Methodology: A Best Practices Report (Webinar)
Content Methodology: A Best Practices Report (Webinar)Content Methodology: A Best Practices Report (Webinar)
Content Methodology: A Best Practices Report (Webinar)contently
 
How to Prepare For a Successful Job Search for 2024
How to Prepare For a Successful Job Search for 2024How to Prepare For a Successful Job Search for 2024
How to Prepare For a Successful Job Search for 2024Albert Qian
 
Social Media Marketing Trends 2024 // The Global Indie Insights
Social Media Marketing Trends 2024 // The Global Indie InsightsSocial Media Marketing Trends 2024 // The Global Indie Insights
Social Media Marketing Trends 2024 // The Global Indie InsightsKurio // The Social Media Age(ncy)
 
Trends In Paid Search: Navigating The Digital Landscape In 2024
Trends In Paid Search: Navigating The Digital Landscape In 2024Trends In Paid Search: Navigating The Digital Landscape In 2024
Trends In Paid Search: Navigating The Digital Landscape In 2024Search Engine Journal
 
5 Public speaking tips from TED - Visualized summary
5 Public speaking tips from TED - Visualized summary5 Public speaking tips from TED - Visualized summary
5 Public speaking tips from TED - Visualized summarySpeakerHub
 
ChatGPT and the Future of Work - Clark Boyd
ChatGPT and the Future of Work - Clark Boyd ChatGPT and the Future of Work - Clark Boyd
ChatGPT and the Future of Work - Clark Boyd Clark Boyd
 
Getting into the tech field. what next
Getting into the tech field. what next Getting into the tech field. what next
Getting into the tech field. what next Tessa Mero
 
Google's Just Not That Into You: Understanding Core Updates & Search Intent
Google's Just Not That Into You: Understanding Core Updates & Search IntentGoogle's Just Not That Into You: Understanding Core Updates & Search Intent
Google's Just Not That Into You: Understanding Core Updates & Search IntentLily Ray
 
Time Management & Productivity - Best Practices
Time Management & Productivity -  Best PracticesTime Management & Productivity -  Best Practices
Time Management & Productivity - Best PracticesVit Horky
 
The six step guide to practical project management
The six step guide to practical project managementThe six step guide to practical project management
The six step guide to practical project managementMindGenius
 
Beginners Guide to TikTok for Search - Rachel Pearson - We are Tilt __ Bright...
Beginners Guide to TikTok for Search - Rachel Pearson - We are Tilt __ Bright...Beginners Guide to TikTok for Search - Rachel Pearson - We are Tilt __ Bright...
Beginners Guide to TikTok for Search - Rachel Pearson - We are Tilt __ Bright...RachelPearson36
 

Empfohlen (20)

2024 State of Marketing Report – by Hubspot
2024 State of Marketing Report – by Hubspot2024 State of Marketing Report – by Hubspot
2024 State of Marketing Report – by Hubspot
 
Everything You Need To Know About ChatGPT
Everything You Need To Know About ChatGPTEverything You Need To Know About ChatGPT
Everything You Need To Know About ChatGPT
 
Product Design Trends in 2024 | Teenage Engineerings
Product Design Trends in 2024 | Teenage EngineeringsProduct Design Trends in 2024 | Teenage Engineerings
Product Design Trends in 2024 | Teenage Engineerings
 
How Race, Age and Gender Shape Attitudes Towards Mental Health
How Race, Age and Gender Shape Attitudes Towards Mental HealthHow Race, Age and Gender Shape Attitudes Towards Mental Health
How Race, Age and Gender Shape Attitudes Towards Mental Health
 
AI Trends in Creative Operations 2024 by Artwork Flow.pdf
AI Trends in Creative Operations 2024 by Artwork Flow.pdfAI Trends in Creative Operations 2024 by Artwork Flow.pdf
AI Trends in Creative Operations 2024 by Artwork Flow.pdf
 
Skeleton Culture Code
Skeleton Culture CodeSkeleton Culture Code
Skeleton Culture Code
 
PEPSICO Presentation to CAGNY Conference Feb 2024
PEPSICO Presentation to CAGNY Conference Feb 2024PEPSICO Presentation to CAGNY Conference Feb 2024
PEPSICO Presentation to CAGNY Conference Feb 2024
 
Content Methodology: A Best Practices Report (Webinar)
Content Methodology: A Best Practices Report (Webinar)Content Methodology: A Best Practices Report (Webinar)
Content Methodology: A Best Practices Report (Webinar)
 
How to Prepare For a Successful Job Search for 2024
How to Prepare For a Successful Job Search for 2024How to Prepare For a Successful Job Search for 2024
How to Prepare For a Successful Job Search for 2024
 
Social Media Marketing Trends 2024 // The Global Indie Insights
Social Media Marketing Trends 2024 // The Global Indie InsightsSocial Media Marketing Trends 2024 // The Global Indie Insights
Social Media Marketing Trends 2024 // The Global Indie Insights
 
Trends In Paid Search: Navigating The Digital Landscape In 2024
Trends In Paid Search: Navigating The Digital Landscape In 2024Trends In Paid Search: Navigating The Digital Landscape In 2024
Trends In Paid Search: Navigating The Digital Landscape In 2024
 
5 Public speaking tips from TED - Visualized summary
5 Public speaking tips from TED - Visualized summary5 Public speaking tips from TED - Visualized summary
5 Public speaking tips from TED - Visualized summary
 
ChatGPT and the Future of Work - Clark Boyd
ChatGPT and the Future of Work - Clark Boyd ChatGPT and the Future of Work - Clark Boyd
ChatGPT and the Future of Work - Clark Boyd
 
Getting into the tech field. what next
Getting into the tech field. what next Getting into the tech field. what next
Getting into the tech field. what next
 
Google's Just Not That Into You: Understanding Core Updates & Search Intent
Google's Just Not That Into You: Understanding Core Updates & Search IntentGoogle's Just Not That Into You: Understanding Core Updates & Search Intent
Google's Just Not That Into You: Understanding Core Updates & Search Intent
 
How to have difficult conversations
How to have difficult conversations How to have difficult conversations
How to have difficult conversations
 
Introduction to Data Science
Introduction to Data ScienceIntroduction to Data Science
Introduction to Data Science
 
Time Management & Productivity - Best Practices
Time Management & Productivity -  Best PracticesTime Management & Productivity -  Best Practices
Time Management & Productivity - Best Practices
 
The six step guide to practical project management
The six step guide to practical project managementThe six step guide to practical project management
The six step guide to practical project management
 
Beginners Guide to TikTok for Search - Rachel Pearson - We are Tilt __ Bright...
Beginners Guide to TikTok for Search - Rachel Pearson - We are Tilt __ Bright...Beginners Guide to TikTok for Search - Rachel Pearson - We are Tilt __ Bright...
Beginners Guide to TikTok for Search - Rachel Pearson - We are Tilt __ Bright...
 

International Migration 2009 Wall Chart

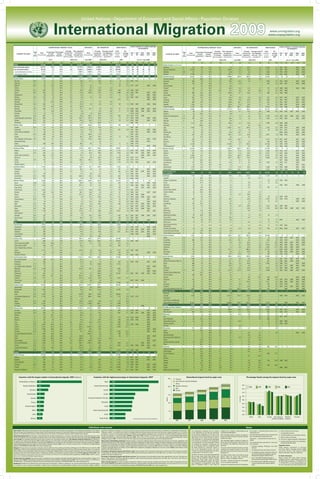
  • 1. United Nations • Department of Economic and Social Affairs • Population Division International Migration 2009 www.unmigration.org www.unpopulation.org states partIes to unIted natIons states partIes to unIted natIons InternatIonal mIgrant stock refugees net mIgratIon remIttances InternatIonal mIgrant stock refugees net mIgratIon remIttances Instruments Instruments average net migration average average annual total per- average net migration average average annual total per- type percentage percentage type percentage percentage total annual rate among the total annual net net migration (millions centage 1951 1967 1990 2000 2000 total annual rate among the total annual net net migration (millions centage 1951 1967 1990 2000 2000 country or area of of total female country or area of of total female (thousands) of change foreign-born (thousands) migration rate (per 1,000 of US of total rc rp mWc Htp msp (thousands) of change foreign-born (thousands) migration rate (per 1,000 of US of total rc rp mWc Htp msp data population migrants data population migrants (percentage) (thousands) (thousands) population) dollars) gdp (percentage) (thousands) (thousands) population) dollars) gdp 2010 2005-2010 end-2008 2005-2010 2007 (as of 1 July 2009) 2010 2005-2010 end-2008 2005-2010 2007 (as of 1 July 2009) (1) (2) (3) (4) (5) (6) (7) (8) (9) (10) (11) (12) (13) (14) (15) (1) (2) (3) (4) (5) (6) (7) (8) (9) (10) (11) (12) (13) (14) (15) World 213 944 3.1 49.0 1.8 24 359.8 15 150.4 — — 380 050 0.7 144 144 41 131 115 Eastern Europe (continued) More developed regions 127 711 10.3 51.5 1.7 14 715.3 2 081.0 2 700.5 2.2 134 457 0.4 46 46 2 41 40 Romania B 133 0.6 51.3 -0.1 5.3 1.6 -40.0 -1.9 8 539 5.1 1991 1991 … 2002 2002 Less developed regions 86 232 1.5 45.3 2.0 9 644.5 13 069.4 - 2 700.5 -0.5 245 593 1.9 98 98 39 90 75 Russian Federation B 12 270 8.7 57.8 0.3 853.9 3.5 50.0 0.4 4 713 0.4 1993 1993 … 2004 2004 Least developed countries 11 531 1.3 47.4 1.1 1 089.9 1 880.8 - 314.6 -0.4 17 334 5.4 39 38 10 27 23 Slovakia BR 131 2.4 56.0 1.0 10.8 0.3 4.0 0.7 1 483 2.0 1993 1993 … 2004 2004 Sub-Saharan Africa 18 007 2.1 47.2 1.7 2 245.2 2 133.4 - 360.5 -0.4 18 615 2.5 44 44 12 32 28 Ukraine B 5 258 11.6 57.2 -0.5 181.7 7.2 -16.0 -0.3 4 503 3.2 2002 2002 … 2004 2004 Africa 19 263 1.9 46.8 1.7 2 326.8 2 332.9 - 532.0 -0.5 36 853 3.1 48 48 16 36 32 Northern Europe 10 657 10.8 53.0 2.5 1 588.8 445.8 285.8 2.9 14 453 0.3 10 10 — 8 8 Eastern Africa 5 034 1.5 49.6 -0.4 151.7 1 074.6 -323.9 -1.1 2 901 2.5 14 13 3 10 10 Channel Islands6 B 75 49.8 53.0 1.8 8.8 .. 0.3 2.0 .. .. - - - - - Burundi BR 61 0.7 54.6 -5.9 -16.6 21.1 64.6 8.1 0 0.0 1963 1971 … … … Denmark B 484 8.8 51.0 2.8 78.9 23.4 6.0 1.1 1 028 0.3 1952 1968 … 2003 2006 Comoros B 14 2.0 53.3 -0.2 0.2 — -2.0 -3.1 12 2.7 … … … … … Estonia B 182 13.6 59.6 -2.0 -9.7 0.0 — — 426 2.0 1997 1997 … 2004 2004 Djibouti BR 114 13.0 45.9 0.7 8.3 9.2 — — 29 3.4 1977 1977 … 2005 2005 Faeroe Islands B 3 6.5 43.8 1.5 0.3 .. — — .. .. - - - - - Eritrea I 16 0.3 45.9 2.4 2.3 4.9 11.0 2.3 .. .. … … … … … Finland7 B 226 4.2 50.5 5.5 60.2 6.6 11.0 2.1 772 0.3 1968 1968 … 2006 2006 Ethiopia BR 548 0.6 47.1 -0.2 18.4 83.6 -60.0 -0.8 358 1.8 1969 1969 … … … Iceland B 37 11.3 49.4 10.0 15.2 0.0 4.0 12.8 41 0.2 1955 1968 … … … Kenya BR 818 2.0 50.8 0.7 61.8 320.6 -37.9 -1.0 1 588 6.6 1966 1981 … 2005 2005 Ireland B 899 19.6 49.6 7.5 295.8 9.7 40.0 9.1 580 0.2 1956 1968 … … … Madagascar C 38 0.2 46.1 -1.0 -0.6 — -1.0 -0.1 11 0.1 1967 … … 2005 2005 Isle of Man B 44 54.6 50.6 1.1 4.0 .. — — .. .. - - - - - Malawi BR 276 1.8 51.6 -0.2 9.8 4.2 -4.0 -0.3 1 0.0 1987 1987 … 2005 2005 Latvia B 335 15.0 59.3 -2.5 -25.4 0.0 -2.0 -0.9 552 2.0 1997 1997 … 2004 2003 Mauritius1 B 43 3.3 63.3 1.0 3.1 — — — 215 3.2 … … … 2003 2003 Lithuania B 129 4.0 56.6 -5.0 -28.6 0.8 -20.0 -6.0 1 433 3.7 1997 1997 … 2003 2003 Mayotte B 72 36.0 49.9 4.6 15.4 .. 0.7 3.9 .. .. - - - - - Norway8 B 485 10.0 51.2 5.4 126.8 36.1 27.0 5.7 613 0.2 1953 1967 … 2003 2003 Mozambique BR 450 1.9 52.1 2.1 67.8 3.2 -4.0 -0.2 99 1.3 1983 1989 … 2006 2006 Sweden B 1 306 14.1 52.2 3.2 234.4 77.0 30.0 3.3 775 0.2 1954 1967 … 2004 2006 Réunion B 175 20.9 50.2 4.0 34.6 .. — — .. .. - - - - - United Kingdom B 6 452 10.4 53.5 2.0 828.2 292.1 189.5 3.1 8 234 0.3 1954 1968 … 2006 2006 Rwanda BR 465 4.5 53.9 1.3 53.1 55.1 3.0 0.3 51 1.5 1980 1980 2008 2003 2006 Southern Europe 14 664 9.5 50.1 5.2 3 771.4 191.0 738.7 4.9 32 141 0.8 13 13 2 11 11 Seychelles B 11 12.8 42.5 5.0 2.6 .. -0.4 -4.8 11 1.5 1980 1980 1994 2004 2004 Albania C 89 2.8 53.1 1.5 8.3 0.1 -15.0 -4.8 1 468 13.6 1992 1992 2007 2002 2002 Somalia IR 23 0.2 45.9 1.4 2.8 1.8 -50.0 -5.6 .. .. 1978 1978 … … … Andorra C 56 64.4 47.3 2.1 6.8 .. 1.1 13.3 .. .. … … … … … Uganda BR 647 1.9 49.9 -0.2 25.0 162.1 -27.0 -0.9 452 3.8 1976 1976 1995 … … Bosnia and Herzegovina IR 28 0.7 50.3 -4.7 -6.1 7.3 -2.0 -0.5 2 700 17.8 1993 1993 1996 2002 2002 United Republic of Tanzania BR 659 1.5 50.4 -3.8 -104.7 321.9 -60.0 -1.4 14 0.1 1964 1968 … 2006 2006 Croatia BR 700 15.9 53.0 1.1 66.6 1.6 2.0 0.5 1 394 2.7 1992 1992 … 2003 2003 Zambia BR 233 1.8 49.6 -4.2 -35.8 83.5 -17.0 -1.4 59 0.5 1969 1969 … 2005 2005 Gibraltar B 9 29.8 51.5 0.1 0.4 .. — — .. .. - - - - - Zimbabwe BR 372 2.9 37.8 -1.0 4.0 3.5 -140.0 -11.1 .. .. 1981 1981 … … … Greece C 1 133 10.1 44.6 3.0 194.6 2.2 30.0 2.7 2 484 0.8 1960 1968 … … … Middle Africa 1 615 1.3 48.5 0.6 135.7 620.6 -30.2 -0.2 195 0.5 9 9 — 5 4 Holy See9 I 1 100.0 52.5 0.1 0.1 .. 0.0 14.3 .. .. 1956 1967 … … … Angola BR 65 0.3 53.0 3.1 12.8 12.7 16.0 0.9 .. .. 1981 1981 … … … Italy B 4 463 7.4 53.1 7.5 1 508.1 47.1 330.0 5.6 3 165 0.2 1954 1972 … 2006 2006 Cameroon B 197 1.0 45.7 -1.5 -4.2 81.0 -3.8 -0.2 167 0.8 1961 1967 … 2006 2006 Malta C 15 3.8 51.6 5.6 4.1 4.3 1.0 2.5 43 0.6 1971 1971 … 2003 2003 Central African Republic C 80 1.8 46.6 1.2 9.6 7.4 1.0 0.2 .. .. 1962 1967 … 2006 2006 Montenegro B 43 6.8 61.5 -5.0 -10.0 24.7 -1.0 -1.6 .. .. 2006 2006 … 2006 2006 Chad BR 388 3.4 48.0 1.6 51.9 330.5 -15.0 -1.4 .. .. 1981 1981 … … … Portugal B 919 8.6 50.3 3.7 183.5 0.4 40.0 3.8 3 941 1.8 1960 1976 … 2004 2004 Congo B 143 3.8 49.4 2.1 20.5 24.8 -10.0 -2.8 15 0.2 1962 1970 … … … San Marino B 12 37.0 53.5 0.5 0.6 .. 0.2 6.5 .. .. … … … … … Dem. Republic of the Congo BR 445 0.7 53.1 -1.5 -5.4 155.2 -20.0 -0.3 .. .. 1965 1975 … 2005 2005 Serbia B 525 5.3 56.7 -5.0 -120.5 96.7 — — 5 577 13.9 2001 2001 … 2001 2001 Equatorial Guinea C 7 1.1 47.0 5.0 2.0 — 2.0 3.1 .. .. 1986 1986 … 2003 … Slovenia B 164 8.1 46.6 -0.4 2.4 0.3 4.4 2.2 284 0.6 1992 1992 … 2004 2004 Gabon C 284 18.9 43.0 3.0 48.5 9.0 1.0 0.7 11 0.1 1964 1973 … … … Spain B 6 378 14.1 47.9 6.5 1 918.9 4.7 350.0 7.9 10 739 0.7 1978 1978 … 2002 2002 Sao Tome and Principe C 5 3.2 48.0 -0.5 0.0 — -1.4 -8.8 2 1.4 1978 1978 … 2006 2006 TFYR Macedonia10 BR 130 6.3 58.3 1.5 13.4 1.7 -2.0 -1.0 345 4.5 1994 1994 … 2005 2005 Northern Africa 2 010 0.9 43.4 1.8 219.8 381.1 -144.5 -0.7 20 007 4.2 5 5 4 4 4 Western Europe 23 453 12.4 49.0 0.7 1 543.7 924.3 326.3 1.7 41 254 0.5 9 8 — 9 8 Algeria CR 242 0.7 45.2 0.0 4.3 94.1 -28.0 -0.8 2 120 1.6 1963 1967 2005 2004 2004 Austria B 1 310 15.6 50.5 2.5 193.5 37.6 32.0 3.9 2 965 0.8 1954 1973 … 2005 2007 Egypt BR 245 0.3 46.6 -0.2 3.4 97.9 -68.0 -0.8 7 656 5.9 1981 1981 1993 2004 2005 Belgium C 975 9.1 49.4 2.0 124.5 17.0 40.0 3.8 8 557 1.9 1953 1969 … 2004 2004 Libyan Arab Jamahiriya C 682 10.4 35.5 2.0 74.7 6.7 4.0 0.6 16 0.0 … … 2004 2004 2004 France B 6 685 10.7 51.3 0.6 412.0 160.0 100.0 1.6 13 745 0.5 1954 1971 … 2002 2002 Morocco C 49 0.2 49.7 -0.8 -0.8 0.8 -85.0 -2.7 6 730 9.0 1956 1971 1993 … … Germany B 10 758 13.1 46.7 0.3 563.7 582.7 110.0 1.3 9 839 0.3 1953 1969 … 2006 2006 Sudan BR 753 1.7 48.2 3.3 138.2 181.6 27.0 0.7 1 769 3.8 1974 1974 … … … Liechtenstein C 13 34.6 48.3 1.1 1.0 0.1 0.2 5.6 .. .. 1957 1968 … 2008 2008 Tunisia C 34 0.3 49.3 -0.8 -0.5 0.1 -4.0 -0.4 1 716 4.9 1957 1968 … 2003 2003 Luxembourg B 173 35.2 50.2 2.1 21.8 3.1 4.0 8.4 1 565 3.2 1953 1971 … 2009 … Western Sahara I 4 0.8 43.1 2.1 0.5 .. 9.5 19.6 .. .. - - - - - Monaco B 24 71.6 50.6 0.8 1.9 .. 0.1 2.1 .. .. 1954 … … 2001 2001 Southern Africa 2 163 3.7 43.3 7.3 738.1 54.1 134.4 2.4 1 535 0.5 5 5 1 4 4 Netherlands B 1 753 10.5 52.1 0.2 71.3 77.6 20.0 1.2 2 548 0.3 1956 1968 … 2005 2005 Botswana C 115 5.8 46.3 7.2 38.1 3.0 3.0 1.6 141 1.1 1969 1969 … 2002 2002 Switzerland B 1 763 23.2 49.7 1.2 153.9 46.1 20.0 2.7 2 035 0.5 1955 1968 … 2006 2006 Lesotho CR 6 0.3 45.5 0.3 0.5 — -7.2 -3.5 443 27.7 1981 1981 2005 2003 2004 Latin America and 7 480 1.3 50.1 1.7 769.1 350.3 - 1 049.1 -1.8 63 435 1.8 27 27 15 26 23 Namibia B 139 6.3 47.6 1.1 11.4 6.8 -0.2 -0.1 16 0.2 1995 1995 … 2002 2002 the Caribbean South Africa BR 1 863 3.7 42.7 8.0 684.0 43.5 140.0 2.8 834 0.3 1996 1996 … 2004 2004 Caribbean 1 379 3.3 48.7 0.9 94.9 0.6 -124.6 -3.0 7 278 8.0 9 8 1 6 6 Swaziland BR 40 3.4 47.7 0.9 4.0 0.8 -1.2 -1.0 100 3.5 2000 1969 … … … Anguilla B 6 39.2 55.0 3.5 1.1 .. 0.2 13.7 .. .. - - - - - Western Africa 8 440 2.8 46.5 1.8 1 081.6 202.4 -167.9 -0.6 12 216 4.9 15 16 8 13 10 Antigua and Barbuda B 21 23.6 56.2 2.8 3.2 .. — — 24 2.0 1995 1995 … … … Benin CBR 232 2.5 45.5 4.3 50.9 6.9 10.0 1.2 224 4.1 1962 1970 … 2004 2004 Aruba B 34 31.9 55.4 0.5 1.7 .. 0.8 7.7 13 0.3 - - - - - Burkina Faso BR 1 043 6.4 50.8 6.0 307.5 0.6 -13.0 -0.9 50 0.7 1980 1980 2003 2002 2002 Bahamas B 33 9.7 48.5 1.1 2.5 .. 0.4 1.2 .. .. 1993 1993 … 2008 2008 Cape Verde B 12 2.4 50.4 1.5 1.1 .. -2.5 -5.1 139 9.7 … 1987 1997 2004 2004 Barbados B 28 10.9 60.7 1.4 2.6 .. -0.3 -1.0 140 4.1 … … … … … Côte d’Ivoire CB 2 407 11.2 45.1 0.3 131.4 24.8 -29.0 -1.4 179 0.9 1961 1970 … … … British Virgin Islands B 9 36.6 48.6 0.1 0.2 .. — — .. .. - - - - - Gambia B 290 16.6 50.5 4.5 68.1 14.8 3.0 1.8 47 7.4 1966 1967 … 2003 2003 Cayman Islands B 36 63.0 48.4 1.0 2.3 .. 0.4 7.3 .. .. - - - - - Ghana B 1 852 7.6 41.8 2.1 251.5 18.2 -10.3 -0.4 117 0.8 1963 1968 2000 … … Cuba B 15 0.1 28.9 -0.1 0.3 0.5 -38.8 -3.5 .. .. … … … … … Guinea CR 395 3.8 53.1 -0.3 9.8 21.5 -60.0 -6.1 151 3.3 1965 1968 2000 2004 2005 Dominica B 6 8.3 45.6 3.9 1.1 .. -0.6 -9.0 26 7.9 1994 1994 … … … Guinea-Bissau BR 19 1.2 50.0 0.0 1.2 7.9 -2.5 -1.6 29 8.1 1976 1976 … 2007 … Dominican Republic B 434 4.2 41.0 2.0 50.2 .. -28.0 -2.8 3 414 9.3 1978 1978 … 2008 2007 Liberia B 96 2.3 45.1 -0.1 3.3 10.2 49.6 13.3 65 8.8 1964 1980 … 2004 2004 Grenada B 13 12.1 54.2 3.0 2.0 .. -1.0 -9.7 55 9.2 … … … 2004 2004 Mali BR 163 1.2 47.6 -0.3 6.9 9.6 -40.3 -3.2 344 5.0 1973 1973 2003 2002 2002 Guadeloupe B 105 22.5 52.7 2.3 14.2 .. -0.7 -1.5 .. .. - - - - - Mauritania CR 99 2.9 42.2 8.1 35.7 27.0 2.0 0.6 2 0.1 1987 1987 2007 2005 2005 Haiti B 35 0.3 43.2 3.0 5.9 0.0 -28.0 -2.9 1 222 18.2 1984 1984 … … … Niger BR 202 1.3 53.9 2.0 29.4 0.3 -5.7 -0.4 78 1.9 1961 1970 2009 2004 … Jamaica B 30 1.1 49.4 2.0 3.5 .. -20.0 -7.4 2 144 18.8 1964 1980 2008 2003 2003 Nigeria CR 1 128 0.7 47.4 3.0 214.2 10.1 -60.0 -0.4 9 221 5.6 1967 1968 … 2001 2001 Martinique B 71 17.6 54.4 2.0 8.7 .. -0.4 -1.0 .. .. - - - - - Saint Helena2 B 0 9.7 49.4 0.5 0.0 .. -0.1 -21.9 .. .. - - - - - Montserrat B 0 1.8 46.3 -0.4 0.0 .. — — .. .. - - - - - Senegal BR 210 1.6 51.2 -0.9 -1.3 33.2 -20.0 -1.7 1 192 10.7 1963 1967 1999 2003 2003 Netherlands Antilles B 53 26.4 56.8 2.6 7.7 .. 1.7 8.7 32 1.2 - - - - - Sierra Leone BR 107 1.8 45.7 -7.1 -36.4 7.8 12.0 2.2 148 8.9 1981 1981 … … … Puerto Rico B 324 8.1 52.7 -1.7 -18.3 .. -4.3 -1.1 .. .. - - - - - Togo BR 185 2.7 50.2 0.3 8.1 9.4 -1.1 -0.2 229 9.2 1962 1969 … 2009 … Saint Kitts and Nevis B 5 9.6 46.3 2.2 0.6 .. — — 37 7.1 2002 … … 2004 2004 Asia 61 324 1.5 44.6 2.1 6 768.6 10 378.2 - 1 075.7 -0.3 145 200 1.1 19 19 8 27 19 Saint Lucia B 10 5.9 51.3 3.2 1.7 — -0.2 -1.2 31 3.2 … … … … … Central Asia 4 970 8.1 55.2 -0.4 84.5 7.4 -160.0 -2.7 2 629 2.3 4 4 2 5 4 Saint Vincent and the B 9 7.9 51.9 3.0 1.4 .. -1.0 -9.2 31 5.5 1993 2003 … … … Grenadines Kazakhstan B 3 079 19.5 54.0 0.7 228.4 4.4 -20.0 -1.3 223 0.2 1999 1999 … 2008 2008 Trinidad and Tobago B 34 2.6 54.0 -1.9 -2.4 0.0 -4.0 -3.0 109 0.5 2000 2000 … 2007 2007 Kyrgyzstan B 223 4.0 58.2 -5.1 -57.6 0.4 -15.0 -2.8 715 19.1 1996 1996 2003 2003 2003 Turks and Caicos Islands B 6 19.0 48.6 1.0 0.4 .. — — .. .. - - - - - Tajikistan B 284 4.0 57.1 -1.5 -14.9 1.8 -40.0 -5.9 1 691 45.5 1993 1993 2002 2002 2002 United States Virgin Islands B 62 56.5 53.3 0.9 4.1 .. -0.8 -7.3 .. .. - - - - - Turkmenistan B 208 4.0 57.1 -1.5 -9.8 0.1 -5.0 -1.0 .. .. 1998 1998 … 2005 2005 Central America 1 547 1.0 50.0 2.9 229.2 36.7 -634.0 -4.3 39 356 3.4 8 8 6 8 7 Uzbekistan B 1 176 4.2 57.1 -1.5 -61.7 0.8 -80.0 -3.0 .. .. … … … 2008 … Belize BR 47 15.0 52.1 2.8 6.7 0.3 -0.2 -0.7 75 5.9 1990 1990 2001 2003 2006 Eastern Asia 6 485 0.4 55.0 0.9 460.5 303.3 -291.5 -0.2 36 448 0.4 3 3 — 1 1 3 Costa Rica BR 489 10.5 50.0 2.0 53.3 18.1 6.0 1.3 635 2.4 1978 1978 … 2003 2003 China I 686 0.1 50.0 3.0 110.8 301.0 -346.2 -0.3 32 833 1.0 1982 1982 … … … El Salvador BR 40 0.7 52.5 2.3 5.4 0.0 -55.9 -9.1 3 711 18.2 1983 1983 2003 2004 2004 China, Hong Kong SAR4 B 2 742 38.8 57.0 0.2 81.1 0.1 22.7 3.3 317 0.2 - - - - - Guatemala BR 59 0.4 54.4 2.1 7.1 0.1 -40.0 -3.0 4 254 12.6 1983 1983 2003 2004 2004 China, Macao SAR5 B 300 54.7 51.7 1.5 26.2 .. 10.0 19.3 399 2.1 - - - - - Honduras BR 24 0.3 48.4 -1.6 -1.5 0.0 -20.0 -2.8 2 625 21.5 1992 1992 2005 2008 … Dem. People’s Rep. of Korea I 37 0.2 53.1 0.2 1.7 .. — — .. .. … … … … … Mexico BR 726 0.7 49.4 3.6 131.7 1.1 -486.0 -4.5 27 136 2.7 2000 2000 1999 2003 2003 Japan C 2 176 1.7 55.0 1.7 244.6 2.0 30.0 0.2 1 577 0.0 1981 1982 … … … Nicaragua BR 40 0.7 48.3 2.8 5.8 0.1 -40.0 -7.1 740 12.9 1980 1980 2005 2004 2006 Mongolia C 10 0.4 54.0 2.0 1.2 0.0 -2.0 -0.8 194 4.9 … … … 2008 2008 Panama B 121 3.4 51.3 3.4 20.7 16.9 2.2 0.7 180 0.9 1978 1978 … 2004 2004 Republic of Korea B 535 1.1 52.7 -0.6 -5.2 0.2 -6.0 -0.1 1 128 0.1 1992 1992 … … … South America 4 554 1.2 50.5 1.6 445.0 313.0 -290.6 -0.8 16 800 0.7 10 11 8 12 10 South-Eastern Asia 6 715 1.1 49.6 3.5 1 212.2 152.6 -293.3 -0.5 31 893 2.9 3 3 2 5 4 Argentina B 1 449 3.6 53.4 -0.6 -1.9 2.8 6.0 0.2 607 0.2 1961 1967 2007 2002 2002 Brunei Darussalam B 148 36.4 45.5 3.5 25.3 .. 0.7 1.8 .. .. … … … … … Bolivia (Plurinational State of) B 146 1.5 47.7 4.9 35.1 0.7 -20.0 -2.1 927 7.1 1982 1982 2000 2006 … Cambodia C 336 2.2 51.7 2.0 41.4 0.2 -1.0 -0.1 353 4.2 1992 1992 … 2007 2005 Brazil B 688 0.4 46.3 0.0 18.2 3.9 -45.8 -0.2 4 382 0.3 1960 1972 … 2004 2004 Indonesia CR 123 0.1 44.5 -2.0 -9.5 0.4 -146.0 -0.6 6 174 1.4 … … … … … Chile B 320 1.9 53.5 6.5 93.5 1.6 6.0 0.4 3 0.0 1972 1972 2005 2004 2004 Lao People’s Dem. Republic CR 19 0.3 48.0 -1.4 -0.8 — -15.0 -2.4 1 0.0 … … … 2003 2003 Colombia B 110 0.2 47.9 0.1 2.6 0.2 -24.0 -0.5 4 523 2.2 1961 1980 1995 2004 … Malaysia BR 2 358 8.4 45.2 3.0 362.6 36.7 26.0 1.0 1 803 1.0 … … … 2009 … Ecuador BR 394 2.9 48.4 23.2 272.4 101.4 -70.0 -5.2 3 094 7.0 1955 1969 2002 2002 2002 Myanmar C 89 0.2 48.7 -1.0 -1.1 — -100.0 -2.0 125 0.6 … … … 2004 2004 Falkland Islands (Malvinas) B 2 57.0 40.4 1.0 0.1 .. — — .. .. - - - - - Philippines CR 435 0.5 51.1 3.0 67.4 0.1 -180.0 -2.0 16 302 11.3 1981 1981 1995 2002 2002 French Guiana B 108 46.5 50.0 1.5 9.3 .. 1.2 5.5 .. .. - - - - - Singapore B 1 967 40.7 56.0 5.5 501.0 0.0 100.0 22.0 .. .. … … … … … Guyana B 12 1.5 46.5 3.0 1.9 .. -8.0 -10.5 278 25.8 … … … 2004 2008 Thailand BR 1 157 1.7 48.4 3.3 207.9 112.9 60.0 0.9 1 635 0.7 … … … … … Paraguay B 161 2.5 48.3 -0.8 -3.4 0.1 -8.0 -1.3 484 4.0 1970 1970 2008 2004 2008 Timor-Leste B 14 1.2 52.6 3.0 2.3 0.0 2.0 1.8 .. .. 2003 2003 2004 … … Peru B 38 0.1 52.4 -2.0 -3.1 1.1 -125.0 -4.4 2 131 2.0 1964 1983 2005 2002 2002 Viet Nam CR 69 0.1 36.6 4.8 15.9 2.4 -40.0 -0.5 5 500 8.0 … … … … … Suriname C 39 7.5 45.4 3.0 6.5 0.0 -1.0 -2.0 140 6.2 1978 1978 … 2007 2007 Southern Asia 14 304 0.8 44.6 0.6 841.2 3 099.1 -575.1 -0.3 56 605 3.3 2 2 1 — — Uruguay B 80 2.4 54.0 -1.0 -1.3 0.1 -10.0 -3.0 96 0.4 1970 1970 2001 2005 2005 Afghanistan B 91 0.3 43.6 1.0 10.6 0.0 200.0 7.5 .. .. 2005 2005 … … … Venezuela (Bolivarian Rep. of) B 1 007 3.5 50.1 -0.1 15.2 201.2 8.0 0.3 136 0.1 … 1986 … 2002 2005 Bangladesh BR 1 085 0.7 13.9 1.0 79.8 28.4 -114.0 -0.7 6 562 9.6 … … … … … Northern America 50 042 14.2 50.1 1.9 5 760.4 453.2 1 219.9 3.6 2 972 0.0 1 2 — 2 2 Bhutan B 40 5.7 18.5 1.5 3.9 .. 2.0 2.9 .. .. … … … … … Bermuda B 20 30.7 51.7 1.2 1.8 .. — — .. .. - - - - - India BR 5 436 0.4 48.7 -1.6 -265.8 184.5 -200.0 -0.2 38 666 3.3 … … … … … Canada B 7 202 21.3 52.2 2.7 1 071.3 173.7 210.0 6.3 .. .. 1969 1969 … 2002 2002 Iran (Islamic Republic of) BR 2 129 2.8 38.8 0.6 111.4 980.1 -100.0 -1.4 1 115 0.4 1976 1976 … … … Greenland B 6 10.2 32.9 -2.8 -0.7 .. -0.4 -7.0 .. .. - - - - - Maldives I 3 1.0 44.7 0.8 0.2 .. — — 3 0.3 … … … … … Saint Pierre and Miquelon B 1 16.9 47.2 -2.0 -0.1 .. -0.1 -15.6 .. .. - - - - - Nepal BR 946 3.2 68.2 2.9 146.8 124.8 -20.0 -0.7 1 734 16.8 … … … … … United States of America B 42 813 13.5 49.8 1.7 4 688.0 279.5 1 010.4 3.3 2 972 0.0 … 1968 … 2005 2005 Pakistan BR 4 234 2.3 44.7 3.5 771.9 1 780.9 -283.1 -1.6 5 998 4.2 … … … … … Oceania 6 015 16.8 51.2 1.7 637.3 33.6 96.4 2.8 6 161 0.6 7 7 — 3 3 Sri Lanka C 340 1.7 49.8 -1.5 -17.6 0.3 -60.0 -3.0 2 527 7.8 … … 1996 … … Australia and New Zealand 5 674 22.0 51.6 1.8 612.7 23.6 110.0 4.4 4 478 0.5 2 2 — 2 2 Western Asia 28 850 12.4 39.3 3.3 4 170.2 6 815.8 244.3 1.1 17 626 1.6 7 7 3 16 10 Australia11 B 4 711 21.9 51.4 1.7 485.8 20.9 100.0 4.8 3 828 0.5 1954 1973 … 2005 2004 Armenia BR 324 10.5 58.9 -8.4 -152.7 4.0 -15.0 -4.9 846 9.2 1993 1993 … 2003 2003 New Zealand B 962 22.4 52.4 2.3 126.9 2.7 10.0 2.4 650 0.5 1960 1973 … 2002 2002 Azerbaijan BR 264 3.0 57.1 0.7 15.8 2.1 -10.0 -1.2 1 287 4.1 1993 1993 1999 2003 2003 Melanesia 111 1.3 44.6 1.1 8.5 10.0 -5.9 -0.7 791 5.7 3 3 — — — Bahrain C 315 39.1 32.9 2.5 40.0 0.0 4.0 5.2 .. .. … … … 2004 2004 Fiji B 19 2.2 47.8 1.5 1.8 — -7.0 -8.3 165 4.8 1972 1972 … … … Cyprus B 154 17.5 57.2 5.7 41.1 1.5 5.0 5.8 172 0.8 1963 1968 … 2003 2003 New Caledonia B 60 23.6 46.6 1.9 6.4 .. 1.1 4.5 586 17.8 - - - - - Georgia B 167 4.0 57.1 -2.7 -15.6 1.0 -50.0 -11.5 695 6.8 1999 1999 … 2006 2006 Papua New Guinea CR 25 0.4 37.4 -0.8 -0.2 10.0 — — 13 0.2 1986 1986 … … … Iraq CR 83 0.3 31.1 -8.6 -41.7 39.5 -115.4 -3.9 389 0.6 … … … 2009 … Solomon Islands B 7 1.3 43.9 1.5 0.7 .. — — 20 5.3 1995 1995 … … … Israel BR 2 940 40.4 55.9 2.0 333.3 9.1 17.0 2.4 1 042 0.6 1954 1968 … 2008 … Vanuatu B 1 0.3 46.8 -4.9 -0.2 0.0 — — 6 1.2 … … … … … Jordan CR 2 973 45.9 49.2 4.7 405.2 2 452.0 50.0 8.3 3 434 21.7 … … … 2009 … Micronesia 151 26.4 45.0 0.9 8.7 0.0 -2.1 -3.8 7 9.0 — — — 1 1 Kuwait CR 2 098 68.8 30.0 2.3 245.7 38.2 24.0 8.3 .. .. … … … 2006 2006 Guam B 79 43.9 43.6 0.6 4.0 .. — — .. .. - - - - - Lebanon BR 758 17.8 49.2 1.0 19.1 472.6 -2.5 -0.6 5 769 23.7 … … … 2005 2005 Kiribati B 2 2.0 48.8 -0.2 0.0 .. -0.2 -2.1 7 9.0 … … … 2005 2005 Occupied Palestinian Territory B 1 924 43.6 49.2 2.9 — 1 836.1 -2.0 -0.5 598 14.9 - - - - - Marshall Islands B 2 2.7 41.0 0.5 0.1 .. -0.5 -8.3 .. .. … … … … … Oman C 826 28.4 20.8 4.3 166.8 0.0 4.0 1.4 39 0.1 … … … 2005 2005 Micronesia (Fed. States of) B 3 2.4 46.4 -1.5 -0.1 0.0 -1.8 -16.3 .. .. … … … … … Qatar C 1 305 86.5 25.8 12.1 598.0 0.0 112.4 93.9 .. .. … … … 2009 … Nauru C 5 51.8 45.0 1.5 0.5 .. -0.1 -9.0 .. .. … … … … … Saudi Arabia CR 7 289 27.8 30.1 2.8 1 042.0 240.6 30.0 1.2 .. .. … … … 2007 2007 Northern Mariana Islands B 55 62.0 47.4 1.5 4.4 .. 0.6 7.1 .. .. - - - - - Syrian Arab Republic CR 2 206 9.8 49.0 10.2 839.7 1 567.6 160.0 7.7 824 2.2 … … 2005 2009 … Palau B 6 28.1 40.2 -0.9 -0.1 .. -0.1 -4.9 .. .. … … … … … Turkey BR 1 411 1.9 52.0 1.1 106.4 11.1 -8.9 -0.1 1 209 0.2 1962 1968 2004 2003 2003 Polynesia 79 11.8 46.8 1.6 7.4 .. -5.6 -8.5 885 19.3 2 2 — — — United Arab Emirates CR 3 293 70.0 27.4 2.8 451.8 0.2 68.6 15.6 .. .. … … … 2009 … American Samoa B 28 41.4 49.0 1.3 2.2 .. -0.2 -3.0 .. .. - - - - - Yemen BR 518 2.1 38.3 2.6 75.3 140.2 -27.0 -1.2 1 322 5.9 1980 1980 … … … Cook Islands B 3 14.1 44.3 0.1 0.1 .. -0.1 -3.2 .. .. - - - - - Europe 69 819 9.5 52.3 1.6 8 097.5 1 602.2 1 340.6 1.8 125 429 0.7 42 41 2 37 36 French Polynesia B 35 12.8 45.4 1.4 2.9 .. — — 666 17.5 - - - - - Eastern Europe 21 046 7.2 57.3 0.1 1 193.6 41.1 -10.2 0.0 37 582 1.5 10 10 — 9 9 Niue B 0 25.6 45.9 -1.1 0.0 .. -0.1 -32.4 .. .. - - - - - Belarus B 1 090 11.4 54.2 -0.3 43.0 0.6 — — 354 0.8 2001 2001 … 2003 2003 Pitcairn I 0 12.0 33.3 0.0 0.0 .. — — .. .. - - - - - Bulgaria B 107 1.4 57.9 0.6 8.7 5.1 -10.0 -1.3 2 132 5.4 1993 1993 … 2001 2001 Samoa B 9 5.0 44.7 4.5 2.0 .. -3.3 -18.4 120 22.8 1988 1994 … … … Czech Republic B 453 4.4 53.2 0.0 17.7 2.1 45.1 4.4 1 332 0.8 1993 1993 … … … Tokelau B 0 21.5 52.9 0.1 0.0 .. 0.0 -16.5 .. .. - - - - - Hungary BR 368 3.7 56.4 2.0 51.4 7.8 15.0 1.5 2 530 1.8 1989 1989 … 2006 2006 Tonga B 1 0.8 48.7 -6.3 -0.3 .. -1.8 -17.5 100 39.4 … … … … … Poland B 827 2.2 59.0 0.0 32.1 12.8 -24.0 -0.6 10 496 2.5 1991 1991 … 2003 2003 Tuvalu C 0 1.5 45.7 -3.8 0.0 .. -0.1 -10.1 .. .. 1986 1986 … … … Republic of Moldova B 408 11.4 56.0 -1.5 -10.9 0.1 -34.3 -9.4 1 498 34.1 2002 2002 … 2005 2005 Wallis and Futuna Islands B 3 18.1 49.5 3.3 0.5 .. -0.1 -5.3 .. .. - - - - - Countries with the largest number of international migrants, 2010 (millions) Countries with the highest percentage of international migrants, 2010* International migrant stock by major area Percentage female among the migrant stock by major area 250 Oceania United States of America 42.8 Qatar 87% Latin America and the Caribbean Africa Russian Federation 12.3 United Arab Emirates 56.0 70% 200 Northern America 1990 1995 2000 2005 2010 Asia 54.0 Germany 10.8 Kuwait 69% Europe