SlideShare ist ein Scribd-Unternehmen logo
1 von 2
SUOZZI PRIMARY CAMPAIGN (2001)
        Analysis for the 13TH Legislative District Nassau County, NY

                                   Jason Zervoudakes

     10 statistical analyses were made for the 13th Legislative District (9 regression
     and a multiple regression with Analysis of Variance) in order to find out which
     groups were more likely to vote in a Primary election. The voter histories of the
     1999 General and 2000 Presidential Primary were used because of similar
     turnouts. Normally, the practice is to use three elections when making these
     types of analyses. However, voter history records for the 1997 election in the
     county weren’t automated and therefore not included. The voter histories of the
     1999 and 2000 elections were tallied and converted into percentages. The
     dependent variable is the percentage of people who voted in either of the
     elections. Table 1 lists all the independent variables with significant results
     shaded in blue. Regression analyses confirm the group most likely to vote is
     between the ages of 50 to 59. However, the campaign is safe if it targets voters
     between the ages of 40 and 79. Tables 2-4 list the raw tallies.

                       TABLE 1- REGRESSION ANALYSES
            Percentage of People Who Voted vs. Age and Gender groups

Analysis              Correlation         Residual     Standard      P-Value
                      Coefficient         Squared      Error
Age 50-59             .70 (strong)             48.3%          3.9%           0 (significant)
Age 60-69             .67 (strong)             44.5%          4.0%           0 (significant)
Age 40-49             .62 (strong)             39.6%          4.2%           0 (significant)
Age 70-79             .62 (strong)             38.2%          9.0%           0 (significant)
Age 80+               .45 (mod strong)         20.4%          4.8%           0 (significant)
Age 30-39             .32 (weak)               10.2%          5.1%         .01 (significant)
Age 18-29             .20 (weak)                4.2%          5.2%     .12 (not significant)
Male Percentage       .89 (very strong)        78.4%          2.5%           0 (significant)
Female Percentage     .94 (very strong)        87.7%          1.9%           0 (significant)


                          MULTIPLE REGRESSION ANALYSIS

     Voter Percentage (Dependent variable) vs. Female and Male Percentage
     (Independent variables)

     The analysis of Variance (ANOVA) resulted in a p-value of .23 meaning the data
     occurred due to chance and is insignificant. Therefore, it is irrelevant which
     gender votes in a primary. The following data exemplifies this.

     Average percentages
Male percentage was 26%. Female percentage was 24%. Overall voting
percentage was 25%

                            Demographics
                Table 2: Overall Registrants (n= 13639)

       Group                  Number of                Percentage
                              Registrants
Males                  5715                      42%
Females                7924                      58%
Age 18-29              1989                      15%
Age 30-39              2214                      16%
Age 40-49              3180                      26%
Age 50-59              2637                      19%
Age 60-69              1363                      10%
Age 70-79              1570                      12%
Age 80+                686                       5%

            Table 3: 1999 General Election Voters (n=3877)

       Group             Number of Voters              Percentage
Males                  1719                      44%
Females                2158                      56%
Age 18-29              121                       3%
Age 30-39              282                       7%
Age 40-49              834                       22%
Age 50-59              878                       23%
Age 60-69              600                       15%
Age 70-79              878                       23%
Age 80+                284                       7%

            Table 4: 2000 Primary Election Voters (n=3004)

       Group             Number of Voters              Percentage
Males                  1280                      43%
Females                1724                      57%
Age 18-29              140                       5%
Age 30-39              245                       8%
Age 40-49              691                       23%
Age 50-59              701                       23%
Age 60-69              426                       14%
Age 70-79              614                       20%
Age 80+                187                       6%

Weitere ähnliche Inhalte

Was ist angesagt?

Civil beat poll sept. 7 8, 2010 mayor crosstabs and toplines
Civil beat poll sept. 7 8, 2010 mayor crosstabs and toplinesCivil beat poll sept. 7 8, 2010 mayor crosstabs and toplines
Civil beat poll sept. 7 8, 2010 mayor crosstabs and toplinesHonolulu Civil Beat
 
The Future of the CIO
The Future of the CIOThe Future of the CIO
The Future of the CIOdlind889
 
NCHLP Polling Presentation
NCHLP Polling PresentationNCHLP Polling Presentation
NCHLP Polling Presentationccpnc
 
Zoom (reduced field of view) Magnetic Resonance Spectroscopic Imaging MRSI
Zoom (reduced field of view) Magnetic Resonance Spectroscopic Imaging MRSI Zoom (reduced field of view) Magnetic Resonance Spectroscopic Imaging MRSI
Zoom (reduced field of view) Magnetic Resonance Spectroscopic Imaging MRSI Uzay Emir
 
1) 1999, 2001, and 2008 CIRP Frequency Distribution Trend Results of CMU Resp...
1) 1999, 2001, and 2008 CIRP Frequency Distribution Trend Results of CMU Resp...1) 1999, 2001, and 2008 CIRP Frequency Distribution Trend Results of CMU Resp...
1) 1999, 2001, and 2008 CIRP Frequency Distribution Trend Results of CMU Resp...Digithead
 

Was ist angesagt? (8)

Civil beat poll sept. 7 8, 2010 mayor crosstabs and toplines
Civil beat poll sept. 7 8, 2010 mayor crosstabs and toplinesCivil beat poll sept. 7 8, 2010 mayor crosstabs and toplines
Civil beat poll sept. 7 8, 2010 mayor crosstabs and toplines
 
Stat 2 data presentation2
Stat 2 data presentation2Stat 2 data presentation2
Stat 2 data presentation2
 
The Future of the CIO
The Future of the CIOThe Future of the CIO
The Future of the CIO
 
NCHLP Polling Presentation
NCHLP Polling PresentationNCHLP Polling Presentation
NCHLP Polling Presentation
 
Zoom (reduced field of view) Magnetic Resonance Spectroscopic Imaging MRSI
Zoom (reduced field of view) Magnetic Resonance Spectroscopic Imaging MRSI Zoom (reduced field of view) Magnetic Resonance Spectroscopic Imaging MRSI
Zoom (reduced field of view) Magnetic Resonance Spectroscopic Imaging MRSI
 
PRP rail mayor poll 5 23
PRP rail mayor poll 5 23PRP rail mayor poll 5 23
PRP rail mayor poll 5 23
 
1) 1999, 2001, and 2008 CIRP Frequency Distribution Trend Results of CMU Resp...
1) 1999, 2001, and 2008 CIRP Frequency Distribution Trend Results of CMU Resp...1) 1999, 2001, and 2008 CIRP Frequency Distribution Trend Results of CMU Resp...
1) 1999, 2001, and 2008 CIRP Frequency Distribution Trend Results of CMU Resp...
 
Rehema chapter 4
Rehema   chapter 4Rehema   chapter 4
Rehema chapter 4
 

Andere mochten auch

2012 projektipaiva hanke-esittelyt
2012 projektipaiva hanke-esittelyt2012 projektipaiva hanke-esittelyt
2012 projektipaiva hanke-esittelytJaana Seipiharju
 
Virtauskokemuksen teleologia musiikkikasvatuksessa
Virtauskokemuksen teleologia musiikkikasvatuksessaVirtauskokemuksen teleologia musiikkikasvatuksessa
Virtauskokemuksen teleologia musiikkikasvatuksessaRisto Ala-Kaila
 
The way we see evaluation could happen in the near future with games in educa...
The way we see evaluation could happen in the near future with games in educa...The way we see evaluation could happen in the near future with games in educa...
The way we see evaluation could happen in the near future with games in educa...Santeri Koivisto
 
Michefallcatalog 130804222518-phpapp02
Michefallcatalog 130804222518-phpapp02Michefallcatalog 130804222518-phpapp02
Michefallcatalog 130804222518-phpapp02Leesa Mitchell
 
Star Foundation Wish List
Star Foundation Wish ListStar Foundation Wish List
Star Foundation Wish Liststarfoundation
 
Kertolaskua kymmenillä ja sadoilla
Kertolaskua kymmenillä ja sadoillaKertolaskua kymmenillä ja sadoilla
Kertolaskua kymmenillä ja sadoillaParkanon kaupunki
 
Information system versi chalk
Information system versi chalkInformation system versi chalk
Information system versi chalkSaskya Irena
 
Exploded final
Exploded finalExploded final
Exploded finalDanielM31
 
Salto de página y salto de sección Word
Salto de página y salto de sección WordSalto de página y salto de sección Word
Salto de página y salto de sección WordJhonatan Saez
 
Puhtaat vaatteet olari
Puhtaat  vaatteet olariPuhtaat  vaatteet olari
Puhtaat vaatteet olariKatjaHin
 

Andere mochten auch (20)

KL_TP
KL_TPKL_TP
KL_TP
 
2012 projektipaiva hanke-esittelyt
2012 projektipaiva hanke-esittelyt2012 projektipaiva hanke-esittelyt
2012 projektipaiva hanke-esittelyt
 
Virtauskokemuksen teleologia musiikkikasvatuksessa
Virtauskokemuksen teleologia musiikkikasvatuksessaVirtauskokemuksen teleologia musiikkikasvatuksessa
Virtauskokemuksen teleologia musiikkikasvatuksessa
 
MoNo
MoNoMoNo
MoNo
 
Slideshare
SlideshareSlideshare
Slideshare
 
SIC-2011-07-19-1
SIC-2011-07-19-1SIC-2011-07-19-1
SIC-2011-07-19-1
 
The way we see evaluation could happen in the near future with games in educa...
The way we see evaluation could happen in the near future with games in educa...The way we see evaluation could happen in the near future with games in educa...
The way we see evaluation could happen in the near future with games in educa...
 
Michefallcatalog 130804222518-phpapp02
Michefallcatalog 130804222518-phpapp02Michefallcatalog 130804222518-phpapp02
Michefallcatalog 130804222518-phpapp02
 
Star Foundation Wish List
Star Foundation Wish ListStar Foundation Wish List
Star Foundation Wish List
 
121018 vnf ViA_SAieksnvo
121018 vnf ViA_SAieksnvo121018 vnf ViA_SAieksnvo
121018 vnf ViA_SAieksnvo
 
Kertolaskua kymmenillä ja sadoilla
Kertolaskua kymmenillä ja sadoillaKertolaskua kymmenillä ja sadoilla
Kertolaskua kymmenillä ja sadoilla
 
Information system versi chalk
Information system versi chalkInformation system versi chalk
Information system versi chalk
 
Pei
PeiPei
Pei
 
Sab ki khabren
Sab ki khabrenSab ki khabren
Sab ki khabren
 
energia
energiaenergia
energia
 
Exploded final
Exploded finalExploded final
Exploded final
 
bonitas
bonitasbonitas
bonitas
 
Salto de página y salto de sección Word
Salto de página y salto de sección WordSalto de página y salto de sección Word
Salto de página y salto de sección Word
 
Rufio
RufioRufio
Rufio
 
Puhtaat vaatteet olari
Puhtaat  vaatteet olariPuhtaat  vaatteet olari
Puhtaat vaatteet olari
 

Ähnlich wie 2001 Suozzi Primary Campaign

02 investigaytors nov1 (nx powerlite)
02 investigaytors nov1 (nx powerlite)02 investigaytors nov1 (nx powerlite)
02 investigaytors nov1 (nx powerlite)CBRC
 
Age differences in high prevalence of sexual concurrency and concurrent UAI a...
Age differences in high prevalence of sexual concurrency and concurrent UAI a...Age differences in high prevalence of sexual concurrency and concurrent UAI a...
Age differences in high prevalence of sexual concurrency and concurrent UAI a...CDC NPIN
 
Nigeria Demography - state by state
Nigeria Demography - state by stateNigeria Demography - state by state
Nigeria Demography - state by statestatisense
 
Demography of Karail slum in dhaka
Demography of Karail slum in dhakaDemography of Karail slum in dhaka
Demography of Karail slum in dhakaMd. Alamgir Hossen
 
Basic Demographic Indicators_21 Jan 2022.pptx
Basic Demographic Indicators_21 Jan 2022.pptxBasic Demographic Indicators_21 Jan 2022.pptx
Basic Demographic Indicators_21 Jan 2022.pptxHongTrcng
 
Who are the Smokers and what Factors Influence Smoking among Amassoma Communi...
Who are the Smokers and what Factors Influence Smoking among Amassoma Communi...Who are the Smokers and what Factors Influence Smoking among Amassoma Communi...
Who are the Smokers and what Factors Influence Smoking among Amassoma Communi...iosrphr_editor
 
The Jury Perspective The Psychology Of Race And Gender In Discrimination Cases
The Jury Perspective The Psychology Of Race And Gender In Discrimination CasesThe Jury Perspective The Psychology Of Race And Gender In Discrimination Cases
The Jury Perspective The Psychology Of Race And Gender In Discrimination CasesMelissa Gomez
 
Appendices Group A
Appendices Group AAppendices Group A
Appendices Group Anbastedo
 
2016 nevada hiv fast facts
2016 nevada hiv fast facts 2016 nevada hiv fast facts
2016 nevada hiv fast facts #GOMOJO, INC.
 
2019ICS_Key_findings_main_launch_Myanmar
2019ICS_Key_findings_main_launch_Myanmar2019ICS_Key_findings_main_launch_Myanmar
2019ICS_Key_findings_main_launch_MyanmarKhaingKhaingSoe
 

Ähnlich wie 2001 Suozzi Primary Campaign (14)

02 investigaytors nov1 (nx powerlite)
02 investigaytors nov1 (nx powerlite)02 investigaytors nov1 (nx powerlite)
02 investigaytors nov1 (nx powerlite)
 
Age differences in high prevalence of sexual concurrency and concurrent UAI a...
Age differences in high prevalence of sexual concurrency and concurrent UAI a...Age differences in high prevalence of sexual concurrency and concurrent UAI a...
Age differences in high prevalence of sexual concurrency and concurrent UAI a...
 
Gender Earnings Differentials Across Earnings Quantiles: Evidence from the li...
Gender Earnings Differentials Across Earnings Quantiles: Evidence from the li...Gender Earnings Differentials Across Earnings Quantiles: Evidence from the li...
Gender Earnings Differentials Across Earnings Quantiles: Evidence from the li...
 
Nigeria Demography - state by state
Nigeria Demography - state by stateNigeria Demography - state by state
Nigeria Demography - state by state
 
Demography of Karail slum in dhaka
Demography of Karail slum in dhakaDemography of Karail slum in dhaka
Demography of Karail slum in dhaka
 
Basic Demographic Indicators_21 Jan 2022.pptx
Basic Demographic Indicators_21 Jan 2022.pptxBasic Demographic Indicators_21 Jan 2022.pptx
Basic Demographic Indicators_21 Jan 2022.pptx
 
Gendeer gap rakesh
Gendeer gap rakeshGendeer gap rakesh
Gendeer gap rakesh
 
Epidemiologic Profile Preview
Epidemiologic Profile PreviewEpidemiologic Profile Preview
Epidemiologic Profile Preview
 
Who are the Smokers and what Factors Influence Smoking among Amassoma Communi...
Who are the Smokers and what Factors Influence Smoking among Amassoma Communi...Who are the Smokers and what Factors Influence Smoking among Amassoma Communi...
Who are the Smokers and what Factors Influence Smoking among Amassoma Communi...
 
Presentation1 (5)
Presentation1 (5)Presentation1 (5)
Presentation1 (5)
 
The Jury Perspective The Psychology Of Race And Gender In Discrimination Cases
The Jury Perspective The Psychology Of Race And Gender In Discrimination CasesThe Jury Perspective The Psychology Of Race And Gender In Discrimination Cases
The Jury Perspective The Psychology Of Race And Gender In Discrimination Cases
 
Appendices Group A
Appendices Group AAppendices Group A
Appendices Group A
 
2016 nevada hiv fast facts
2016 nevada hiv fast facts 2016 nevada hiv fast facts
2016 nevada hiv fast facts
 
2019ICS_Key_findings_main_launch_Myanmar
2019ICS_Key_findings_main_launch_Myanmar2019ICS_Key_findings_main_launch_Myanmar
2019ICS_Key_findings_main_launch_Myanmar
 

Mehr von unclejay

eBay Sample Bust Quarter 8/28/12
eBay Sample Bust Quarter 8/28/12eBay Sample Bust Quarter 8/28/12
eBay Sample Bust Quarter 8/28/12unclejay
 
How to Be Self Sufficient
How to Be Self SufficientHow to Be Self Sufficient
How to Be Self Sufficientunclejay
 
How To Survive In The Neurotypical World
How To Survive In The Neurotypical WorldHow To Survive In The Neurotypical World
How To Survive In The Neurotypical Worldunclejay
 
Changes- 12 "Rules of Life"
Changes- 12 "Rules of Life"Changes- 12 "Rules of Life"
Changes- 12 "Rules of Life"unclejay
 
Changes In Everyday Life
Changes In Everyday LifeChanges In Everyday Life
Changes In Everyday Lifeunclejay
 
Facilitate Good Conversation
Facilitate Good ConversationFacilitate Good Conversation
Facilitate Good Conversationunclejay
 
Non Verbal Communication
Non Verbal CommunicationNon Verbal Communication
Non Verbal Communicationunclejay
 
Fight Procrastination
Fight ProcrastinationFight Procrastination
Fight Procrastinationunclejay
 
Affirmations
AffirmationsAffirmations
Affirmationsunclejay
 
Pan2010 outline
Pan2010 outlinePan2010 outline
Pan2010 outlineunclejay
 

Mehr von unclejay (10)

eBay Sample Bust Quarter 8/28/12
eBay Sample Bust Quarter 8/28/12eBay Sample Bust Quarter 8/28/12
eBay Sample Bust Quarter 8/28/12
 
How to Be Self Sufficient
How to Be Self SufficientHow to Be Self Sufficient
How to Be Self Sufficient
 
How To Survive In The Neurotypical World
How To Survive In The Neurotypical WorldHow To Survive In The Neurotypical World
How To Survive In The Neurotypical World
 
Changes- 12 "Rules of Life"
Changes- 12 "Rules of Life"Changes- 12 "Rules of Life"
Changes- 12 "Rules of Life"
 
Changes In Everyday Life
Changes In Everyday LifeChanges In Everyday Life
Changes In Everyday Life
 
Facilitate Good Conversation
Facilitate Good ConversationFacilitate Good Conversation
Facilitate Good Conversation
 
Non Verbal Communication
Non Verbal CommunicationNon Verbal Communication
Non Verbal Communication
 
Fight Procrastination
Fight ProcrastinationFight Procrastination
Fight Procrastination
 
Affirmations
AffirmationsAffirmations
Affirmations
 
Pan2010 outline
Pan2010 outlinePan2010 outline
Pan2010 outline
 

2001 Suozzi Primary Campaign

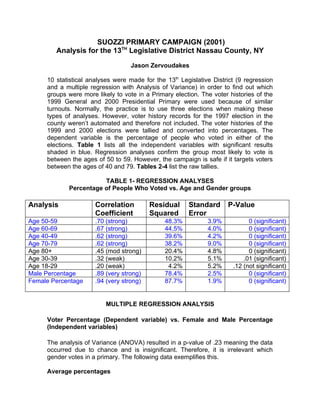
  • 1. SUOZZI PRIMARY CAMPAIGN (2001) Analysis for the 13TH Legislative District Nassau County, NY Jason Zervoudakes 10 statistical analyses were made for the 13th Legislative District (9 regression and a multiple regression with Analysis of Variance) in order to find out which groups were more likely to vote in a Primary election. The voter histories of the 1999 General and 2000 Presidential Primary were used because of similar turnouts. Normally, the practice is to use three elections when making these types of analyses. However, voter history records for the 1997 election in the county weren’t automated and therefore not included. The voter histories of the 1999 and 2000 elections were tallied and converted into percentages. The dependent variable is the percentage of people who voted in either of the elections. Table 1 lists all the independent variables with significant results shaded in blue. Regression analyses confirm the group most likely to vote is between the ages of 50 to 59. However, the campaign is safe if it targets voters between the ages of 40 and 79. Tables 2-4 list the raw tallies. TABLE 1- REGRESSION ANALYSES Percentage of People Who Voted vs. Age and Gender groups Analysis Correlation Residual Standard P-Value Coefficient Squared Error Age 50-59 .70 (strong) 48.3% 3.9% 0 (significant) Age 60-69 .67 (strong) 44.5% 4.0% 0 (significant) Age 40-49 .62 (strong) 39.6% 4.2% 0 (significant) Age 70-79 .62 (strong) 38.2% 9.0% 0 (significant) Age 80+ .45 (mod strong) 20.4% 4.8% 0 (significant) Age 30-39 .32 (weak) 10.2% 5.1% .01 (significant) Age 18-29 .20 (weak) 4.2% 5.2% .12 (not significant) Male Percentage .89 (very strong) 78.4% 2.5% 0 (significant) Female Percentage .94 (very strong) 87.7% 1.9% 0 (significant) MULTIPLE REGRESSION ANALYSIS Voter Percentage (Dependent variable) vs. Female and Male Percentage (Independent variables) The analysis of Variance (ANOVA) resulted in a p-value of .23 meaning the data occurred due to chance and is insignificant. Therefore, it is irrelevant which gender votes in a primary. The following data exemplifies this. Average percentages
  • 2. Male percentage was 26%. Female percentage was 24%. Overall voting percentage was 25% Demographics Table 2: Overall Registrants (n= 13639) Group Number of Percentage Registrants Males 5715 42% Females 7924 58% Age 18-29 1989 15% Age 30-39 2214 16% Age 40-49 3180 26% Age 50-59 2637 19% Age 60-69 1363 10% Age 70-79 1570 12% Age 80+ 686 5% Table 3: 1999 General Election Voters (n=3877) Group Number of Voters Percentage Males 1719 44% Females 2158 56% Age 18-29 121 3% Age 30-39 282 7% Age 40-49 834 22% Age 50-59 878 23% Age 60-69 600 15% Age 70-79 878 23% Age 80+ 284 7% Table 4: 2000 Primary Election Voters (n=3004) Group Number of Voters Percentage Males 1280 43% Females 1724 57% Age 18-29 140 5% Age 30-39 245 8% Age 40-49 691 23% Age 50-59 701 23% Age 60-69 426 14% Age 70-79 614 20% Age 80+ 187 6%